Pushing the production barriers – what does it take to grow 10 t/ha of wheat and 4 t/ha of canola?
Author: Tony Napier (NSW DPI, Yanco), Luke Gaynor (NSW DPI, Wagga Wagga), Neroli Graham (NSW DPI, Tamworth), Cynthia Podmore (NSW DPI, Wagga Wagga) and Deb Slinger (NSW DPI, Wagga Wagga) | Date: 30 Jul 2015
Take home messages
- The correct selection of varieties for use in irrigated systems can significantly improve yield.
- Agronomic management can significantly impact yield on irrigated cereal and canola production.
Background
Recent industry research identified significant potential for increased production and profitability of irrigated cereal and canola. It is estimated that if current yields are increased to optimum trial levels, the farm gate value of cereals and canola almost doubles to $347 million.
Increasing the water use efficiency of irrigated cereal and canola crops is paramount given the increasing uncertainty of water availability in the southern irrigated grain growing regions of Australia. These traditionally dryland crops have a sound fit in southern irrigated rotations as an alternative option to rice when water allocations are low, and provide the additional benefits of being a break crop for weed, disease and pest management.
Selection of better varieties for each situation, location and adoption of improved agronomic management are crucial factors for increasing production. The Southern irrigated cereal and canola varieties achieving target yields (DAN 00198) project aims to increase irrigated cereal and canola production in the GRDC southern irrigated region. This will be achieved by improving grower and adviser knowledge of high yielding cereal and canola varieties for irrigated systems and knowledge of specific agronomy management that will improve production and profitability of cereals and canola under irrigated systems and increase water use efficiency.
Methodology
The project involves research trials conducted over six nodes (locations) in the GRDC southern region. They are Murrumbidgee, (Leeton Field Station, Yanco Agricultural Institute and co-operator’s property, Coleambally); Murray Valley (Rice Research Australia Pty Ltd, Jerilderie); North West Victoria (Kerang); Lachlan (Condobolin and Hillston); South East South Australia (Naracoorte); and Tasmania (Cressy). Each node identified priority research questions that are being addressed by the trials. The five agro-ecological zones covered by the project are NSW Central, NSW Vic Slopes, SA Vic Mallee, SA Vic Bordertown Wimmera, and TAS Grain.
The Murrumbidgee node has two trial sites – Leeton Field Station (LFS) and Coleambally. The wheat trials will evaluate the interaction between variety, plant population and nitrogen management. The canola trials will evaluate the interaction between variety, time of sowing, plant population and nitrogen management.
Site details
Table 1. Wheat trials
| |
LFS |
Coleambally |
|---|---|---|
|
Trial design |
Variety x Density x Nitrogen |
Variety x Density x Nitrogen |
|
Soil type |
Self-mulching medium clay |
Grey medium clay |
|
Previous crop |
Barley |
Barley |
|
Sowing date |
7 May 2014 |
14 May 2014 |
|
Plot size |
6 rows x 10m |
6 rows x 10m |
|
Row spacing |
260mm |
280mm |
|
Irrigation |
Autumn pre-watering Three spring irrigations |
Autumn pre-watering Two spring irrigations |
|
Fungicides |
1/ Tilt at 250 ml/ha (by boom) 2/ Orius @ 150 ml/ha (by boom) |
Orius @ 150 ml/ha (by aircraft) |
|
Herbicides |
1/ Achieve @ 400 ml/ha 2/ MCPA @ 1.25 l/ha (by boom) 9/ Lontrel @ 70 ml/ha (by boom) |
1/ MCPA @ 1.25 l/ha (by boom) 2/ Lontrel @ 70 ml/ha (by boom) |
|
Harvest date |
9 December 2014 |
10 December 2014 |
Table 2. Canola trials
| |
LFS |
Coleambally |
|---|---|---|
|
Trial design |
Variety x Density x sowing time |
Variety x Nitrogen |
|
Soil type |
Self-mulching medium clay |
Heavy red clay |
|
Previous crop |
Barley |
Wheat |
|
Irrigation |
Autumn pre-watering Three spring irrigations |
Autumn pre-watering One spring irrigation |
|
Sowing date |
TOS-1 9 April 2014 TOS-2 16 May 2014 |
14 May 2014 |
|
Plot size |
6 rows x 10m |
6 rows x 10m |
|
Row spacing |
300mm |
300mm |
|
Herbicides |
Verdict @ 100 ml/ha (by boom) Lontrel @ 100 ml/ha (by boom) |
Verdict @ 100 ml/ha (by boom) Lontrel @ 100 ml/ha (by boom) |
|
Harvest date |
TOS-1 12 November 2014 TOS-2 17 November 2014 |
6 November 2014 |
Results
Wheat variety
The varieties evaluated at both locations, LFS and Coleambally
Bolac, Suntop, Corack, Mace, Kiora (VX2485), Wallup, Merinda, Chara, EGA Gregory, Lancer, Dart and Impala.
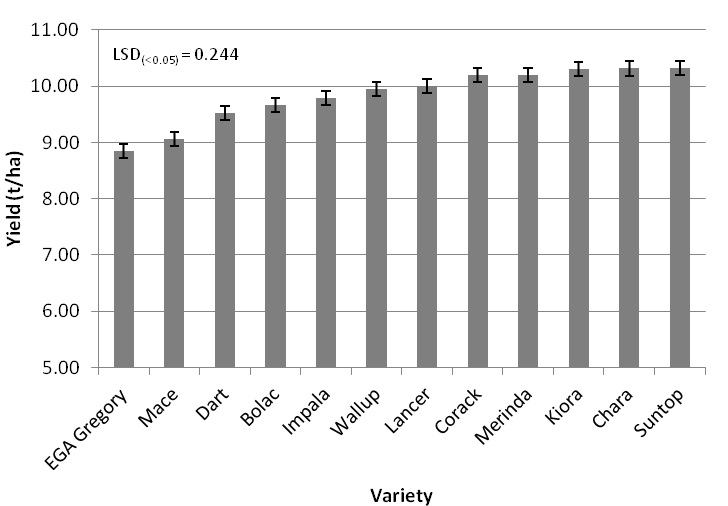
Figure 1. Wheat grain yield of varieties averaged across all nitrogen and plant density treatments at LFS, 2014.
Suntop (10.32 t/ha) and Chara (10.32 t/ha) were the highest yielding varieties at LFS (LFS). Grain yield of these varieties was statistically similar to that of Kiora, Merinda and Corack. Lancer (10.01 t/ha) was the sixth highest yielding variety and was statistically similar to Merinda, Corack and Wallup. EGA Gregory (8.84 t/ha) recorded the lowest yield and was statistically lower than all other varieties except Mace (9.05 t/ha).
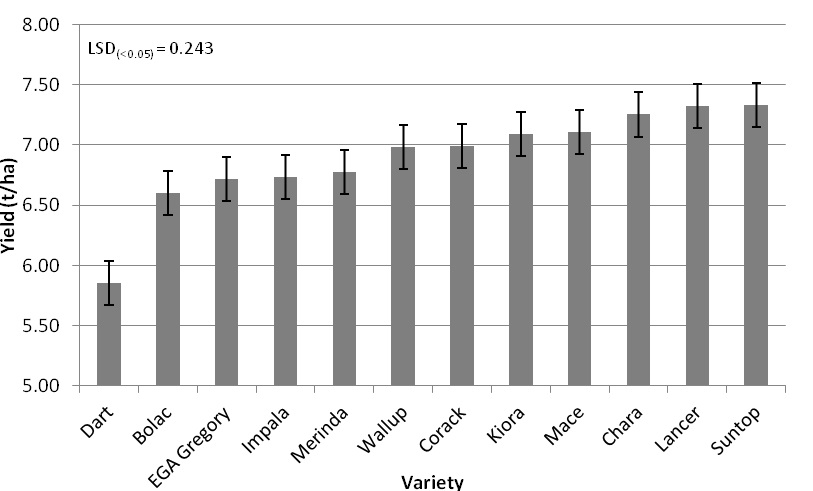
Figure 2. Wheat grain yield of varieties averaged across all nitrogen and plant density treatments at Coleambally, 2014.
Suntop (7.33 t/ha) was the highest yielding variety at Coleambally and was statistically similar to Lancer, Chara and Mace. Kiora (7.09 t/ha) was the fifth highest yielding variety and was statistically similar to Chara and Mace. Dart (5.86 t/ha) recorded the lowest yield and was statistically lower in yield than all other varieties. Bolac (6.00 t/ha) recorded the second lowest yield and was statistically similar in yield to EGA Gregory, Impala and Merinda. The Coleambally wheat trial had one less spring irrigation which may explain the lower yields compared to the LFS trial.
Wheat N management
Table 3. Nitrogen treatments at LFS and Coleambally.
| Site | Application | Nitrogen applied (kg N/ha) | ||
|---|---|---|---|---|
| Pre-sowing | 1st node | Late post-emergent | ||
| LFS | Pre-emergent | 90 | 50 | 30 |
| Post-emergent | 30 | 50 | 90 | |
| Coleambally | Pre-emergent | 90 | 60 | 20 |
| Post-emergent | 90 | 20 | 60 | |
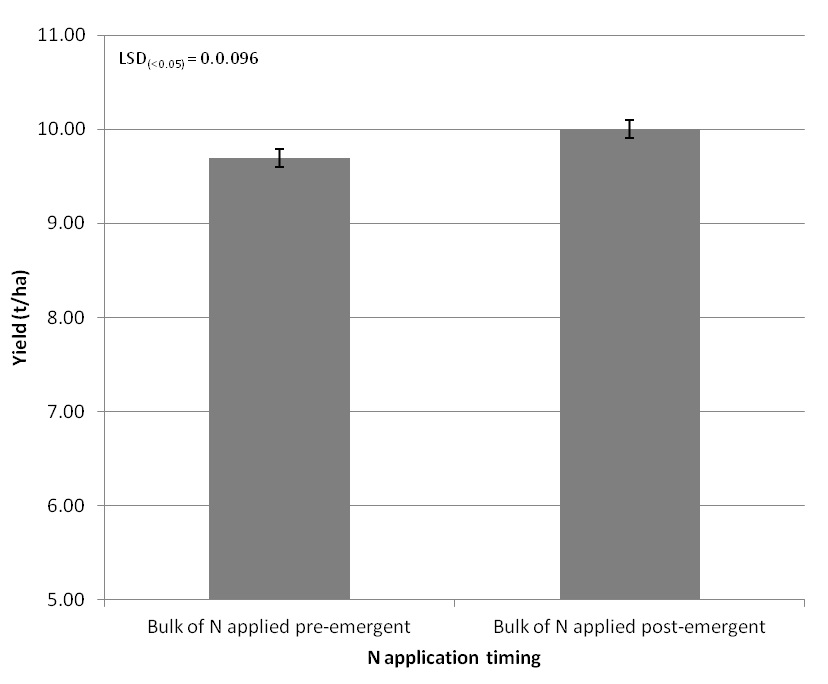
Figure 3. Wheat grain yield of nitrogen treatments averaged across all varieties and plant density treatments at LFS, 2014.
The post-emergent treatment where the bulk of the N was applied post-emergent yielded an average of 10.00 t/ha at LFS. This was statistically higher than the pre-emergent treatment where the bulk of the N was applied pre-emergent which yielded an average of 9.70 t/ha.
Nitrogen management in the Coleambally trial did not significantly affect grain yield. The post-emergent application treatments yielded an average of 6.93 t/ha. This was statistically similar to the pre-emergent treatments (average of 6.86 t/ha).
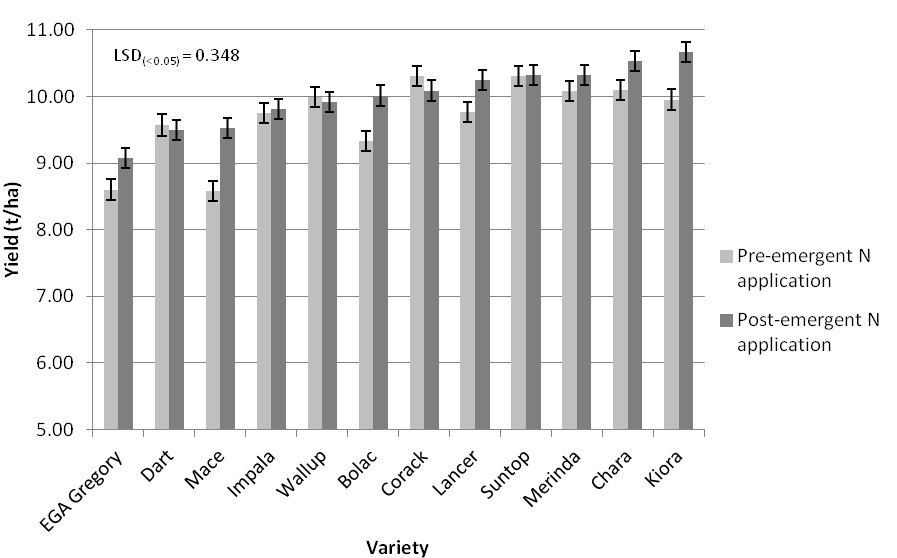
Figure 4. Wheat variety and nitrogen application interaction on grain yield at LFS, 2014.
Kiora (10.67 t/ha) was the highest yielding variety for the post-emergent nitrogen application treatments at the LFS wheat trial. Kiora was statistically similar in grain yield to Chara, Merinda and Suntop. EGA Gregory (9.08 t/ha) was the lowest yielding variety in the post-emergent nitrogen treatments and had significantly lower yield than all other varieties.
Corack (10.31 t/ha) was the highest yielding variety in the pre-emergent nitrogen application treatments at the LFS wheat trial. This was statistically similar in yield to Suntop, Chara, Merinda and Wallup. Mace (8.58 t/ha) was the lowest yielding variety in the pre-emergent nitrogen treatments. Mace and EGA Gregory yielded significantly lower than all other varieties.
The variety and nitrogen timing interaction appear to be related to wheat maturity. The earlier maturing varieties performing better with earlier applications of nitrogen and the later maturing varieties performing better with the later applications of nitrogen.
Wheat – plant density
There were two plant density treatments at LFS:
- Low – 140 established plants/m2
- High – 210 established plants/m2
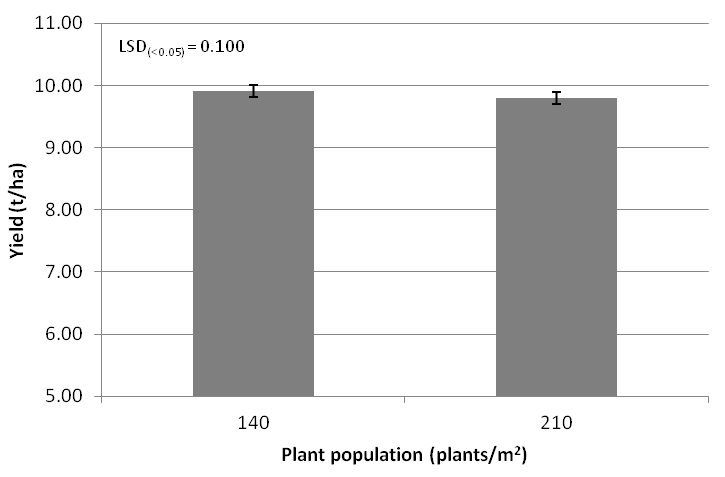
Figure 5. Wheat grain yield of plant density treatments across all varieties and nitrogen treatments at LFS, 2014.
At the LFS wheat trial, the low plant population treatments (140 plants/m2) had an average grain yield of 9.90 t/ha. This was statistically higher than the high plant population treatments (210 plants/m2) which had an average grain yield of 9.80 t/ha.
At the Coleambally wheat trial, plant density did not significantly affect grain yield. The high plant population treatment had an average grain yield of 6.91 t/ha which was statistically similar to the low plant population treatment which had an average grain yield of 6.89 t/ha.
Overall there was no strong plant population effect on grain yield. The key message is to ensure an even plant stand for optimum yield potential.
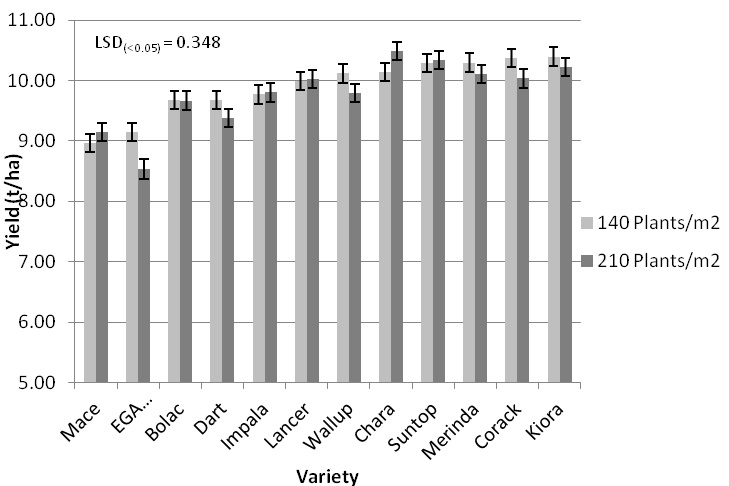
Figure 6. Wheat variety and plant density interaction on grain yield at LFS, 2014.
At the LFS wheat trial, Kiora (10.40 t/ha) was the highest yielding variety for the low plant density treatments (140 plants/m2). This was statistically similar in yield to Corack, Merinda, Suntop, Chara and Wallup. Mace was the lowest yielding variety with a grain yield of 8.96 t/ha. Mace and EGA Gregory both had significantly lower grain yield than all other varieties for the low density treatments.
Chara (10.49 t/ha) was the highest yielding variety in the high plant density treatment (210 plants/m2) at the LFS wheat trial. This was statistically similar in yield to Suntop and Kiora. EGA Gregory was the lowest yielding variety with a grain yield of 8.53 t/ha. EGA Gregory was significantly lower in yield than all other varieties for the high plant density treatments.
At the Coleambally wheat trial, the interaction of variety and plant density did not significantly affect grain yield which may have been due to the trial’s lower yield levels. The affect on tillering for each variety at different plant densities will be assessed, and how it affects final grain yield.
Canola – variety and plant population at LFS
Twelve canola varieties were evaluated at LFS. They were:
Pioneer 43C80(CL), Pioneer 44Y84(CL), Pioneer 44Y87(CL), Pioneer 45Y88(CL), ATR-Bonito, AV-Garnet, ATR-Gem, Hyola50, Hyola450TT, Hyola559TT, Hyola 577CL and Victory V3002.
Two established plant populations were evaluated at LFS. They were:
- Low – 30 established plants/m2
- High – 50 established plants/m2
Plant density did not significantly affect varietal yield at LFS. The low plant population treatment (30 plants/m2) averaged 3.69 t/ha which was statistically similar to the high plant population treatment (50 plants/m2) which averaged 3.66 t/ha.
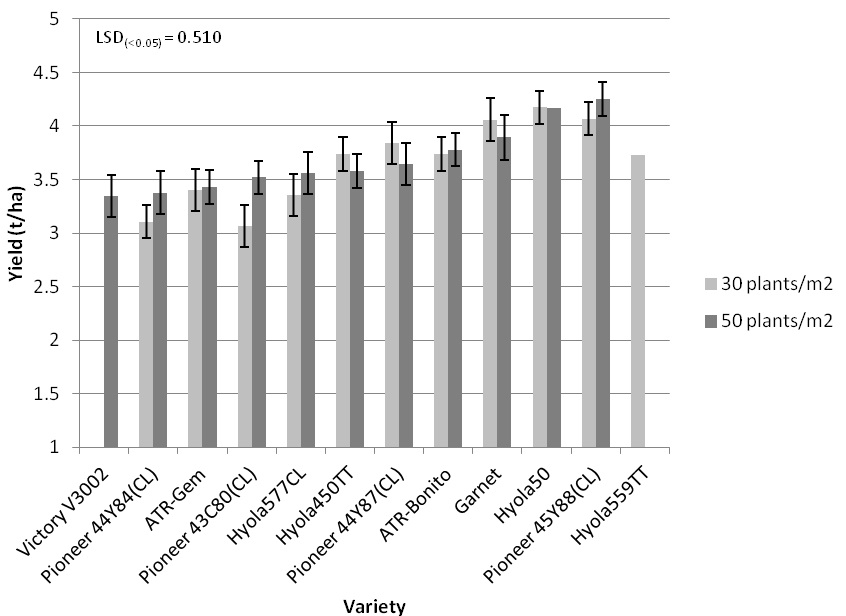
Figure 7. Canola variety and plant density interaction on grain yield at LFS 2014.
Variety and plant density interaction effect was evaluated at LFS. The highest yielding variety-plant density treatment was Pioneer 45Y88(CL) at the high plant density (50 plants/m2) which had a grain yield of 4.25 t/ha. This yield was statistically similar to Pioneer 45Y88 at the low plant density, Hyola 50 at both plant densities, AV-Garnet at both plant densities, Pioneer 44Y87(CL) at the low plant density and ATR-Bonito at the high plant density.
The lowest yielding treatment was Pioneer 43C80(CL) at the low plant density which yielded 3.07 t/ha. This yield was statistically similar to Pioneer 44Y88(CL) at both plant densities, Victory V3002 at the high plant density and Hyola577CL at the low plant density.
Varieties Pioneer 45Y88(CL) and Hyola 50 at both plant densities were the four highest yielding treatments (greater than 4.06 t/ha) and had significantly higher grain yields than varieties Pioneer 43C88(CL), Pioneer 44Y84(CL), Victory V3002 and ATR-GemA at both plant densities.
Canola – time of sowing at LFS
At LFS, the two time of sowing treatment dates were:
- Time of sowing 1 – 9 April 2014
- Time of sowing 2 – 16 May 2014
Time of sowing did not significantly affect yield. ‘Time of sowing 2’ (16 May 2014) had the highest grain yield with an average of 3.73 t/ha, but was statistically similar to ‘Time of sowing 1’ (9 April 2014) with an average grain yield of 3.62 t/ha.
Discussion
The wheat trials both demonstrated that varietal selection is a major driver of achieving high yields. Suntop and Chara were in the highest yielding bracket at both the Coleambally and LFS trial sites. Lancer and Kiora also performed well with both achieving high grain yield at both sites. Dart and Gregory performed poorly and achieved lower than average grain yields at both trial sites.
Timing of nitrogen application had a significant influence on wheat grain yield. At the Leeton site, applying the majority of nitrogen (82%) after the first node stage significantly increased grain yield compared to when the majority of the nitrogen (53%) was applied pre-sowing. At the Coleambally site, all treatments had the majority of the nitrogen (53%) applied pre-sowing. No statistical difference was observed in grain yield between the different topdressing timing treatments at the Coleambally wheat trial.
Variety and nitrogen timing interaction appear to be related to wheat maturity. The earlier maturing varieties performing better with earlier applications of nitrogen while the later maturing varieties performing better with the later applications of nitrogen.
A lower wheat plant density (140 plants/m2) resulted in a significantly higher average yield across all wheat varieties compared to a higher plant density (210 plants/m2) at LFS. However, grain yield response to plant density differed between varieties and therefore individual varietal results should be used as opposed to the average. This is likely due to the variety’s ability to compensate with tillers.
The canola trials also demonstrated that varietal selection is a major driver of achieving high yields. Both the high and low plant density treatments for Pioneer 45Y88(CL), Hyola 50 and AV-Garnet were in the highest yielding bracket at LFS. All treatments of Pioneer 43C80(CL), Pioneer 44Y84(CL), Victory V3002 and ATR-Gem were in the lowest yielding bracket at LFS. No yield difference was observed between the high plant density (50 plants/m2) and low plant density (30 plants/m2) across all treatments. These results also need to be considered carefully as individual varietal results show variable responses to plant density.
Delaying the sowing time of canola at LFS from 9 April 2014 to 16 May 2014 had no effect on grain yield. The first sowing date had significantly more frost damage than the second sowing date but final grain yields were similar for both time of sowing treatments. The sowing time effect requires further investigation outside the event of frost as it is likely that there would be yield differences across sowing times.
No yield difference was observed when comparing nitrogen treatments across all varieties in the Coleambally trial.
Conclusion
The research trials will be conducted for another two years, 2015 and 2016. The research outcomes of the project will also assist with the development of three tools for growers and advisers (due for completion in 2017):
- ‘Irrigated Wheat: Best Practice Guidelines in Southern Irrigated Cropping Systems’ manual
- ‘Irrigated Canola: Best Practice Guidelines in Southern Irrigated Cropping Systems’ manual
- Variety Specific Agronomy Packages (VSAPs) for each research location.
Acknowledgements
The support of Glenn Morris, Paul Morris and Patrick Dando for assistance with trial management, field assessments and data collection is gratefully acknowledged. We would also like to gratefully acknowledge Ken Brain and David Bellato for allowing us to establish the two Coleambally trials on their properties.
The project is co-funded by GRDC and NSW Department of Primary Industries. It involves several grower groups and other research providers who manage the satellite research nodes, and also the Irrigation Research and Extension Committee for communication and extension support.
Contact details
Tony Napier
NSW Department of Primary Industries
Yanco Agricultural Institute
Private Mail Bag, Yanco NSW 2703
02 6951 2796
0427 201 839
tony.napier@dpi.nsw.gov.au
GRDC Project Code: DAN00198,
Was this page helpful?
YOUR FEEDBACK