Plant Available Water Capacity – crop and varietal differences in soil water extraction
Plant Available Water Capacity – crop and varietal differences in soil water extraction
Take home messages
- Crop and varietal differences in soil water extraction are driven by rooting depth, crop duration and demand, and sensitivity to subsoil constraints
- In unconstrained soils, differences between crop species in maximum soil water extraction obtained in seasons with a dry finish or under a rainout shelter are often small, unless rooting depth or crop water demand differ considerably
- The amount of water ‘left behind’ by crops in ‘average’ seasons can differ and is an important consideration when calculating plant available water for the next crop in the rotation.
Introduction
Water availability is the main limitation to yield potential in dryland cropping. Within a farming systems context, the efficiency with which this water is used is determined by crop sequencing and management decisions, such as crop or variety choice, sowing time and fertiliser management. The decisions rely on yield forecasts based on the expected amount of soil water available to the crop.
Water available to the crop includes in-season rainfall, accumulated soil water since harvest of the previous crop and residual water left behind by the previous crop. Stored soil water can be readily measured prior to sowing. However, not all soil water is plant available. Some of the soil water is held too tightly between the soil particles to be extracted by the plant roots. In addition, for some soils subsoil constraints affect root growth and the efficiency of water extraction. At the other extreme, when a soil is very wet, some of the water will drain below the rootzone.
The amount of stored soil water that can be accessed by the plant is quantified using a site-specific characterisations of the soil’s crop lower limit (CLL) and drained upper limit (DUL). The CLL is the water content of a soil below which the roots of a crop can no longer extract the remaining soil water. The DUL is the water content above which water will drain away under gravity. The Plant Available Water Capacity (PAWC) of a soil is the amount of soil water held between the DUL and the CLL (Figure 1). The PAWC represents the maximum amount of plant available water that the soil can store. Plant available water (PAW) is then defined as the actual amount of soil water exceeding CLL at a particular point in time.
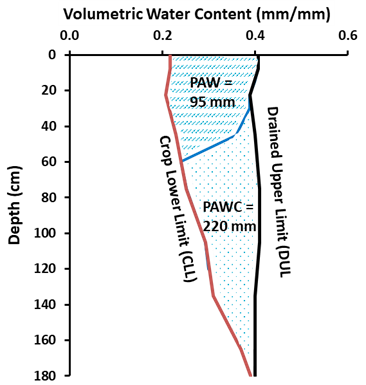 Figure 1. The Plant Available Water Capacity (PAWC) is the total amount of water that a soil can potentially store and release to different crops and is defined by its Drained Upper Limit (DUL) and its crop specific Crop Lower Limit (CLL) – here 220 mm; Plant Available Water (PAW) represents the actual volume of water stored within the soil that is available to the plant at a particular point in time – here 95 mm in the upper soil layer.
The PAWC differs between soils and considerable efforts have been undertaken to characterise and predict PAWC for many different soils across Australia (see links to APSoil database in Resources section). But what is the role of the crop? To what extent do crop characteristics like season length, rooting architecture and sensitivity to subsoil constraints affect the CLL and therefore the estimates of PAWC and PAW? In addition to spatial estimation of PAWC using soil and landscape information (e.g., Verburg et al. 2020), GRDC project CSP00210 has explored crop effects on PAWC. Key findings from the project are summarised here.
Crops grown in pots have a similar ability to extract soil water with full root exploration
Early studies on the lower limit of plant available water date back to the early 1900s. Briggs and Shantz (1912) determined the soil water content at which plants grown in pots were unable to extract any more water and wilted (permanent wilting point). They noticed clear differences among the soils related to soil texture, but in each soil the different plant species wilted at similar water contents (Figure 2).
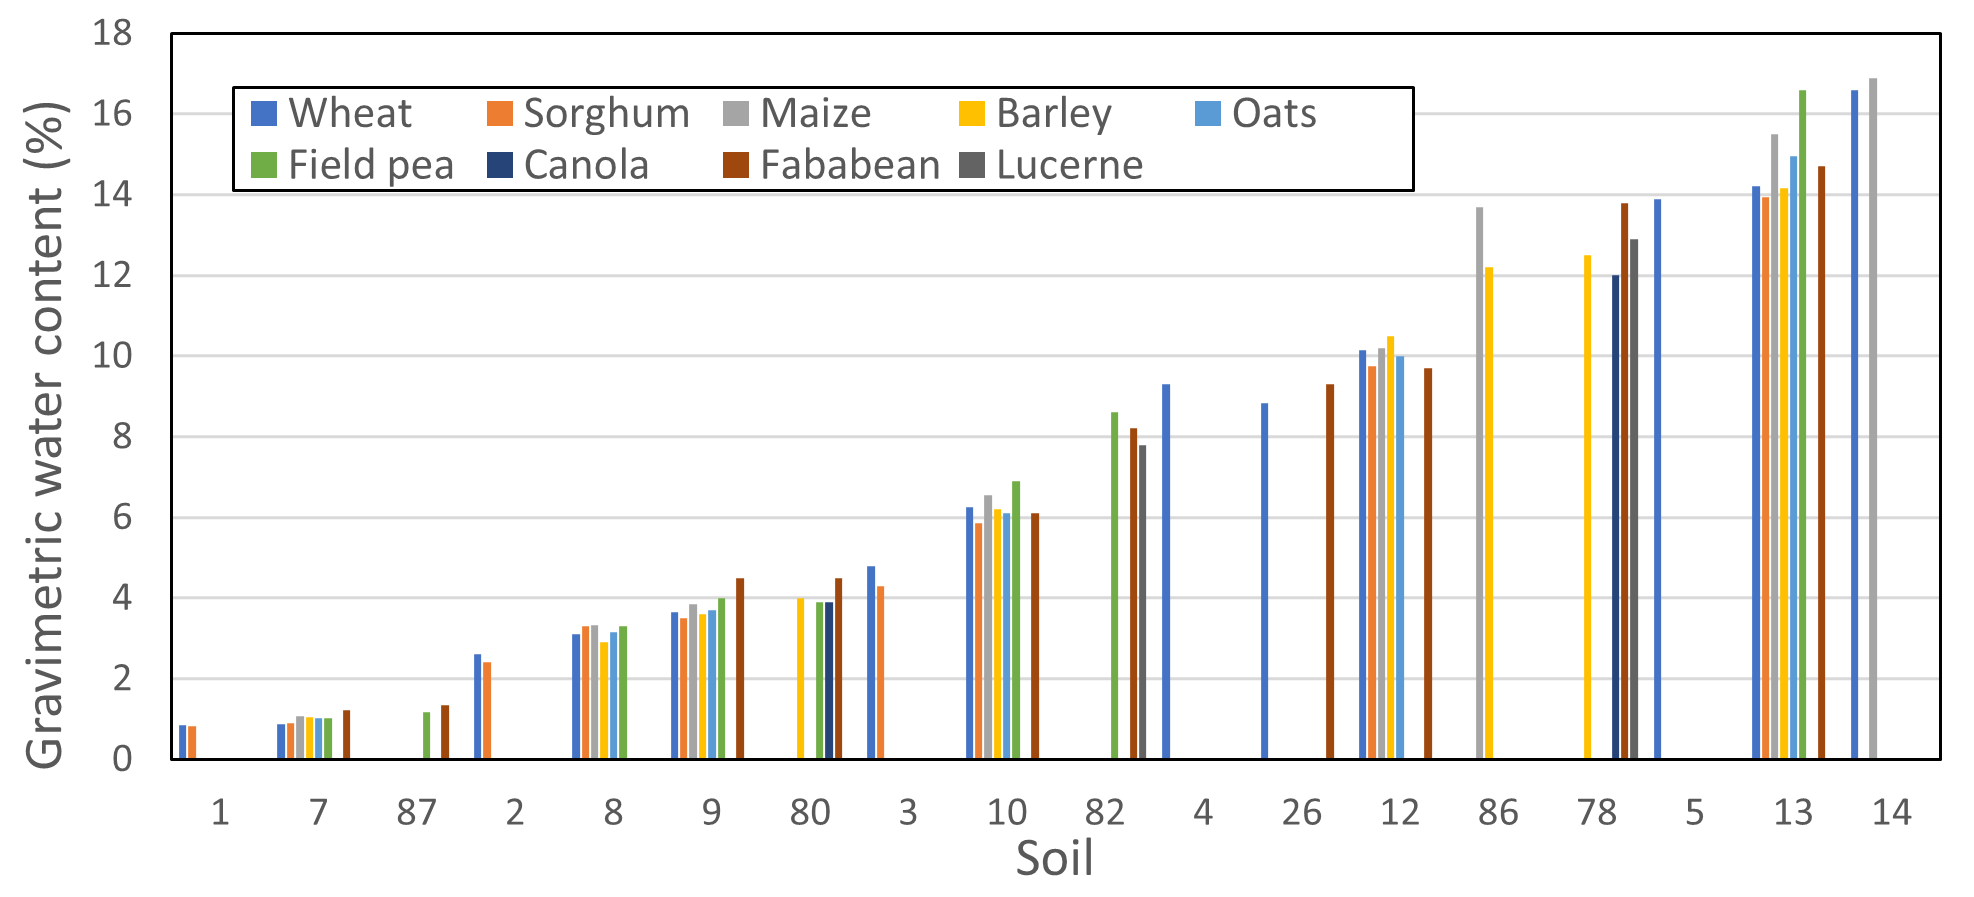 Figure 2. Permanent wilting points for a select number of crops from the study of Briggs and Shantz (1912); soils are arranged according to texture from sand (1,7,87) through to clay loam (13,14).
15 bar soil matric potential measurements capture the effect of soil properties on CLL
The soil differences in Figure 2 were later found to relate to how tightly the water is held within the soil. A pressure plate apparatus (Figure 3) was used to apply high pressures to displace water from the soil. Richards and Weaver (1943) found that soil water contents remaining after a pressure of 15 bar was applied matched the water contents at the permanent wilting point (1 bar is approximately equal to Earth's atmospheric pressure at sea level).
Intuitively this makes sense. It reflects the plant’s ability to extract water against the force with which the water is held by the soil matrix. This force is measured by the soil matric potential and soils have unique relationships between the soil water content and the soil matric potential (known as water retention curves; see Figure 3). Clay soils, which due to their smaller particle size have lots of small pores that hold tightly to soil water, have a higher water content remaining at 15 bar matric potential than loamy or sandy soils.
While it has since been shown that crops do differ slightly in the matric potential at their permanent wilting point, the differences in water content between the various estimates (ranging from 10 to 50 bar) are small because the water retention curve is steep at the dry end, especially in lighter soils.
These early findings led to the assumption that crops did not differ much in their ability to extract soil water and that CLL could be estimated by the ‘15 bar’ method (LL15). This allowed scientists to use a relatively simple laboratory measurement (the pressure plate technique) to estimate CLL of soil samples removed from the field. As it is a soil property, i.e., independent of crop, it also lends itself for digital soil mapping (DSM) predictions.

Field methodology for estimating CLL
In the field, the CLL is defined as the limit of root water extraction in a situation where the crop roots have extracted all the water that was available to the crop. The measurement method requires that the crop root system is well established. This usually means that the crop needs to experience limited or no water stress ahead of anthesis and no shortage of nutrients or disease pressure. After anthesis, the crop needs to be forced to extract the remaining available soil water, which can happen naturally in a season with a dry finish or via exclusion of rainfall using a rainout shelter (Figure 4). This field method for estimating CLL was used for the majority of PAWC characterisations in the publicly available APSoil database (see Resources section). The accompanying DUL measurement was obtained by wetting up an area of soil and letting it drain while covered with plastic to avoid evaporation losses before sampling to determine water content and bulk density.

Field CLLs differ from 15 bar laboratory measurements due to soil-plant-environment interactions
Over the years there have been several comparisons of LL15 measured in the lab with the CLL observed in the field. While some studies found good correlation, others found distinct differences between LL15 and field CLL. Both measurements can be affected by sampling and measurement error, which makes comparisons difficult.
Most of the larger discrepancies between LL15 and field CLL relate to the fact that the CLL for crops growing in the field is affected by soil-plant-environment interactions that affect root exploration and crop demand for soil water. These aspects are not captured in pot trials or 15 bar laboratory measurements. Quite often field CLL is less than LL15 in the surface, due to the influence of evaporation. In contrast the CLL at the bottom of the rootzone is often higher than LL15 – i.e., the crop leaves some water behind relative to LL15 (Figure 5). Field CLL measurements are therefore recommended for study of crop differences relevant to rotation or crop management.
15 bar laboratory measurements may provide a reasonable first estimate of CLL and can compare well with CLL for deep-rooted perennial crops like lucerne. For annual crops, a CLL estimate based on LL15 will require judgment of the rooting depth and tapering towards the DUL may need to be introduced at the bottom of the rootzone to calculate the PAWC. Field measured CLL profiles may provide guidance for that adjustment.
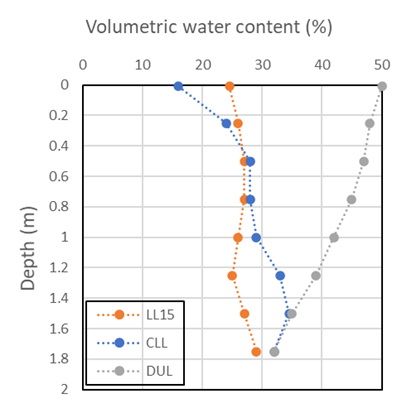
Figure 5. Comparison of LL15, sorghum CLL and DUL profiles demonstrating the effects of evaporation at the surface and water left behind at depth
(figure after Passioura, 1983; data Jordan and Miller, 1980).
Crop species differences in field CLL have been noted, but findings are variable
Unlike the early pot trials, several of the field CLL characterisations in the APSoil database do show crop differences. For example, at Jil Jil in the Victorian Mallee, lentil, fieldpea and to a lesser extent canola showed CLL profiles that tapered more quickly towards the DUL line than wheat (Figure 6a). This site had elevated electrical conductivity (EC, a measure of salinity) below 40 cm. Similarly, chickpea showed higher CLL values at the two sites at Spring Ridge in the NSW Liverpool Plains and at Jimbour in the Qld Darling Downs (Figure 6b,c,d; all sites with mild to severe subsoil salinity). On Vertosols in the GRDC Northern Region chickpea often has a higher CLL than wheat. Whish et al. (2007) noted that this was typically associated with subsoil salinity below 90 cm.
 Figure 6. Crop differences in CLL for APSoil PAWC characterisations relating to crops grown side by side (a) 720 (Jil Jil, Vic), (b) 1306 (Spring Ridge, NSW), (c) 1307 (Spring Ridge, NSW),
(d) 16 (Jimbour, Qld).
In contrast, no consistent, statistically significant (p<0.05) differences were found between harvest soil water contents in a study involving multiple crops grown after canola, oats or wheat on an unconstrained Red Kandosol at Bethungra in southern NSW (Figure 7a-c). The 1994 drought year provided perfect conditions for CLL measurement (wet start, dry finish). The magnitude of the variation between crop species was similar to that seen for CLL estimates for wheat following a range of different crops or a long fallow (Figure 7d). Profile PAWCs are shown in Table 1. These also provide an indication of the measurement error involved. Field pea was consistently at the lower end of the scale and oats and canola tended to have the highest PAWCs.
 Figure 7. Mean end-of-season soil water contents (estimates of field CLL) for six different crops in 1994 following either canola (a), oats (b), or wheat (c) in 1993. Graph (d) shows the mean end-of-season soil water contents for wheat in 1994 following a range of crops grown in 1993 or a
15-month fallow (data from Kirkegaard et al. 2001).
Table 1. PAWC (mm) to 1.4 m depth for different CLL estimates (compared with DUL used in Kirkegaard et al. 2007); standard deviation of CLL measurement only (4 replicates).
| Crop 1994 | Preceding crop 1993 | Preceding crop 1993 | Crop 1994 | ||
|---|---|---|---|---|---|
Canola | Wheat | Oats | Wheat | ||
Field pea | 104 ± 22 | 114 ± 20 | 118 ± 20 | Fallow | 116 ± 21 |
Barley | 125 ± 21 | 127 ± 19 | 137 ± 19 | Pasture | 117 ± 21 |
Wheat | 125 ± 20 | 120 ± 19 | 129 ± 20 | Wheat | 120 ± 20 |
Triticale | 130 ± 19 | 130 ± 19 | 136 ± 19 | Canola | 125 ± 20 |
Oats | 141 ± 20 | 146 ± 18 | 152 ± 20 | Grain oats | 129 ± 19 |
Canola | 144 ± 18 | 142 ± 19 | Oats | 129 ± 19 | |
Lupin | 130 ± 20 | ||||
Similarly, more recent trials in southern NSW using rainout shelters did not show any crop differences to 1.8 m (Figure 8). However, this could have been related to insufficient wetting of the soil below 1.1 to 1.3 m before the cropping season (i.e., there was no plant available water that the crops could extract). However, there was a difference below 1.8 m between the early wheat and early canola (Figure 8b), where canola was able to grow its roots through the dry soil layer and access the deeper soil water. It is not clear whether the dry soil constrained wheat roots or if this related to a difference in root penetration rates between the crops (Kirkegaard et al. 2020).
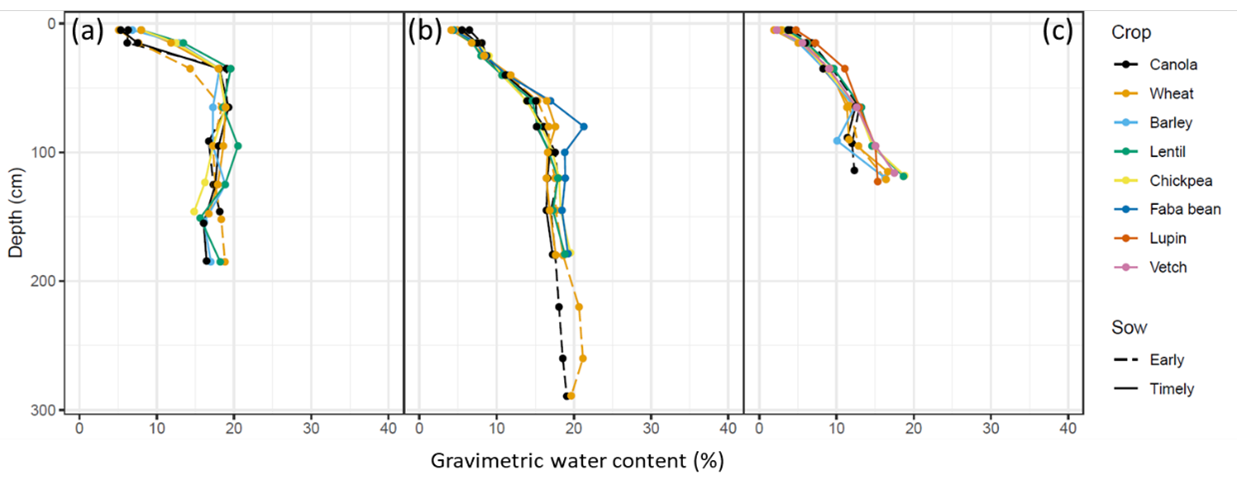 Figure 8. Mean end-of-season soil water contents measured under rainout shelters for different crops in 2018; (a) Condobolin NSW, (b) Greenethorpe NSW, and (c) Wagga Wagga NSW.
Hochman et al. (2001) analysed 83 soil-crop combinations from the APSoil database relating to Black or Grey Vertosols in southern Queensland and northern NSW. They derived a model to predict the CLL from the measured DUL with crop-specific parameters that explained 85% of the observed variation. When we applied these predictive equations to the mean DULs for Black and Grey Vertosols derived in the same study, some crop differences became apparent (Figure 9). For both Black and Grey Vertosols the PAWC to 180 cm declined in the order: cotton > wheat > sorghum > fababean > chickpea > barley > mungbean.
However, only some of the differences were statistically significant (p<0.05). The mean PAWC of cotton (240 mm) was significantly greater than that of chickpea (197 mm), barley (191 mm) and mungbean (130 mm), and all crops except barley had PAWCs that were significantly higher than that of mungbean. The position of barley appears inconsistent with other findings (e.g., Figure 7) and may have been caused by the nature of the five soils involving the barley measurements – the data came from a variety of soils and only a few experiments involved crops grown side-by-side.
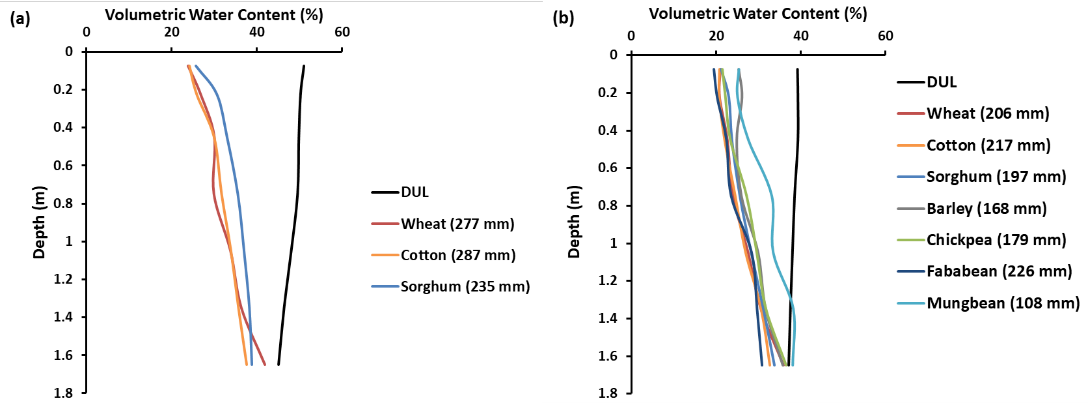 Figure 9. Predicted CLL for different crops using equations from Hochman et al. (2001; Table 3) given the mean DUL for (a) Black Vertosols and (b) Grey Vertosols (Hochman et al. 2001, Table 1) as input.
The international literature has presented similar mixed results. Attempts to summarise crop differences include that by Nielsen et al. (2011) who, drawing on data from two earlier studies and their own, distinguished four groups of crops (Figure 10a). A later analysis by Nielsen and Vigil (2018) of harvest soil water contents across 21 seasons of a long-term experiment involving winter wheat, maize, millet and pea, showed little difference between the driest observed profiles under these crops. Significant differences were, however, obtained in the average end-of-season profiles below 0.3 m with wheat < maize = pea < millet. The active rootzone varied across seasons and in one season with a dry finish, millet extracted soil water to 1.8 m.
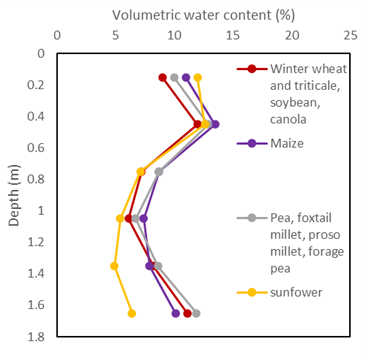
Figure 10. CLL groupings used in Nielsen et al. (2011) for a silt loam soil at Akron, Colorado, USA based on data collated by Ritchie (1981) and Ratliff et al. (1983) (data from Nielsen et al. 2011).
Crop varietal effects on field CLL
In a study undertaken as part of the GRDC SIP08 ‘Combating subsoil constraints’ initiative, Schwenke and co-workers (in Dang et al. 2007) studied differences in yield and harvest soil water of varieties of bread wheat, durum wheat, barley, triticale, chickpea, fababean, fieldpea, lentil, canola, mustard and safflower across sites with different levels of subsoil salinity in northern NSW and Queensland. A follow-up study by Dang et al. (2016) studied varieties of wheat and barley at two sites with differing levels of subsoil constraints. For some of the crop species and sites, varietal differences in yield or yield response to soil chloride levels were noted. Varietal differences in the amount of soil water unused at harvest were not always significantly different. However, Dang et al. (2016) showed that there was a positive correlation between variety wheat and barley yields and soil water extraction. The comparison of early and ‘timely’ sown canola in Figure 8, highlights how variety in combination with sowing time differences that result in crop duration differences can have a large effect on rooting depth and hence PAWC.
The variable and sometimes contradictory results obtained in field CLL characterisations make it difficult to characterise and predict crop species and varietal differences in CLL. The effect of soil texture complicates comparisons across soils and seasonal conditions also affect the results. However, despite the uncertainties and inconsistencies, the various results do provide some lessons and ‘rules of thumb’ on relative effects, which are discussed below.
Crop rooting depth and crop duration are the main drivers for crop differences in CLL
In many field CLL characterisations, the differences between crop species or varieties are small and within measurement error within the upper rootzone. Any differences found tend to be largest in the lower rootzone. This relates to the drivers for crop differences in CLL.
The maximum rooting depth, which is affected by the rate of root extension, duration of the crop and the crop’s sensitivity to subsoil constraints (e.g., salinity, acidity, sodicity, high soil strength, soil depth) determines the depth of soil from which the plant can extract water. Hence, rooting depth has a large control over the potential PAWC. This is illustrated in Figure 6 where high levels of subsoil salinity in APSoil 1307 (Figure 6c) reduced the rooting depth and halved the PAWC compared to the nearby APSoil 1306 (Figure 6b) which had lower levels of salinity.
Crop duration and a crop’s sensitivity to subsoil constraints determine to what extent the crop will be able to extract the available soil water through their effect on root density. Crop duration also affects extraction through its effect on crop water demand. Shorter duration crops (e.g., mungbean, fababean) often have shallower root systems and can leave water behind when soil water supply exceeds crop water demand. This can happen on soils with a large PAWC (e.g., cracking clay soil) in seasons with a full profile at anthesis due to high in-season rainfall. Crop differences in extraction are then in part due to differences in crop water demand.
In the early pot trials (Figure 2) and in dry seasons like that of the 1994 experiment shown in Figure 7, soil water supply would have been smaller than crop water demand, minimising crop differences. The interactions between crop duration and seasonal differences in soil water supply contribute to the variable results in the field CLL measurements.
Crop lower limit versus soil water left behind
Crop duration has an even larger effect on water left behind at harvest in seasons without a dry finish. Crops may have a similar CLL measured under conditions of a dry finish, but in seasons with late rainfall the timing of when a crop species or variety matures and stops extracting soil water causes differences in the amount of soil water left behind for a subsequent crop (Figure 11). For rotation and crop sequencing decisions it is more important to know the amount of soil water left behind or late rainfall not used by a harvested crop (Bell and Kirkegaard 2021) rather than its CLL. The CLL is more relevant for pre-season or in-season decisions, including knowing how much of the soil water left behind will be available to the subsequent crop using its CLL.
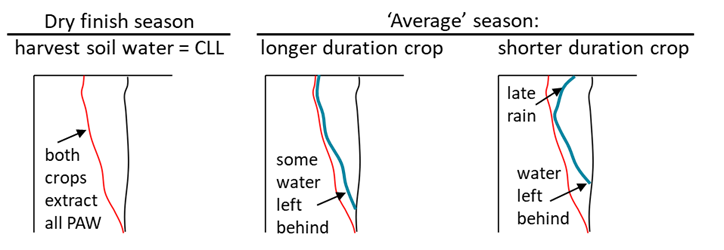
Figure 11. Crops with a similar CLL obtained under conditions of a dry finish may leave different amounts of soil water for the next crop in an ‘average’ season due to differences in water use or not using late rain.
Effective rooting depth and the role of sparser roots in the lower rootzone
The term ‘effective rooting depth’ is sometimes used to indicate the soil depth in which most roots are found. It is usually considerably less than the maximum rooting depth and indeed sometimes defined as half the maximum depth. However, the observed CLL profiles in Figures 6-10 show considerable water extraction in the lower rootzone despite the much lower root densities compared with the upper rootzone, indicating that the sparser roots at depth can still be effective in extracting soil water. Indeed, in a study involving wheat grown under terminal drought, Kirkegaard et al. (2007) found that this deep water accessed by the crop during grain-filling was highly valuable to the crop. Hence, in the context of determining PAWC for dryland cropping, the term ‘effective rooting depth’ can be misleading. In seasons with a dry finish when access to deep water makes a difference, it will underestimate the amount of water available to the crop, and hence its yield potential.
The lower density of roots at the bottom of the rootzone and their concentration in pores and cracks (White and Kirkegaard 2010) do affect the ease with which the crop can access this water supply. The lower root density increases the average distance that water needs to travel from the soil to the root surface. The rate of soil water extraction is therefore reduced at depth. Energy considerations would also suggest that crops would prefer the more easily accessible water in the upper rootzone when it is available. However, given sufficient time, sparser roots at depth can still achieve considerable water extraction. This is why field CLL measurements performed under conditions of a dry finish (no rain or use of a rainout shelter) will show smaller crop differences than in an average season.
Crop differences in response to subsoil constraints
Subsoil constraints can limit rooting depth and root exploration, with some crops more sensitive to the constraints than others. The soil constraints that affect CLL and PAWC most are subsoil salinity, subsoil acidity, subsoil sodicity, soil strength and soil depth.
Subsoil salinity
The negative effect of soil salinity on crops has long been known. In 1954, Richards (1954) identified the sensitivity of crops relative to levels of soil electrical conductivity (EC). However, work in the GRDC funded SIP08 Project ‘Combating Subsoil Constraints Northern Grains Region’ (2002-2007) found that soil chloride (Cl) concentration was a better predictor of soil salinity effects on crops than EC (Dang et al. 2007). Measurements of EC in semi-arid regions are frequently confounded by naturally occurring salts like gypsum, which have low solubility and therefore do not affect crop water extraction or crop growth.
The exact nature of the salinity effect on root water extraction and crop differences therein is complex with impacts on root growth and efficiency of water extraction, on osmotic effects and ion specific effects (e.g., Na, Cl), and on energetic costs to the plant being studied from the different perspectives of soil science, plant science and agronomy. It is also important to recognise that sodicity and salinity are not the same. Sodicity is related to the dispersion of clay and affects soil strength and porosity (see section below) whereas salinity is related to the concentration of the soluble ions which induces osmotic stress and ion toxicity (McDonald et al 2020). However, untangling the effects of sodicity and salinity on crops and crop differences in CLL is challenging, because they can occur in different combinations. Along with soil pH this can create a complex mix of soil chemical and physical effects on root growth and root water extraction (Rengasamy, 2016).
The SIP08 project also determined field CLL under the different crops. Analysis of this data along with simulations (Hochman et al. 2004) indicated that the effect of subsoil salinity on yield could be explained by its effect on PAWC. A higher chloride concentration, used as indicator of salinity, caused the CLL to taper more quickly towards the DUL (Dang et al. 2006, 2008; Hochman et al., 2007).
Building on this earlier work, our project determined the extent of tapering of the CLL towards the DUL (above that naturally occurring with depth) for five crops grown on Vertosols as a function of chloride (Deery et al., 2021). While the experimental data is noisy, it indicated that wheat, canola, durum and barley had similar CLL tapering relative to chloride concentration, with CLL impacted above soil chloride concentrations of ~ 250 mg Cl/kg (measured in the bulk soil), and water no longer available to plants above 1200 to 1500 mg Cl/kg (Figure 12). Chickpea was more sensitive, matching earlier results by Whish et al. (2007). There was insufficient data to confirm relative sensitivities of other crops, but yield responses in the Project Results book of SIP08 (Dang et al., 2007) provide some guidance.

Figure 12. Increased tapering of CLL towards DUL with increasing soil Cl concentration in Vertosols (source: Deery et al., 2021; data from Dang et al. 2006). A tapering value of 0 indicates CLL matches the CLL predicted as a function of depth for unconstrained soils, a value of 1 indicates CLL is
equal to DUL.
Subsoil acidity
Both acidity (low soil pH) and alkalinity (high soil pH) mediate the availability of exchangeable cations and micronutrients, which can lead to deficiencies or toxicities. In strongly acid soils, concentrations of aluminium and manganese in the soil solution may increase to levels that are toxic to plants. This will affect root exploration and access to water, particularly for acid sensitive species. Dolling et al. (1991) noted barley as being very sensitive to aluminium toxicity relative to triticale, to most genotypes of wheat and to other cereals. This would be reflected in a higher CLL and hence lower PAWC on soils with high levels of soluble aluminium.
Soil acidity can be found in the (deep) subsoil or subsurface around 10-20 cm depth. While subsoil acidity is an acknowledged problem for crop water uptake and access, its effect on the CLL has not been studied to the same extent as subsoil salinity. The problem of subsurface acidity seen in some soils (e.g., in southern NSW) may have less of an impact on PAWC if the acidity is confined to a layer, not too severe and crop roots are able to grow through it and access the water below
Layers with high soil strength and subsoil sodicity
Compacted soil layers affect crop root exploration via a high physical resistance. In addition, there are indirect effects of a low PAWC, increased waterlogging above the compacted layer and poor soil aeration. While compaction can be management induced, some soils may have naturally dense subsoils that act as physical barriers. This has been observed at a few APSoil characterisation sites in southern NSW and the effects may be dependent on soil moisture levels – constraints on rooting mainly occur if these layers are dry (Kirkegaard and Lilley 2007). Subsoil sodicity (high exchangeable sodium) can also lead to compact subsoils if it is not accompanied by higher salinity due to dispersion of clays. Surface sodicity causes crusting and sealing, which can impact on crop establishment and hence affect crop water extraction. However, this is not an effect on CLL.
Does root architecture matter?
Crops differ in root architecture (Figure 13). With rooting depth and root exploration determining the ease of supply of soil water to the crop, it is reasonable to expect root architecture to play a role in crop differences in field CLL. However, it has proven difficult to identify conclusive evidence on this topic.
Some of the groupings in Figure 13 match the groupings of crops that have similar CLL and PAWC (e.g., wheat, triticale, oats, barley) seen in some of the field CLL data. However, the reasons for similarity may not relate to root architecture and could be caused by other similarities such as the rate of root penetration, crop duration or leaf area index and crop water demand.
As discussed above, higher root density does not necessarily relate to a lower CLL, as sparse roots can still be effective if there is sufficient time to extract the soil water. Deeper root extension may be more effective. Hamblin and Tennant (1987) also found that the higher root length density of wheat and barley compared with lupin and field pea was offset by a higher specific root water uptake (volume of water extracted per unit root length per day) for the latter. This was assumed to be related to their large and abundant metaxylem vessels, which give much lower axial resistance than in cereals. Differences in resistance to axial flow in the roots playing a role was also flagged in some earlier studies (see Passioura, 1983) in relation to cotton being more effective in soil water extraction than spring cereals and sorghum.
The above indicates that there is still more to learn about the effect of root architectures, but it will require controlled studies, rather than field CLL data to identify causes and effects. It should also be noted that even if the effect on CLL is small, the effects on the soil water dynamics during the season and amount of water left behind at harvest can still be relevant.

Figure 13. Root architectures for annual crops in the APSIM model and included in the APSoil database.
Current rules of thumb
The above lessons suggest the following broad rules of thumb:
- In the absence of subsoil constraints that limit root exploration (salinity, acidity, soil strength or soil depth), crops with similar crop duration and rooting depth will have a similar field CLL.
- Wheat, barley, triticale, oats, canola, and sorghum often have a similar field CLL. However, season-length remains a consideration among these crops, with early sown, longer duration varieties having greater opportunity to access deeper water
- Maize may fit into this list too, although the shorter season length of some varieties increased its CLL relative to wheat and sorghum in some overseas studies
- Millet, field pea, lentil and chickpea are capable of achieving the same field CLL as the above crops when sown at a similar time in drier seasons (when water supply is much less than crop water demand). However, in an average season millet, field pea, lentil and possibly chickpea may leave water behind
- A longer season crop like cotton can achieve a slightly lower CLL in the lower rootzone. However, short season crops with relatively low water demand like mungbean have a relatively high CLL, mainly due to crop duration limiting the rooting depth and causing a lower demand to supply ratio
- Lucerne and other perennial species have more time to extract soil water and typically achieve the deepest water extraction and lowest CLL.
- In soils with mild to moderate subsoil constraints, crop differences in field CLL will reflect sensitivity to these constraints provided the measurements were undertaken in a situation where crop water demand exceeded soil water supply.
- Chickpea is more salt-sensitive than wheat, durum, barley or canola and has stronger tapering of the CLL
- Soil chloride is a useful indicator of salinity constraints on soil water extraction and PAWC. When accompanied by other constraints like subsoil acidity and sodicity these can further modify the PAWC
- Metrics for the effects of subsoil acidity and sodicity on CLL are not as well defined, but more sensitive crop species or varieties will have stronger tapering of CLL
- In soils with strong subsoil constraints (e.g., > 1500 mg Cl/kg chloride at 60 cm depth), the differences between crops can become less marked as all would be severely affected
- The effect of subsoil constraints on shallow-rooted, shorter duration crops is more difficult to establish, as soil water supply is often more than crop demand, especially on Vertosols, which means the field measured CLL reflects differences in crop demand
- Canola is often assumed to have a CLL similar to wheat. However, it may handle subsoil constraints differently. In the example of Figure 8 from southern NSW, early sown canola was found to be able to grow its roots through a layer of drier and possibly harder soil, whereas the early sown wheat did not. In the SIP8 experiments the relative positions of wheat and canola CLL varied. Differences in response of canola and wheat to subsoil constraints (and hence their CLL) hence warrants further investigation.
How to use this information
Most PAWC characterisations in the APSoil database are for a single crop, most commonly wheat. The above rules of thumb can be used to estimate the CLL for other crops through adaptation of the measured CLL. For example, by adjusting the rooting depth or the tapering towards the DUL.
Where the PAWC information (CLL and DUL) is used in conjunction with crop models like APSIM to predict yield, an alternative to specifying a crop specific CLL is to use the lowest observed CLL and to achieve a seasonally responsive CLL through adjustment of the crop water extraction rate (kl) (Hochman et al. 2007; Verburg et al. 2007) or dynamic simulation of root length density.
Acknowledgements
The research undertaken as part of this project was made possible by the significant contributions of growers through cooperation with our PAWC and soil characterisations, their generous time discussing their soils and their support of the GRDC; the authors would like to thank them for their continued support. We also gratefully acknowledge the contributions of CSIRO colleagues and other collaborators involved with the field PAWC characterisations captured in the APSoil database, and additional datasets included in this update paper collected as part of projects CSP130, 9175150/CFF00011 and SIP08. Information from soil constraints projects and discussion with Ehsan Tavakkoli are acknowledged too.
Resources
APSoil database (includes link to Google Earth file as well as to various papers and reports)
SoilMapp (soil maps, soil characterisation, archive and APSoil sites): Apple iPad and Android app; documentation: (Note: iPad version working again!)
References
Bell L and Kirkegaard J (2021) Managing crop differences in soil water extraction and legacy impacts within a farming system. GRDC Grains Research Update, online paper, May 2021
Briggs LJ and Shantz HL (1912) ‘The wilting coefficient for different plants and its indirect determination.’ USDA Bureau of Plant Industry Bulletin No. 230. Government Printing Office, Washington, DC.
Burk L and Dalgliesh N (2013) Estimating plant available water capacity. GRDC Kingston ACT.
Cresswell HP (2002) The soil water characteristic. pp. 59–84. In: NJ McKenzie, KJ Coughlan and HP Cresswell (Eds.), Soil physical measurement and interpretation for land evaluation. Vol. 5. Australian soil and land survey handbook series. CSIRO Publishing, Collingwood, Vic, Australia.
Dang YP, Routley R, McDonald M, Dalal RC, Singh DK, Orange D and Mann M (2006) Subsoil constraints in Vertosols: crop water use, nutrient concentration and grain yields of bread wheat, durum wheat, barley, chickpea and canola. Australian Journal Agricultural Research 57, 983–998.
Dang Y, Buck S, Dalal R, Price P, Schwenke G, Hochman Z, Daniells I, Biggs A, Freebairn D, Watling K and Cupples N (2007) Combating subsoil constraints (SIP08: Northern Grains Region) Project Results Book.
Dang YP, Dalal RC, Mayer DG, McDonald M, Routley R, Schwenke GD, Buck SR, Daniells IG, Singh DK, Manning W and Ferguson N (2008) High subsoil chloride concentrations reduce soil water extraction and crop yield on Vertosols in north-eastern Australia. Australian Journal of Agricultural Research 59, 321–330.
Dang YP, Christopher JT and Dalal RC (2016) Genetic Diversity in Barley and Wheat for Tolerance to Soil Constraints, Agronomy 6, 55, 1-19.
Deery D, Verburg K, Schwenke G and Dang Y (2021) Estimating crop lower limit on Vertosol soils in the presence of variable levels of subsoil salinity. Australian Agronomy Conference, 17-21 October 2021, Toowoomba, Qld. (in review)
Dolling PJ, Porter WM and Robson AD (1991) Effect of soil acidity on barley production in the south-west of Western Australia 1. The interaction between lime and nutrient application. Australian Journal of Experimental Agriculture 31, 803-810.
Hamblin A and Tennant D (1987) Root length density and water uptake in cereals and grain legumes: How well are they correlated? Australian Journal Agricultural Research 38, 513–527.
Hochman Z, Dalgliesh NP and Bell KL (2001) Contributions of soil and crop factors to plant available soil water capacity of annual crops on Black and Grey Vertosols. Australian Journal Agricultural Research 52, 955-961.
Hochman Z, Dang YP, Schwenke GD, Dalgliesh NP, Routley R, McDonald M, Daniells IG, Manning W and Poulton PL (2007) Simulating the effects of saline and sodic subsoils on wheat crops growing on Vertosols. Australian Journal Agricultural Research 58, 802–810.
Hochman Z, Probert ME and Dalgliesh NP (2004) Developing testable hypotheses on the impacts of sub-soil constraints on crops and croplands using the cropping systems simulator APSIM. In: New directions for a diverse planet. 4th International Crop Science Congress. Brisbane, Australia, 26 September – 1 October 2004.
Jordan WR and Miller FR (1980) Genetic variability in sorghum root systems: implications for drought tolerance. pp. 383—399. In: N.C. Turner and P.J. Kramer (Editors), Adaptation of Plants to Water and High Temperature Stresses. Wiley Interscience, New York, NY.
Kirkegaard JA, Howe GN and Pitson G (2001) Agronomic interactions between drought and crop sequence. 10th Australian Agronomy Conference. http://www.regional.org.au/au/asa/2001/4/c/kirkegaard1.htm
Kirkegaard JA, Lilley JM, Howe GN and Graham JM (2007) Impact of subsoil water use on wheat yield. Australian Journal Agricultural Research 58, 303–315.
Kirkegaard J, Bullock M, Swan T, Lilley J and Brill R (2020) Canola’s deep roots – agronomy to capture benefits and manage legacies. GRDC Update February 2020.
Kirkegaard JA and Lilley JM (2007) Root penetration rate – a benchmark to identify soil and plant limitations to rooting depth in wheat. Australian Journal of Experimental Agriculture 47, 590-602.
McDonald GK, Tavakkoli E and Rengasamy P (2020) Commentary: Bread wheat with high salinity and sodicity tolerance. Frontiers in Plant Science 11, 1194. https://doi.org/10.3389/fpls.2020.01194
Nielsen DC, Vigil MF and Benjamin JG (2011). Evaluating decision rules for dryland rotation crop selection. Field Crops Res. 120:254–261.
Nielsen DC and Vigil MF (2018) Soil water extraction for several dryland crops. Agronomy Journal 110, 1–9.
Passioura JB (1983) Roots and drought resistance. Agricultural Water Management 7, 265–280.
Ratliff LF, Ritchie JT, Cassel DK (1983) Field-measured limits of soil water availability as related to laboratory-measured properties. Science Society America Journal 47, 770–775.
Rengasamy P (2016) Soil chemistry factors confounding crop salinity tolerance – A review. Agronomy 6, 53. https://doi.org/10.3390/agronomy6040053
Richards LA (Ed.) (1954) Diagnosis and improvement of saline and alkali Soils. USDA Agriculture Handbook 60, Washington DC.
Richards LA and Weaver LR (1943) Fifteen-atmosphere percentage as related to the permanent wilting percentage. Soil Science 56 331–340.
Ritchie JT (1981) Soil water availability. Plant Soil 58, 327–338.
Verburg K, Thomas M, Cocks B, Austin J, Glover M, Stockmann U, Deery D, Gallant J, Whish J, Lynch B and Dougall C (2020) Using existing soil and landscape data sources to estimate plant available water capacity (PAWC) for decision-making and crop resourcing (with Central Queensland examples). GRDC Update November 2020.
Verburg K, Bond WJ, Hirth JR and Ridley AM (2007) Lucerne in crop rotations on the Riverine Plains. 3. Model evaluation and simulation analyses. Australian Journal of Agricultural Research 58, 1129-1141.
Whish JPM, Castor P, Carberry PS and Peake AS (2007) On-farm assessment of constraints to chickpea (Cicer Arietinum) production in marginal areas of northern Australia. Expl. Agriculture 43, 505-520.
White RG and Kirkegaard JA (2010) The distribution and abundance of wheat roots in a dense, structured subsoil – implications for water uptake. Plant, Cell and Environment, 33, 133-148.
Contact details
Dr Kirsten Verburg
CSIRO Agriculture and Food
GPO Box 1700, Canberra ACT 2601
Ph: 02 6246 5954
Email: kirsten.verburg@csiro.au
GRDC Project Code: CSP1706-013RTX, CSP1806-018RTX,
