Legacy impacts of various farming systems at Spring Ridge
Legacy impacts of various farming systems at Spring Ridge
Author: Jon Baird (NSW DPI) | Date: 20 Jul 2022
Take home message
- A system based on winter crops resulted on the highest accumulated grain yield. The Higher diversity system (wheat, fieldpea, canola and barley) produced a total of 26.7 t/ha of grain yield since 2015
- The system based on wheat and cotton had the greatest income ($7,001/ha) and gross margin ($6,318/ha). This was a gross margin improvement of over $1,000/ha compared with the traditional grower’s practice (Baseline)
- Since 2017, the higher nutrient system (which had an additional 69 kg N/ha of fertiliser N applied) has maintained higher mineral N levels (101 kg N/ha) than the baseline system (60 kg N/ha) up to harvest in 2020
- Growing a higher proportion of legume crops increased the N balance. The higher legume system required less N fertiliser (146 kg N/ha versus 307 kg N/ha) and exported more N from the system as grain (638 kg N/ha versus 487 kg N/ha).
- All systems removed high levels of potassium (K) from the soil of between 34 kg K/ha to 127kgK/ha, with the highest removal rate in the higher legume system.
Introduction
While advances in agronomy and the performance of individual crops have helped grain growers to maintain their profitability, current farming systems are underperforming; with only 30% of crop sequences in the northern grains region achieving 75% of their water limited yield potential.
Growers face challenges from declining soil fertility, increasing herbicide resistance, and increasing soil-borne pathogens in their farming systems. Change is needed to meet these challenges and to maintain farming system productivity and profitability. Consequently, Queensland Department of Agriculture and Fisheries (DAF), New South Wales Department of Primary Industries (NSW DPI) and Commonwealth Scientific and Industrial Research Organisation (CSIRO) are collaborating to conduct an extensive field-based research program, focused on developing farming systems to better use the available rainfall to increase productivity and profitability, with the question;
“Can systems performance be improved by modifying farming systems in the northern region?”
In 2014 research began in consultation with local growers and agronomists to identify the key limitations, consequences and economic drivers of farming systems in the northern region; to assess farming systems and crop sequences that can meet the emerging challenges; and to develop the systems with the most potential for use across the northern region.
Experiments were established at seven locations; with a large factorial experiment managed by CSIRO at Pampas near Toowoomba, and locally relevant systems being studied at six regional centres by DAF and the DPI NSW (Emerald, Billa Billa, Mungindi, Spring Ridge, Narrabri and Trangie (red & grey soils)).
Table 1. Systems implemented at each of the locations. Trangie has systems applied on both red and grey soils. Pampas includes summer dominant, winter only and mixed opportunity cropping systems. Pampas also includes combinations (i.e., higher legume + diversity) not listed here.
Pampas (Core site) | Regional sites | ||||||||
|---|---|---|---|---|---|---|---|---|---|
System/ modification | Summer | Winter | Mixed | Emerald | Billa Billa | Mungindi | Spring Ridge | Narrabri | Trangie |
Baseline | * | * | * | * | * | * | * | * | * |
Higher crop intensity | * | * | * | * | * | * | |||
Lower crop intensity | * | * | * | * | ** | * | * | * | |
Higher legume frequency | * | * | * | * | * | * | * | * | * |
Diverse crop options | * | * | * | * | * | * | * | * | |
Higher nutrient supply | * | * | * | ** | ** | * | * | * | * |
No. of systems | 38 | 6 | 9 | 6 | 6 | 6 | 6 | ||
Farming system descriptions
- Baseline is typical of local zero tillage farming systems with approximately 1 crop per year grown using moderate planting moisture triggers of 50% plant available water capacity (PAWC). Crops grown in this system are limited to wheat/barley, chickpea and sorghum. These crops have nitrogen fertiliser applied to achieve 50th yield percentile as determined by the PAW prior to planting and based on APSIM yield simulations for each site.
- Lower crop intensity reflects a conservative rotation to accumulate greater PAW for the next crop (80% PAWC). The same nutrient management as the baseline system is applied. Crops grown are also similar to the baseline but may also include cotton as a high value crop at some sites.
- Higher crop diversity allows a greater suite of crops to be grown to better manage disease, root lesion nematodes and herbicide resistance. Planting triggers and nutrition are the same as the baseline system. The unique rules for this system focus on managing root lesion nematodes, with 50% of the selected crops to be resistant to Pratylenchus thornei, and 1 in 4 crops resistant to Pratylenchus neglectus. To manageherbicide resistance, two crops utilising the same herbicide mode-of-action cannot follow each other. Crops grown in this system include wheat/barley, chickpea, faba bean, field pea, canola/mustard, sorghum, mungbean, maize, millet and sunflower.
- Higher legume aims to minimise the use of nitrogen fertiliser by growing every second crop as a pulse (legume), with a preference for those that produce greater biomass and greater carry-over nitrogen benefits. Crops grown in this system are similar to the baseline (wheat/barley, chickpea, sorghum) with additional pulse options (faba bean, field pea, & mungbean). Crops will be fertilised (N) to achieve average yield potential for the PAW, with nitrogen only applied to the cereal crops.
- Higher crop intensity aims to minimise the fallow periods within the system and potentially grow 3 crops every 2 years. Crops will be planted on lower PAW (30%) and have a greater reliance on in-crop rainfall. Crop choice is the same as the baseline system, but with mungbean added as a short double-crop option. These crops are fertilised (N) to achieve average seasonal yield potential for the PAW prior to planting.
- Higher nutrient supply will have N and P fertiliser applied to match the fertiliser requirements of a 90th yield percentile crop; with the risk that crops will be over fertilised in some drier years. This system will be planted to the same crop as the baseline each year, so that the only difference is the amount of nutrients applied.
Method
Site description
The Spring Ridge farming systems experiment is located on the University of Sydney farm “Nowley”. The soil at Nowley is typical of the Liverpool Plains with a dark chocolate vertosol and a plant available water capacity (PAWC) of 240 mm to a depth of 120 cm.
Table 2. Spring Ridge farming system site “Nowley” soil characteristics for 0-120 cm depth
Soil depth (cm) | |||||
|---|---|---|---|---|---|
0–10 | 10–30 | 30–60 | 60–90 | 90–120 | |
pHCa | 6.18 | 7.35 | 7.96 | 8.26 | 8.37 |
Organic carbon (%) | 1.09 | 0.66 | 0.67 | 0.52 | 0.31 |
Colwell-P (mg/kg) | 66.4 | 18.7 | 5.22 | 6.07 | 11.3 |
Conductivity (dS/m) | 0.10 | 0.16 | 0.18 | 0.25 | 0.33 |
System evaluation
Over the course of the project life for each system at each experimental site, data has been collected on the crop yields, inputs costs including fertilisers, seed, herbicides, pesticides and machinery operations. This allows calculation of the accumulated income and gross margins for each of the cropping systems deployed at every location. Consistent prices for each commodity (10-year average adjusted for inflation) were used to avoid introducing discrepancies in the data (Table 3). All grain yields were corrected to 12% moisture to account for variable harvest moistures.
Table 3. Grain pricing used in calculations based on median prices over the past ten years, less $40/t cartage costs, for selected crops
Crop | $/t | Crop | $/t |
|---|---|---|---|
Barley | 218 | Sorghum | 221 |
Wheat (durum and APH) | 269 | Maize | 281 |
Canola | 503 | Mungbean | 667 |
Chickpea | 504 | Sunflower | 700 |
Faba bean | 382 | Cotton | 1090 |
Field pea | 335 |
Experimental conditions
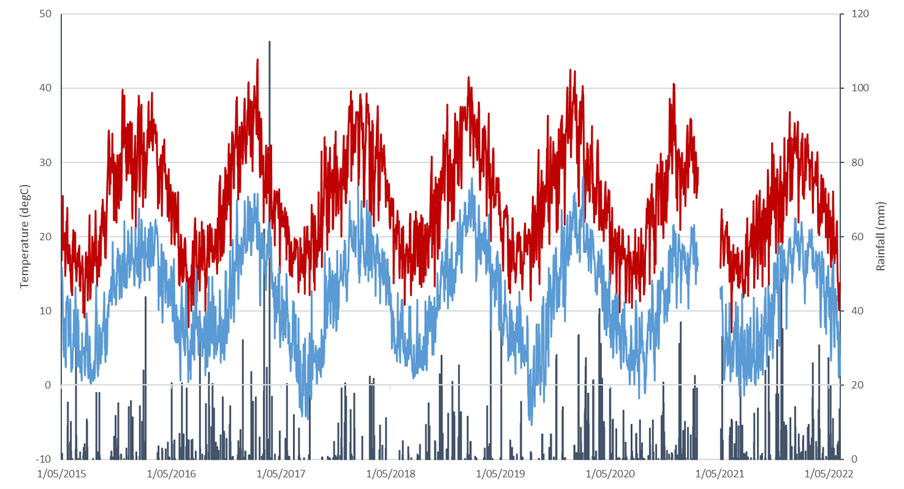
The site at Spring Ridge has experienced variable weather conditions (Figure 1). These conditions initiated variable cropping sequences for the six systems and generated data applicable to local producers who experienced the same conditions under their commercial operations over this period.
Figure 1. Climatic conditions at Spring Ridge, NSW (2015-2022). The red line denotes daily maximum temperature, blue line is the daily minimum temperature and black columns show daily rainfall.
System rotation
The Liverpool Plains with its typical mild summer temperatures and reliable rainfall is renowned for production of high yielding grain crops, particularly summer grain. As such, grower practice (Baseline system) is dominated with wheat, sorghum and chickpea (Table 4). This is similar to the Higher intensity system but with its lower planting trigger the Higher intensity system’s goal was to increase cropping frequency and activate a double crop chickpea after sorghum where possible. While planting moisture was limited during the drought seasons (2017-19) the Higher intensity system did plant more crops than the Baseline system and there were two double cropping opportunities (2016/17 and 2021).
The Higher legume system included fababean as the core legume choice, with the addition of chickpea to increase the legume frequency within the farming system. 50% of crops planted in this system were legumes (three of six) between 2015 and 2021/22).
Evaluating longer fallow periods to support high yield potential is investigated in the Lower intensity system. At Spring Ridge, a cereal crop has been used for greater stubble cover to aid soil moisture retention and then planting a higher value crop for economic gain (in this case cotton). This system had the lowest number of crops produced with four planted thus far (2 x wheat and 2 x cotton) over the life of the project (Table 4).
Table 4. System cropping sequence at Spring Ridge, NSW (2015-2022)
Baseline | Higher nutrient | Higher legume | Higher diversity | Higher intensity | Lower intensity | |
|---|---|---|---|---|---|---|
Winter 15 | Wheat | Wheat | Wheat | Wheat | Wheat | Wheat |
Summer 15 | ||||||
Winter 16 | Chickpea | Chickpea | Faba bean | Field Pea | ||
Summer 16 | Sorghum | |||||
Winter 17 | Wheat | Wheat | Wheat | Wheat | Chickpea | |
Summer 17 | Cotton | |||||
Winter 18 | ||||||
Summer 18 | Sorghum | Sorghum | Sorghum | |||
Winter 19 | Chickpea | Canola | ||||
Summer 19 | ||||||
Winter 20 | Wheat | Wheat | Wheat | Wheat | Wheat | Wheat |
Summer 20 | ||||||
Winter 21 | Fababean | Barley | Chickpea | |||
Summer 21 | Sorghum | Sorghum | Sorghum | Cotton |
Project results
System yield
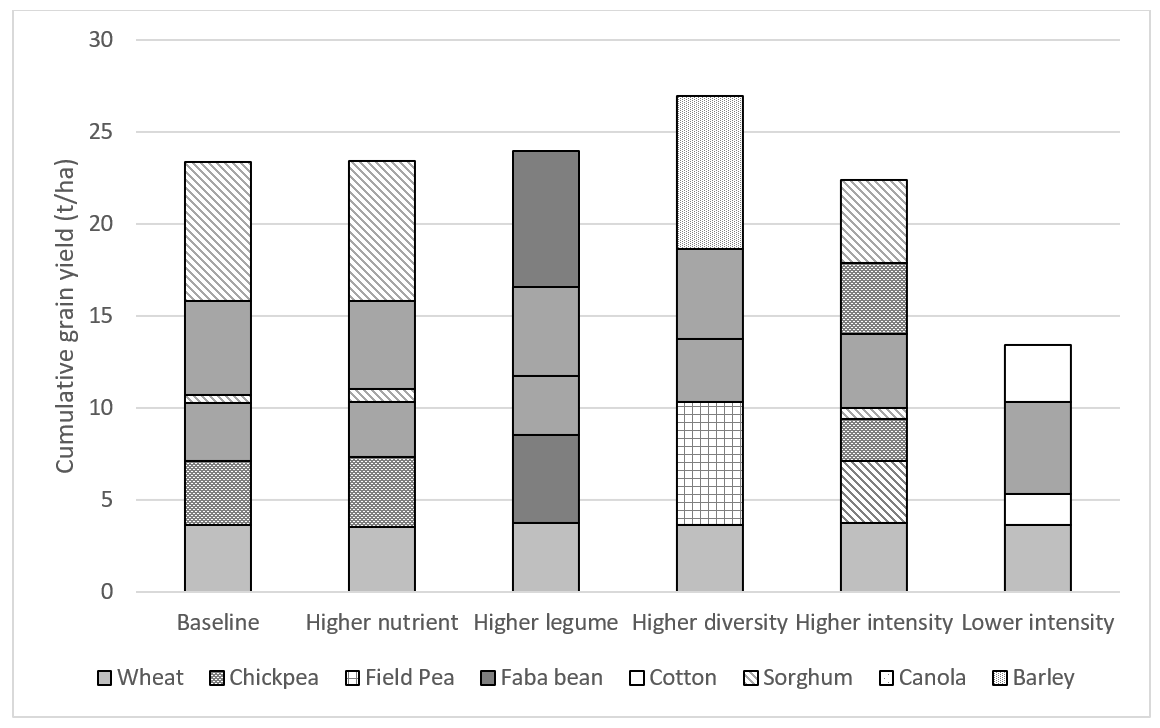
After seven years, the Higher diversity system achieved the greatest accumulated grain yield at 26.7 t/ha (Figure 2). The next four farming systems resulted in similar productivity, with the Higher legume, Baseline, Higher nutrient and Higher intensity achieving accumulated grain yields between 24.0 t/ha and 22.4 t/ha. Although increasing the fertiliser rates did not improve grain yields, there was an improvement in dry matter production for the Higher nutrient system (67.2 t dm/ha) over the Baseline system (66.0 t dm/ha).
The lower intensity system with its high PAW planting trigger had the least number of crops produced and resulted in the lowest accumulated grain yield (13.8 t/ha) (Figure 2). The lower intensity system also had the lowest dry matter production at 35 t dm/ha, which was 31 t dm/ha less than Baseline system.
Figure 2. Cumulative grain yield for the six farming systems at Spring Ridge, NSW (2015-2022). Note Canola was planted in the Higher diversity system in 2019 but no yield was recorded due to crop failure.
System economics
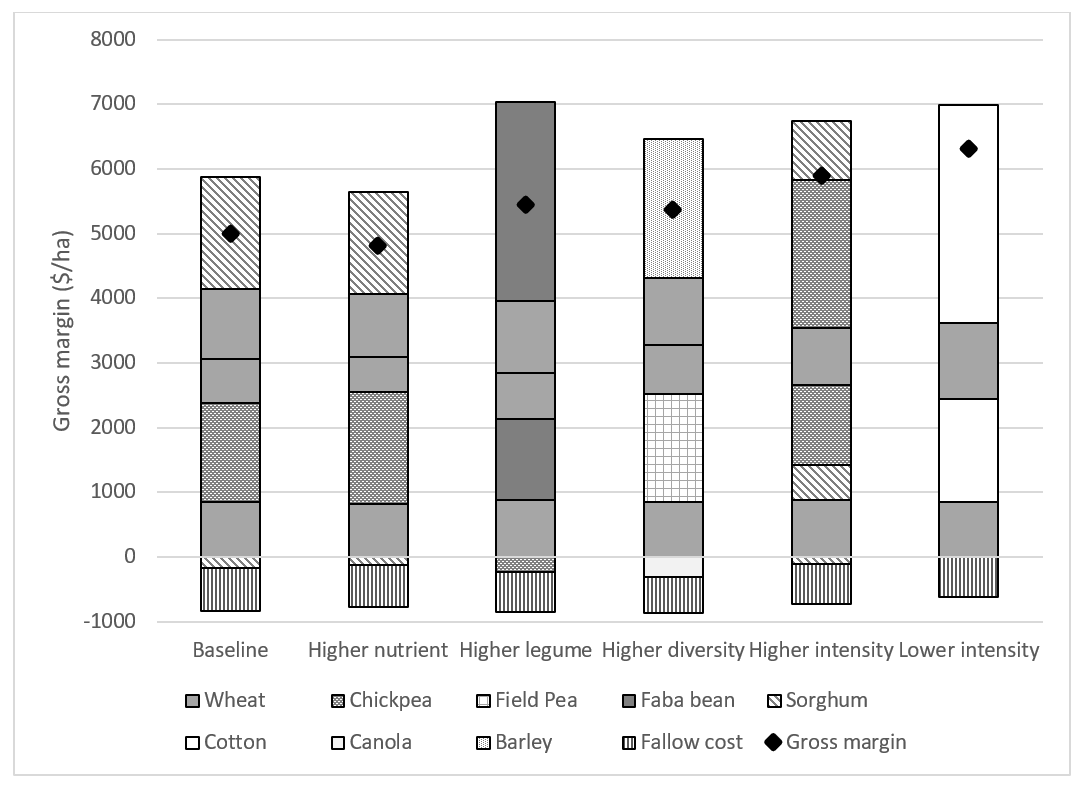
The wheat – cotton sequencing in the Lower intensity system resulted in the highest gross margin at Spring Ridge at $6,318/ha (Figure 3). This system had high cropping returns per planted crop and low input costs compared to the other systems (data not shown). This resulted in a system with high return on investment through a relatively safe system for the local area. In comparison the Higher legume system had increased crop returns (+$55) but the higher input costs reduced the system gross margin to $5,454/ha. Both systems had greater gross margins than the Baseline system ($4,994/ha) as did the Higher intensity system, which like the Higher legume system had high input costs, but the additional crops produced did improve system income (Figure 3).
These results highlight that modifying farming systems at Spring Ridge can provide economic benefits either in the short term (high cropping frequency) or the longer term (lower cropping frequency).
Figure 3. System and crop gross margin of the six farming systems at Spring Ridge.
System water use
Soil water measurements collected both prior and post every crop planted allowed calculation of crop water use (change in soil water during crop growth), water use efficiency (WUE – grain yield/ mm PAW) and fallow efficiency (FE – change in soil water between crops).
The higher yield potential of the Lower intensity system allowed for greater use of stored water to generate better WUE – 3.6 kg/mm more than the Baseline system (Table 5). This showed that growers in the local region can extend fallow periods with the aim to increase yield potential and economic gain without losing substantial soil water. Although when evaluating FE across the seven seasons, the Lower intensity system did have one of the poorest results at Spring Ridge (17%) due to extended fallow lengths. The Baseline, Higher nutrient and the Higher intensity systems had shorter and similar fallow periods with the highest FE (ranging between 26 and 23%).
Table 5. Water use efficiency (WUE as kg grain/mm PAW), fallow efficiency (FE= % of fallow rainfall captured and stored) and the change in stored water (Δ SW = change in soil water (mm PAW) at the end of the crop or fallow period at Spring Ridge for the six farming systems (2015-2022).
FE | WUE | $/mm | |
|---|---|---|---|
Baseline | 26 | 9.5 | 1.29 |
Higher nutrient | 26 | 9.4 | 1.24 |
Higher legume | 15 | 11.5 | 1.43 |
Higher diversity | 19 | 12.2 | 1.41 |
Higher intensity | 23 | 11 | 1.68 |
Lower intensity | 17 | 13.1 | 2.06 |
Nutritional legacy
The legacy impact of the cropping systems was measured by conducting nutrient analysis tests pre- and post-crop and calculating crop nutrient export (grain yield dry weight by grain concentration (%)).
A key question was if legumes can reduce reliance on synthetic fertiliser within a farming system? At Spring Ridge, we found this was the case, as the Higher legume system reduced the need for fertiliser N application by 161 kg N/ha compared to the Baseline system (Table 6). The reduction in fertiliser N required did not reduce the export rates as the Higher legumes also had higher amounts of N exported from the cropping system, with 638 kg N/ha exported. In contrast, by applying more fertiliser N (to match the demands of a 90-percentile year yield potential) did not influence crop exports, as both the Higher nutrient and Baseline system had similar accumulated N export values.
Table 6. System application and export of macro nutrients at Spring Ridge.
System | Applied nitrogen fertiliser | Exported nitrogen | Mineral nitrogen change | Exported phosphorus | Exported potassium |
|---|---|---|---|---|---|
Baseline | 307 | 487 | -104 | 61 | 89 |
Higher nutrient | 446 | 498 | -102 | 61 | 91 |
Higher legume | 146 | 638 | -147 | 62 | 127 |
Higher diversity | 329 | 487 | -129 | 58 | 95 |
Higher intensity | 241 | 463 | -133 | 49 | 92 |
Lower intensity | 181 | 264 | -123 | 25 | 34 |
Disease/pathogen legacy
Eighteen soil and plant pathogens were monitored throughout the experiment, with sampling occurring pre-sowing and post-harvest.
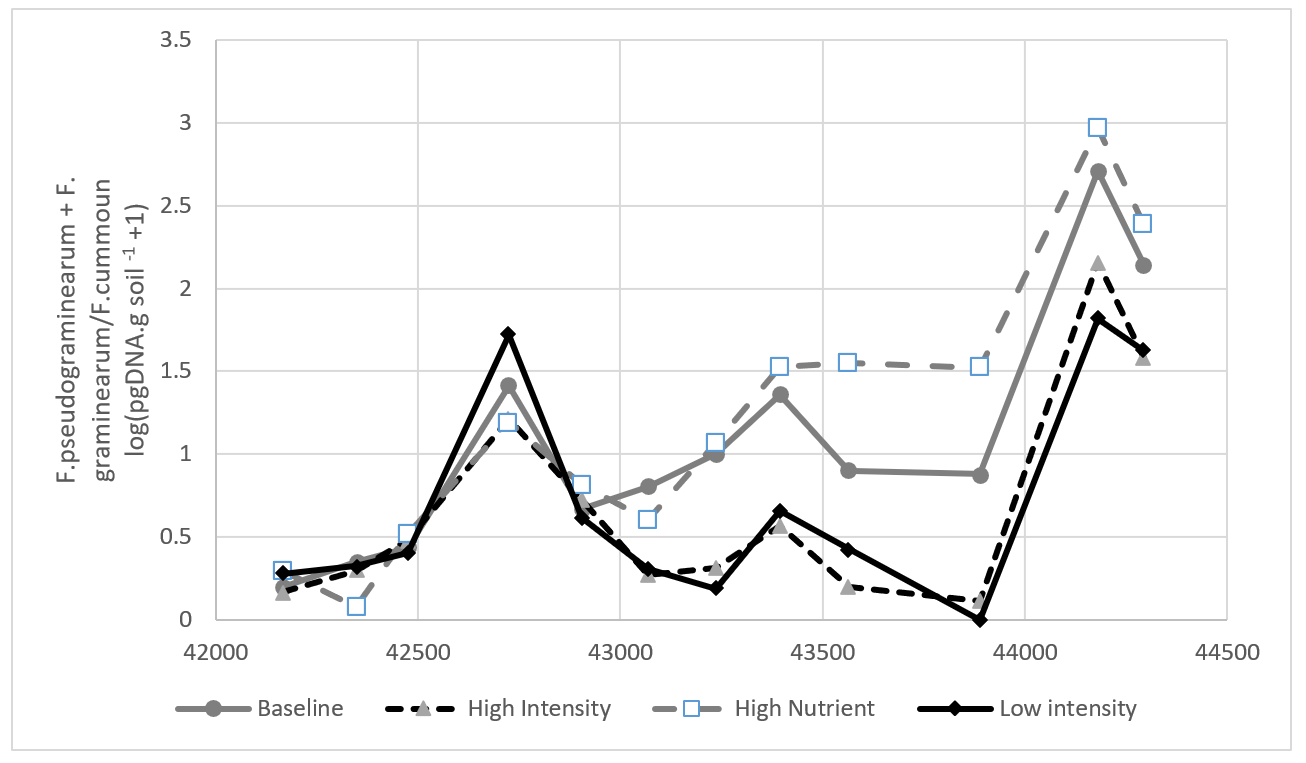
At Spring Ridge, the pathogen which had the largest effect on the various systems has been Fusarium crown rot (FCR), caused predominantly by the fungus Fusarium pseudograminearum (Fp) (Note PreDicta B is also assessing levels of other Fusarium spp. which can cause FCR). FCR is a stubble borne disease of winter cereals and is endemic across northern NSW. Since 2015, FCR disease risk levels have varied significantly between systems with all six systems reaching the high-risk category (>1.2 log (pg DNA/g soil) when no stubble is added to the sample) at the conclusion of the 2020 wheat harvest (Figure 4). FCR infection is favoured by wet conditions throughout the season, whereas expression of the disease as whiteheads and consequently as yield loss, is favoured by hot or dry conditions during grain filling. Wheat was grown across the site in 2020, which given the wet conditions in that year, favoured the significant build-up in FCR inoculum levels in a single host crop. The High and Low intensity treatments, which had not had a winter cereal crop since 2015, tracked lower for FCR inoculum up until 2020. However, even though their FCR levels were lower than most of the other systems at harvest in 2020, the conducive single seasonal conditions for FCR development saw them still go from the low to high-risk category (Figure 4).
The wetter season in 2016 at this site is also interesting in terms of FCR inoculum levels. None of the systems grew a host winter cereal crop in 2016, yet FCR inoculum levels all increased over this period. This is likely due to the wet conditions supporting the saprotrophic vertical colonisation of standing wheat stubble infected by FCR in 2015 (Figure 4). Recent research by Toni Petronaitis (NSW DPI) has shown that Fp can grow vertically up infected winter cereal stubble at a rate of 1 cm/day under high humidity, with implications for harvest height of FCR infected winter cereal crops. https://grdc.com.au/resources-and-publications/grdc-update-papers/tab-content/grdc-update-papers/2020/08/stubble-olympics-the-cereal-pathogen-10cm-sprint
The High nutrient system maintained higher Fp levels from 2017 to 2021 compared to the Baseline system (Figure 4). This is likely a result of the higher applied N fertiliser rates increasing FCR infection. https://grdc.com.au/resources-and-publications/grdc-update-papers/tab-content/grdc-update-papers/2020/03/implications-of-continuing-dry-conditions-on-cereal-disease-management
Figure 4. Dynamic trends of Fusarium crown rot pathogen levels at Spring Ridge for the six farming systems (2015-2021)
Conclusion
A confliction in outcomes between high grain productivity and economic returns was experienced at Spring Ridge. For example, the Higher diversity system (dominated by winter crops) achieved the highest grain productivity, whereas the system based on wheat and cotton had the lowest system yield but the highest gross margin. This result gives growers in the local region a greater flexibility on the direction of their cropping systems with two distinct options providing benefit to a farming operation via different pathways.
There was no overall yield improvement at Spring Ridge when additional fertiliser was applied to the system, but there is a retention of the applied fertiliser (particularly N fertiliser) within the soil profile and as such, the Higher nutrient system has maintained greater mineral N levels compared to the Baseline system. A similar trend was also found with the incorporation of more legumes into the cropping system (especially fababean), as less fertiliser N was required across the cropping sequence and higher soil residual mineral N levels were achieved. The benefit of higher mineral N means there is less reliance on additional applied fertiliser which might buffer production in current times with restricted supply and high fertiliser costs.
Acknowledgements
The research undertaken as part of this project is made possible by the significant contributions of growers through both trial cooperation and the support of the GRDC, the author would like to thank them for their continued support. This research was supported by GRDC through projects CSA00050 and DAQ00192.
References
Petronaitis T, Forknall C, Simpfendorfer S and Backhouse B (2020) Stubble Olympics: the cereal pathogen 10cm sprint, GRDC Grains Research Update paper, July 2020
https://grdc.com.au/resources-and-publications/grdc-update-papers/tab-content/grdc-update-papers/2020/08/stubble-olympics-the-cereal-pathogen-10cm-sprint
Simpfendorfer, S (2020) Implications of continuing dry conditions on cereal disease management, GRDC Grains Research Update paper, March 2020. https://grdc.com.au/resources-and-publications/grdc-update-papers/tab-content/grdc-update-papers/2020/03/implications-of-continuing-dry-conditions-on-cereal-disease-management
Contact details
Jon Baird
NSW Department of Primary industries
Australian Cotton research Institute, Narrabri
Ph: 0429 136 581
Email: jon.baird@dpi.nsw.gov
GRDC Project Code: CSP1406-007RTX, DAQ1406-003RTX,


