What do pulses contribute to the nitrogen balance in Central Queensland farming systems
Author: Douglas Sands (DAF Qld), Darren Aisthorpe (DAF Qld) | Date: 29 Nov 2023
Take home message
- Nitrogen derived from atmosphere (Ndfa) in mungbean crops is strongly influenced by the amount of mineral soil nitrates that are available at planting. There is an almost linear decline in N2 fixation as soil nitrates increase in the top 60cm of the profile.
- Mungbean and chickpea crops can access and utilise soil nitrate N in the top 60cm as efficiently as cereal crops. This raises implications for nitrate N supply in crops following these pulse crops.
- Mungbeans planted in long fallow situations will create a soil nitrate N deficit as N2 fixation rates cannot replace the amount of soil nitrate being exported in grain. Circumstantial evidence suggests that chickpeas may be similar.
Introduction
There are many references in the literature over the last five decades relating to the benefit of pulse crops to the global agroecosystem with biologically fixed nitrogen (N) estimated to contribute 50 million tonnes of N annually to the global agricultural production system (Unkovich et al, 2008). This estimate is about half of the global application of mineral fertiliser N on agricultural land (Unkovich et al, 2008).
Pulse crops in Australia have become a more prominent part of our crop rotation to take advantage of expanding niche markets that offer good gross margins but also in the belief that they contribute to the N resources in our soils. There is no doubt that inoculated pulse crops will fix N2 from the atmosphere which then can be incorporated into the amino acid components of the plant. What is less certain is the quantification of how much total plant N in any one season has been derived from atmosphere (Ndfa) and how much is derived from soil mineralisation.
There is a general recognition that there has been a wide range of data recorded for the amount of N2 fixation that can occur in any one crop or season. There are environmental factors and management practices that can greatly affect the rate of N2 fixation, hence the variable amounts of N2 fixation that have been recorded. One of the biggest influences on the rate of N2 fixation is the level of soil nitrate N available whereby fixation rates progressively decline in the presence of increasing levels of soil nitrate N.
It is this ability of grain legumes to take up soil mineral N in preference to N2 fixation that has impacts on the N management of our broadacre farming systems. The ability to quantify the level of N2 fixation against the level of soil nitrate N by crop species has become more important as industry takes a more detailed focus on long term N management in relation to sustainably increasing grain production.
Background
This report will examine data that has been extracted from Central Queensland (CQ) regional trials relating to both mungbeans and chickpeas in order to be more definitive about the contribution that N2 fixation makes to our soil N resources and comment on the implications that these results have on our N management decisions.
The extracted data relates to two GRDC funded projects that have locally based experiments at the Central Queensland Smart Cropping Centre (CQSCC). The Mungbean Agronomy project (DAQ2104-006RTX) had two experiments designed around testing mungbean yield response to N fertiliser application (mungbean N response).
These experiments were conducted in the 2019-20 and 2020-21 summer season. In these experiments there was a common range of applied fertiliser N treatments which started at 30 kg N/ha up to 150 kg N/ha (Table 1). These fertiliser treatments were band applied directly after wheat harvest in late October of the previous year (cover crop) and then were left fallow (wheat stubble) until the planting of mungbeans in February.
The second experiment in 2020-21 had two added treatments that explored the impact of a much longer fallow on the soil nitrate N profile. These long fallow treatments had no wheat planted over the winter resulting in an eight-month fallow as opposed to a three-month fallow for all the other treatments (Table 1).
Within each of these trials an assessment of N2 fixation was carried using the 15N isotopic natural abundance process on every plot using a non-nodulating soybean variety. From this process the proportion (%) of nitrogen derived from the atmosphere (Ndfa) in the plant could be quantified. Other measurements included soil water and soil nitrates at the start of fallow before the application of the fertiliser N treatments, at planting and harvesting. Further details of these experiments can be found in a previous GRDC update paper ‘What contributions do mungbeans make to soil nitrogen’ (2022).
Table 1. Summary of treatments applied across mungbean N response trials in 2020 and 2021.
2020 trials – treatment list | Treatment name | 2021 trials – treatment list | Treatment name |
|---|---|---|---|
Short fallow + cover crop +zero N applied | 0N | Short fallow + cover crop + zero N applied | 0N |
Short fallow + cover crop + zero N applied, no inoculant | 0N-IN | Short fallow + cover crop + zero N applied , no inoculant | 0N-Nil Inoc |
Short fallow + cover crop + zero N applied + double starter rate | 0N+2ST | Long fallow + zero N applied | LF0N |
Short fallow + cover crop + 30 kg N/ha | 30N | Short fallow + cover crop + 30 kg N/ha | 30N |
Short fallow + cover crop + 60 kg N/ha | 60N | Short fallow + cover crop + 60 kg N/ha | 60N |
Short fallow + cover crop + 90 kg N/ha | 90N | Short fallow + cover crop + 90 kg N/ha | 90N |
Short fallow + cover crop + 120 kg N/ha | 120N | Short fallow + cover crop + 120 kg N/ha | 120N |
Short fallow + cover crop + 150 kg N/ha | 150N | Long fallow + 60 kg N/ha | LF60N |
The other project data that this report will draw on is the Northern Farming Systems project (DAQ2007-002RTX) which is a long-term experiment that has been running since 2015 at the CQSCC and involves collecting a range of data across six different farming system. Those farming systems include:
- Baseline (M01) – A conservative zero tillage system targeting one crop per year. Crops are limited to wheat, barley, chickpea and sorghum, with nutrient application rates on cereals targeting median (50th percentile) seasonal yield potential.
- Higher crop intensity (M07) – Focused on increasing the cropping intensity to 1.5 crops per year when water allows. Crops include wheat, chickpea, sorghum, mungbean and forage crops/legumes, with fertiliser N rates on cereals targeting median (50th percentile) seasonal yield potential.
- Higher legume (M03) – The frequency of pulses in the Baseline system is increased to one pulse crop every 2 years to assess the impact of more legumes on profitability, soil fertility, disease and weeds. Fertiliser N rates on cereals targeting median (50th percentile) seasonal yield potential.
- Higher nutrient supply (M02) – Fertiliser N and phosphorus (P) rates of the Baseline system increased targeting 90th percentile yield potential based on soil moisture in an environment of variable climate. The crops and other practices are the same as the Baseline system.
- Higher soil fertility (M02b) – Based on the Higher nutrient supply system, an additional 60 t/ha of manure (wet weight) was applied to change the starting soil fertility level. This system is designed to see if higher initial soil fertility can be maintained with greater nutrient inputs (90th percentile).
- Integrated weed management (IWM) (X01) – This minimum tillage system is focused on one crop per year but employs a wide range of practices to reduce the reliance on traditional knockdown herbicides in CQ farming systems. Crops include wheat, chickpea, sorghum and mungbean with fertiliser N rates on cereals targeting median (50th Percentile) seasonal yield potential.
Sourced: Aisthorpe D (2023) unpublished
A range of assessments are made on an annual basis across these treatments, including water use efficiency, nutrient balance, nutrient use efficiency, changes in weed populations, changes in disease pathogens, changes in soil health and profitability. Further details on this experiment can be found in another GRDC update paper ‘Farming systems research in the Northern Grains Region and implication for key decisions driving risk and profit in Central Queensland’ (2023).
There have been no assessments made in this trial on Ndfa% for the pulse crops grown across the various cropping sequences; however extensive soil measurements have been taken before and after each crop which shows some interesting results around profile soil nitrate N distribution, N mineralisation rates and the impact of pulses on soil nitrate N levels.
Discussion
Mungbeans
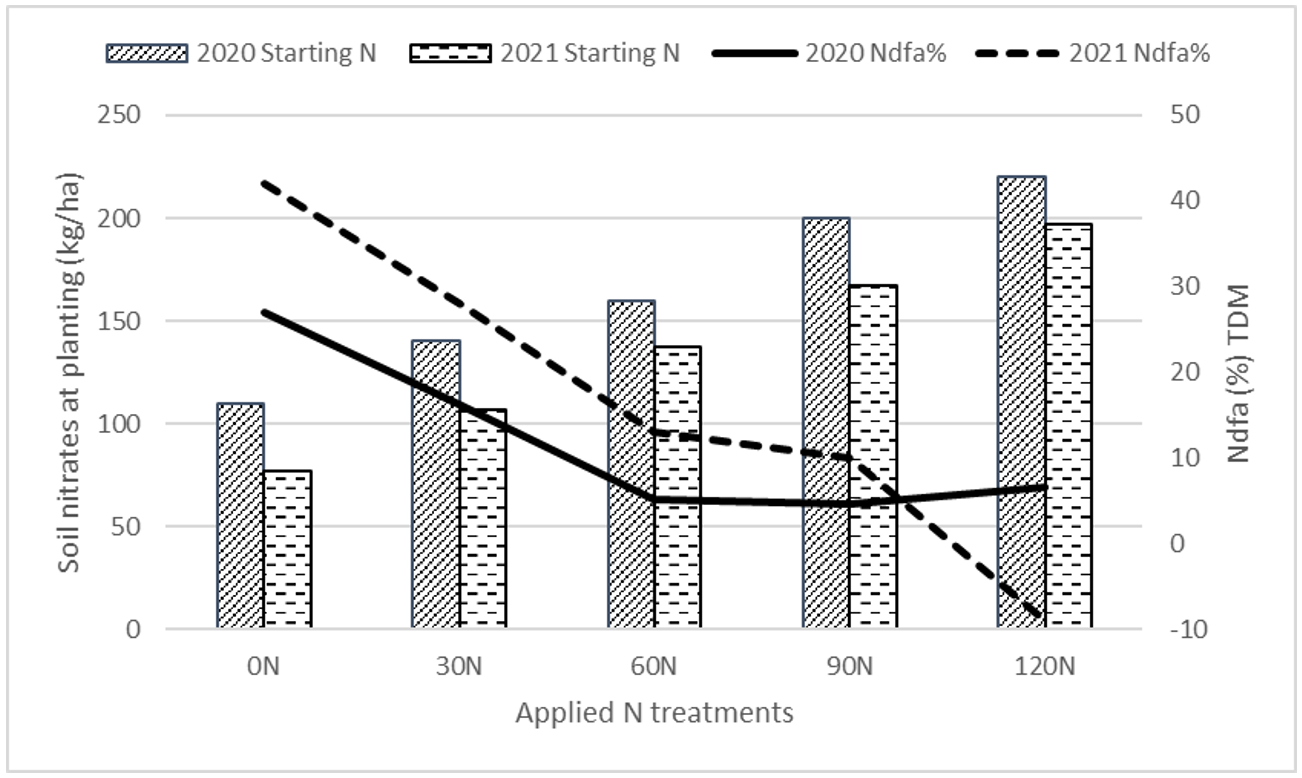
The Ndfa% data extracted from the mungbean N response trials in 2020 and 2021 (Figure 1) shows the effect that increasing soil nitrate N at planting, had on the proportion of N in total dry matter (TDM) being derived from N2 fixation. This trend is consistent with the general understanding that increasing soil nitrate N availability at planting will decrease the rate of N2 fixation and this trend can be linear in most cases. This mungbean data (Figure 1) would suggest that the Ndfa% can go from a high of 45% (0N) to basically zero (90N and 120N).
Figure 1. Nitrogen derived from the atmosphere (Ndfa%) in plant material in comparison to measured profile soil nitrate N at planting time to a depth of 120cm. Data is an average of irrigated and dryland trials located at the CQSCC in 2020 and 2021 summer seasons.
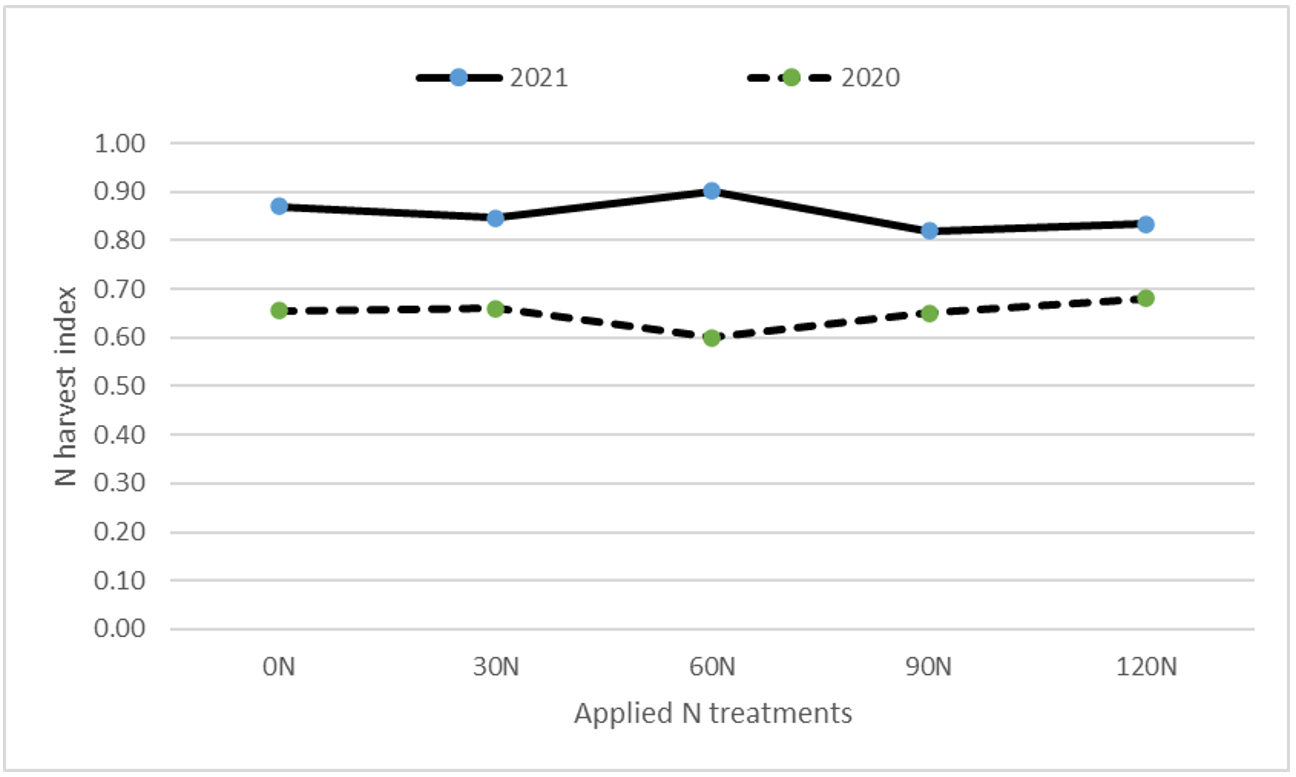
In addition to the Ndfa% data (Figure 1) grain samples were analysed for grain N. This grain N was divided by the total N recorded at peak biomass to calculate the N harvest index (NHI) for the crop. The NHI (Figure 2) represents the proportion of total N being exported from the paddock in grain. The lowest NHI was 0.6 (60%) in the 2020 trial while the upper end of the range was 0.9 (90%) in the 2021 trial.
Figure 2. Calculated N harvest index based on total N in biomass data and total N in grain data.
This data was derived from laboratory analysis.
This means that 60–90% of the total N taken up by the crop from both soil nitrate N and N2 fixation was ending up in the grain. It is unclear why the NHI in 2021 was consistently higher than 2020, although it may be related to yield, as the 2021 season had much higher yields (1.7 t/ha trial mean) than the 2020 trial (0.8 t/ha) due to seasonal constraints.
The NHI (Figure 2) combined with the Ndfa% (Figure 1) can be used to calculate whether the amount of Ndfa% in the stubble (Figure 3) will offset the amount of soil nitrate N in the grain (Figure 3). This calculation is important because it has direct impact on the soil nitrate N balance for the following crop. If there is more soil nitrate N being exported off the paddock than is being replace by N2 fixation, then the soil nitrate N balance will be negative (Table 2).
Figure 3. Calculated Ndfa% contained in stubble (left) based on Ndfa% in biomass and NHI. Calculated soil mineral nitrate N content in grain (right) based on Ndfa% in biomass and total N in grain.
The mungbean N response trials had lower than expected N2 fixation rates, represented by the Ndfa% recorded in both trials (Figure 1). In addition, the NHI showed a much higher proportion of total N uptake being exported from the field (Figure 2) than expected. These two data sets are used to calculate the amount of Ndfa% remaining in stubble compared to the soil mineralised nitrate N that is contained in 
Table 2. Summary of N calculations in crop across increasing rates of N fertiliser treatments. Values from lab analysis include Ndfa(%) and total N in total dry matter (TDM), and grain N. Other figures are calculated from biomass and grain analysis. Data is an average of 2020 and 20221 trial data.
Applied N treatments | Ndfa in TDM (%)* | N in TDM | N harvest index | Grain N | Stubble N | Ndfa in stubble | Mineral N in grain | Soil N balance |
|---|---|---|---|---|---|---|---|---|
0N | 42 | 80 | 0.76 | 59 | 20 | 9 | 34 | -26 |
30N | 28 | 80 | 0.75 | 58 | 22 | 6 | 42 | -36 |
60N | 13 | 83 | 0.75 | 61 | 22 | 3 | 53 | -50 |
90N | 10 | 89 | 0.74 | 67 | 22 | 2 | 60 | -58 |
120N | -9 | 91 | 0.76 | 70 | 21 | -2 | 77 | -78 |
*Derived from lab analysis data
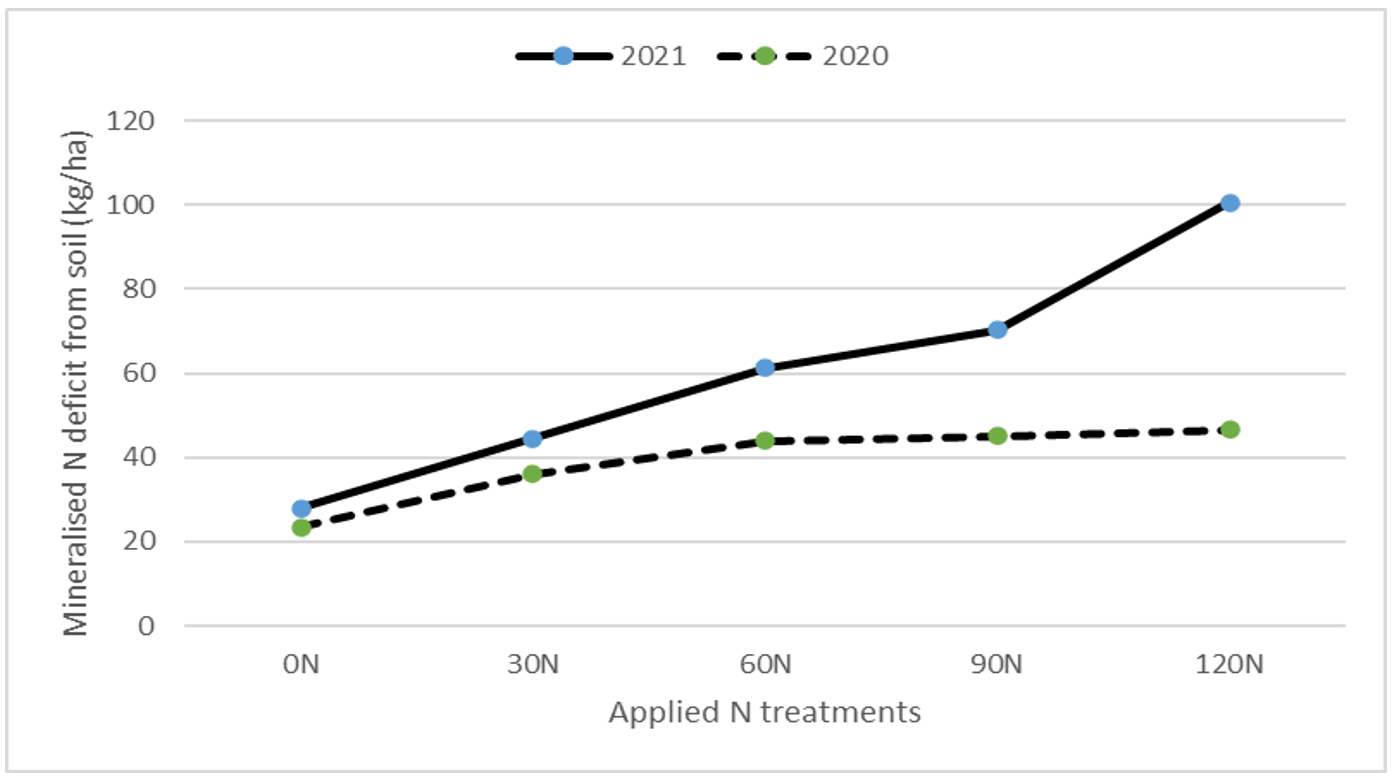
This surplus or deficit to soil nitrate N can be plotted for each fertiliser applied N treatment in both trials (Figure 4). This highlights that all treatments had a soil nitrate N deficit, ranging from 26 kg N/ha to 78 kg N/ha (Figure 4).
Figure 4. Calculated differences between mineral soil nitrate N contained in grain versus Ndfa contained in residual stubble. These differences create either a surplus or deficit in soil nitrate N pool.
There are two qualifications to these results (Figure 4). Firstly, the amount of Ndfa held in the root system has not been measured and will reduce this deficit by contributing more Ndfa to the soil pool.
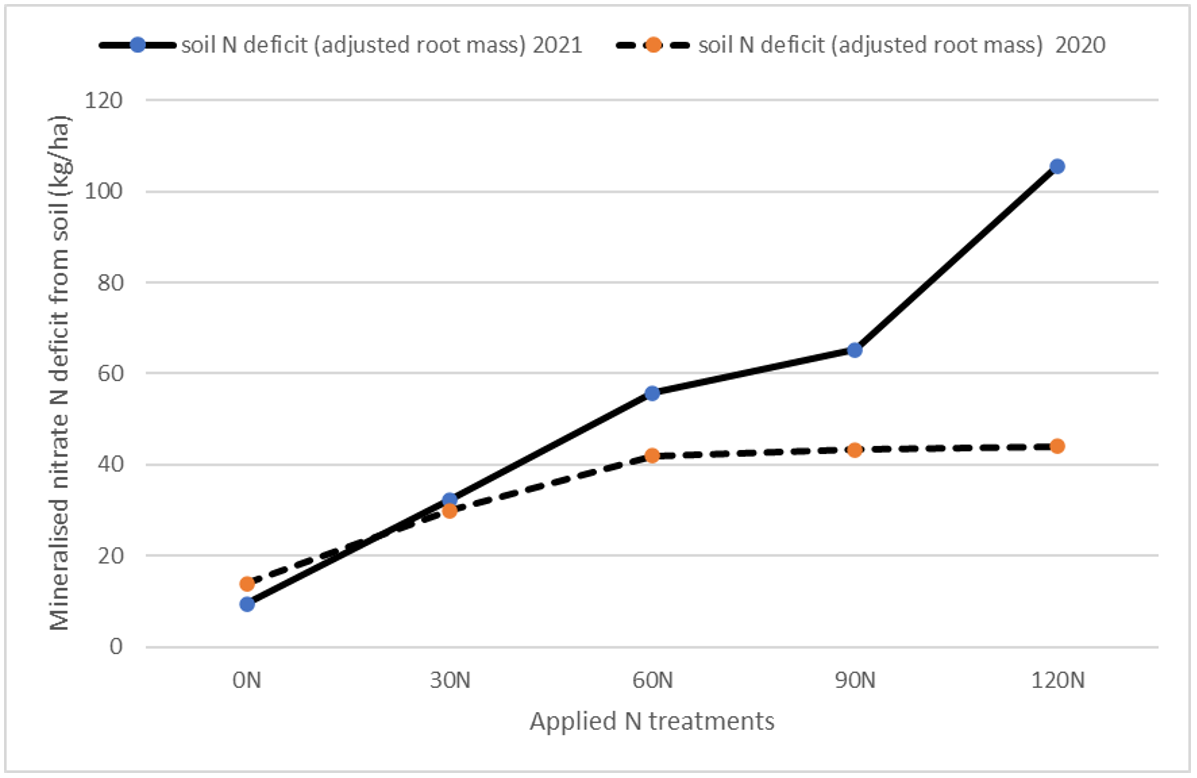
General estimates in the literature suggest that root reserves can contribute another 25–50% of the above ground N contained in biomass, to the soil profile (Unkovich et al, 2008). Considering the measured Ndfa% (Figure 1), a calculation can be made around how much of the root N is derived from atmosphere. This proportion of root N can then be used to reduce the soil nitrate N deficit that was calculated (Table 2) and adjusted across the applied N treatments for a theoretical mineralised soil nitrate N deficit (Figure 5).
The recalculated data for soil nitrate N deficit (Figure 5), taking into account a theoretical contribution from the break-down of the root mass, has changed the 0N and 30N treatment deficits by ~15 kg N/ha and the rest of the treatments by less than 5 kg N/ha (Figure 4). This is largely because the proportion of Ndfa in the higher fertiliser N treatments was originally small so their root mass contribution to the soil nitrate N deficits is also small.
Figure 5. Recalculation of soil nitrate N deficits using the contribution of root mass to total Ndfa% content of the residual stubble. This data is based on a theoretical calculation that assumes that total nitrate N contained in the root mass of a pulse crop is 50% of the above ground biomass.
The second qualification is that the amount of applied N fertiliser used to set up these different concentrations of mineralised soil nitrate N, did not exceed extraction by the mungbean crop, except in the 0N treatment (Figure 5) which amounts to 10 – 15 kg N/ha. The downside of these N fertiliser applications is that the grain yield responses (<200 kg/ha, not shown) were small and could not justify the cost of the fertiliser application from the gross margin return (Sands et al, 2022). This makes the justification for applying fertiliser N to mungbeans more complicated even though the evidence would suggest that the crop will use it.
The management implications of pulse crops that will use soil nitrate N before fixing N2 become more relevant when mungbeans are planted into a longer fallow situation without any applied N fertiliser. In the 2021 mungbean N response trial two extra treatments were used to test the impact of a much longer fallow period on the level of soil nitrate N at planting.
The 2021 long fallow treatments were split between no N applied (LF0N) and 60 kg N/ha applied at the start of the fallow in June the previous year (2020). A comparison between the 0N short fallow treatments and the two long fallow treatments in 2021 (Table 3) shows a distinct difference in the level of soil nitrate N at planting. Subsequently this has led to a lower Ndfa% (not shown) and a higher soil nitrate N deficit after the crop is harvested, using the same calculation process as previously described.
Table 3. Comparison of different fallow length on measured soil nitrate N at planting and calculated soil nitrate deficits based on measured Ndfa and grain N content.
Treatment category | Year | Fallow length | Mineral soil nitrate N at planting | Mineral soil nitrate N deficit |
|---|---|---|---|---|
Short fallow 0N | 2020 | 94 | 110 | 24 |
Short fallow 0N | 2021 | 81 | 77 | 28 |
Long fallow 0N | 2021 | 246 | 134 | 76 |
Long fallow 60N | 2021 | 246 | 196 | 83 |
The important part of this data is that the long fallow treatment with no N applied (LF0N) has a deficit of 76 kg N/ha that has ultimately come from mineralisation of organic matter in the soil and has not been replaced by fertiliser N. This not only has impacts for the following crop but also for the long-term maintenance of nitrate N fertility and organic matter in the soil profile.
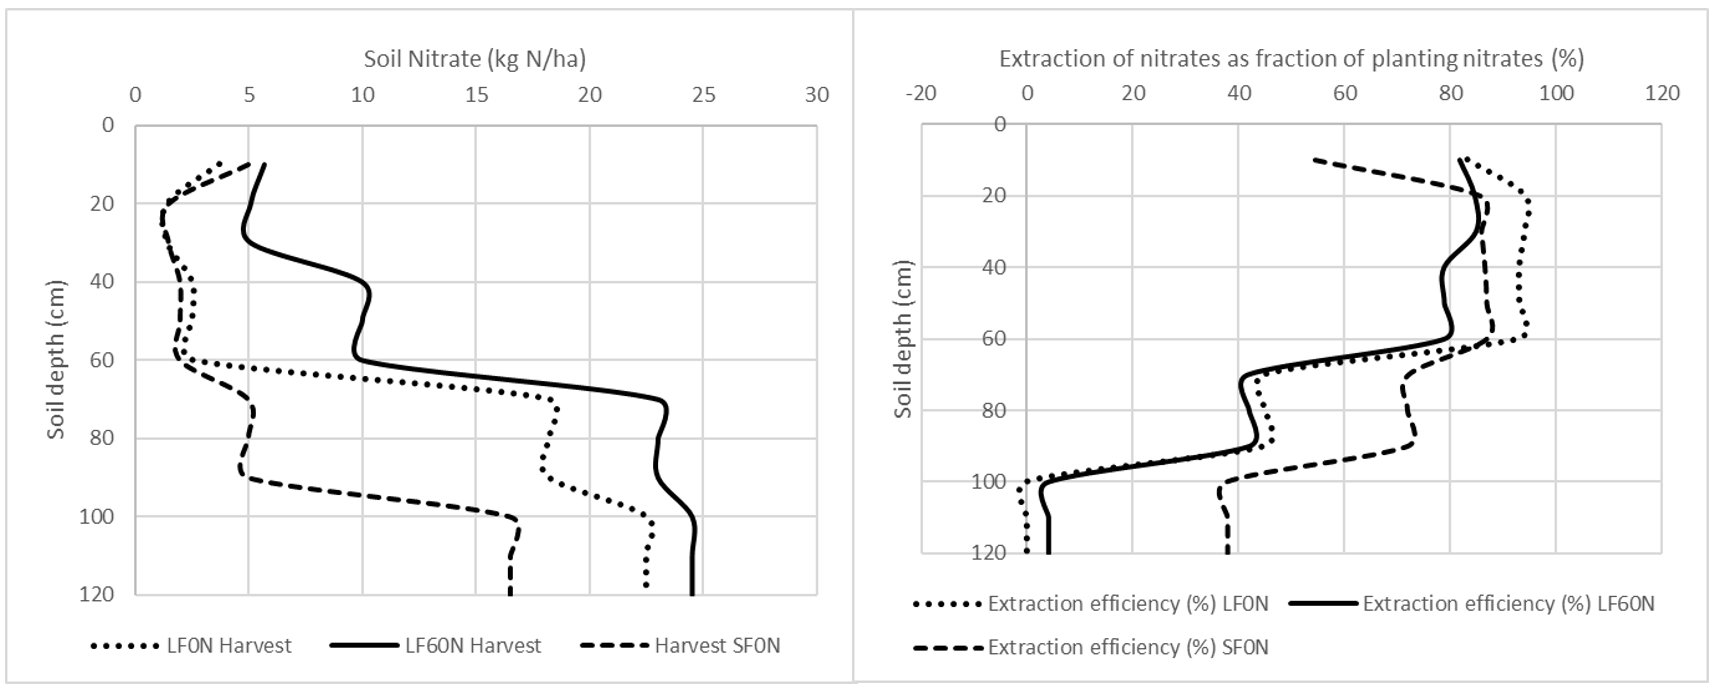
The short-term practical implications of the soil nitrate N deficits are that most of this is taken from the top 60cm of the soil profile (Figure 6) which is the key area of uptake for most crops (Sands et al, 2023). The soil nitrate data for these short fallow and long fallow treatments (Figure 6) shows that nearly 90% of the nitrates in the top 60cm of the profile were utilised by the mungbean crop in both fallow lengths where no N was applied (Figure 6). This means that the top 60cm of the profile needs to be resupplied with nitrate N before the next crop is planted to avoid N limitations to production.
The advantage of applying 60 kg N/ha of fertiliser in the other long fallow treatments is that some of that nitrate is still available in the top 60cm (Figure 6) for the following crop. This long fallow situation (eight months) is not unusual in most CQ cropping systems.
Figure 6. Soil nitrate N measured after harvest (left) and the proportion of soil nitrate N extracted from each layer between planting and harvest (right) of mungbeans in 2021 N response trial, comparing length of fallow.
Chickpeas
The deficits in soil nitrate N left by a mungbean crop may also apply to chickpeas. Currently there is no N2 fixation data collected locally for chickpeas but new projects in 2023 have started to collect this information by using the 15N natural abundance method in commercial chickpea crops. Long term soil monitoring in the Northern farming systems project does offer some insight into the impact of chickpeas on the soil nitrate N levels within a cereal/legume rotation.
Data extracted from one of the six treatments in this long-term project is a good example of the typical changes in soil nitrate N over time that have been seen in the other treatments over the last eight years but in the interest of brevity, this paper will concentrate on a confined data set.
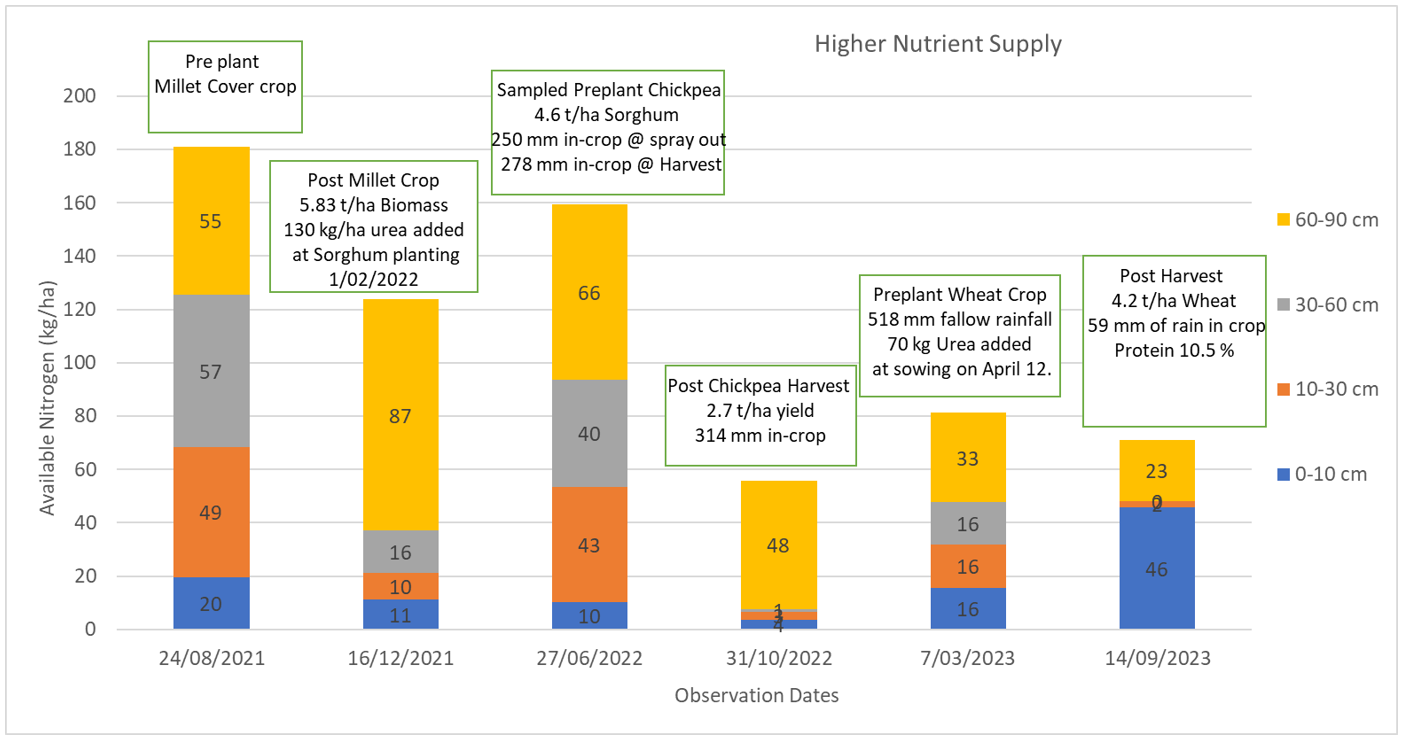
Data extracted from the 24 August 2021 to 14 September 2023 in the Higher nutrient supply (see background description) has six soil testing intervals for soil nitrate N down to 90cm (Figure 7). The timing of those soil testing events are described in relation to the planting and harvest of four crops (millet, sorghum, chickpeas and wheat) in the space of two years.
Stored soil nitrate N was highest at the start of the sequence before the millet crop was planted, at 186 kg N/ha, after an 11-month fallow (Table 4). This was also the most uniformly distributed soil nitrate N through the profile, with all layers having significant amounts of soil nitrate N (Figure 7). Following the millet crop there is a trend where the deepest layer (60–90cm) is being underutilised until the wheat crop in 2023. It is therefore more useful to look at the changes on soil nitrate N in the top 60cm of the profile (Table 4), particularly as there is good evidence from other projects that this is the most efficient zone of N uptake for most crop types.
Figure 7. Soil nitrate N for the Higher nutrient supply treatment (M02) recorded by depth layer for each observation date. Included are details of urea application at planting, planting dates and rainfall totals. (Source: Aisthorpe D (2023) )
Table 4. Summary of soil nitrate N and fertiliser N applications by date and profile depth for Higher nutrient supply treatment.
Event | Pre-plant millet (soil test) | Post millet (soil test) | Plant sorghum plus 60 kg N/ha* | Pre-plant chickpeas (soil test) | Post harvest chickpeas (soil test) | End of fallow (127 days) (soil test) | Plant wheat plus 32 kg N/ha* | Post harvest wheat (soil test) |
|---|---|---|---|---|---|---|---|---|
Event date | 24/08/2021 | 16/12/2021 | 1/02/2022 | 27/06/2022 | 31/10/2022 | 7/03/2023 | 12/04/2023 | 14/09/2023 |
Accumulated Nitrate N 0-90cm (kg/ha) | 181 | 124 | +60 | 159 | 56 | 81 | +32 | 71 |
Accumulated Nitrate N 0-60cm (kg/ha) | 126 | 37 | +60 | 94 | 8 | 48 | +32 | 48 |
*Denotes planting date and application of urea. No soil test measurements.
The soil nitrate N levels from the top 60cm of the profile (Table 4) shows a more distinctive change in soil nitrate N during each crop rotation. The most obvious change is in the chickpea crop grown in 2022 where it has depleted the top 60cm of soil nitrate N effectively from 94 kg N/ha to 8 kg N/ha.
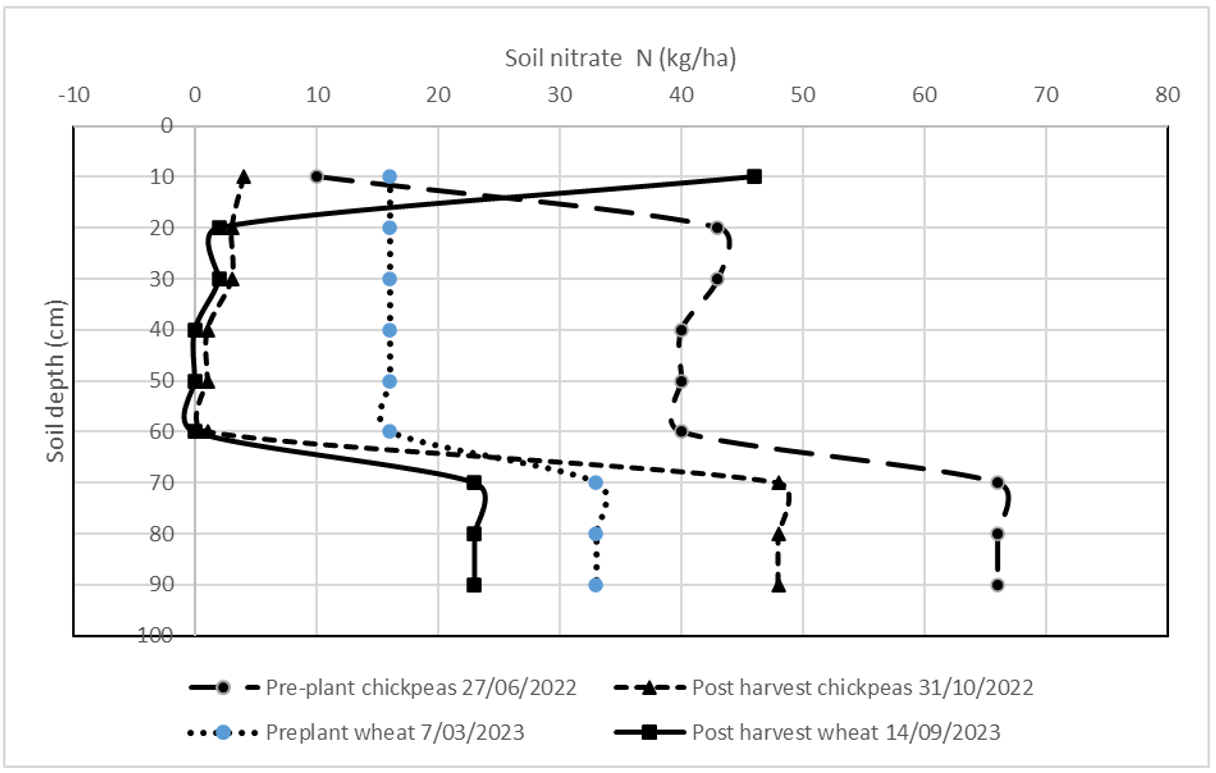
Mineralisation following this chickpea crop, over a four-month fallow, has added 40 kg N/ha and another 32 kg N/ha has been added through a urea application (70 kg/ha) at planting of the wheat crop. Most of this urea appears to have been trapped in the top 10cm (Figure 8). This is most likely due to the fact there was only 59mm of in-crop rainfall (Figure 7) after planting. This wheat crop has been forced to drag as much soil nitrate N out of the 10 to 60cm layers and access some of the nitrate N held in the deeper layers to meet its requirements for a 4.2 t/ha grain yield with 10.5% protein.
This scenario demonstrates the capacity of chickpeas to utilise soil nitrate N efficiently from the top 60cm of the profile (Figure 8). The fallow mineralisation following the chickpea crop has not been able to refill the top 60cm profile to the same level as at the planting of the chickpea crop, even though chickpea residual stubble and roots were being broken down in the top 30cm of the profile with a low carbon to nitrogen ratio (C : N), so it would have released N quickly.
Figure 8. Comparison of the distribution of soil nitrate N in the profile at planting and harvest of chickpeas in 2022 and wheat in 2023.
The application of urea at planting of the wheat crop was not utilised by the wheat crop. This may be because after this application there was not enough rainfall to redistribute this fertiliser derived nitrate N deeper into the profile where it could be used effectively. If this fertiliser had been added at the start of the fallow it would have had 518mm of rainfall to help redistribute and may have been better utilised by the wheat crop.
Regardless of the timing of fertiliser application it is clear that chickpeas are utilising soil nitrate N as effectively as any cereal crop much like the observations made in mungbeans.
The soil nitrate N profile of 94 kg N/ha available to the chickpea crop at planting was well distributed following the sorghum crop harvest which is unexpected considering the sorghum crop should have used ~120 kg N/ha.
The lack of a soil nitrate N deficit after sorghum harvest may be because 60 kg N/ha was applied (130 kg/ha of urea) at planting of the sorghum crop and there was 528 mm of in-crop rainfall to help with distribution and access. In addition to this fertiliser N application, it is assumed that the N that was locked up in the millet crop residue (~ 91 kg N/ha) was also released during this time and contributed to the 4.6 t/ha sorghum crop.
It should be noted that the millet crop was not harvested for grain but was instead terminated (sprayed out) and left to breakdown on the surface of the soil. Most of this crop residue had broken down by the time the sorghum was harvested.
This scenario leading up to the chickpea planting demonstrates how important rainfall is to incorporate and distributing nitrate N effectively into the profile. The timing of fertiliser application following the chickpea crop, also demonstrates how important it is to maintain a consistent supply of N in the surface soil prior to rainfall to effectively refill the top 60cm of the profile.
Key outcomes for growers
Based on the evidence presented in this paper and previous papers it is clear that both chickpeas and mungbeans will take up nearly all the soil nitrate N in the top 60cm of the profile before it will start fixing N2. This has an immediate impact on the availability of soil nitrate N for the following crop.
Both mungbean and chickpea crop residues break down at a faster rate than cereal stubble because of the lower C:N ratio. Based on the evidence given in this paper the amount of N released from this residual stubble is not replacing the amount of soil nitrate N that is being exported in grain. This means that there is a reliance on the mineralisation of organic matter to provide enough nitrate N to cover the short fall in the soil nitrate N pool after a mungbean or chickpea crop has been harvested.
The reasoning for this is based on the 15N natural abundance measurements taken in mungbean trials where N2 fixation levels were in general lower than expected, and the fixation level reduces as soil nitrate N levels increased. The NHI is also high which means that 60–90% of the N is being exported in grain rather than being returned in stubble residue. It is these two key factors that dictate the ability for a mungbean crop to replace the soil nitrate N that it uses.
The data for chickpeas does not include an analysis of its ability to fix N2 in this paper, however it does show evidence that it sources its N in a similar manner to mungbeans. This is based on the measured extraction of soil nitrate N in the top 60cm of the profile.
The characteristics highlighted in this paper do not change the fact that pulses are grown chiefly because of the gross margin they can generate for the grower and their capacity to provide their own N when soils are limited in nitrate N. This still provides a unique advantage over the production of cereals.
The data in this paper simply highlights the fact that soil nitrate N levels following a legume crop such as chickpeas or mungbeans will be just as low as following a cereal crop and that the pulse crop residue may not be able to replace the amount of nitrate N that has been exported in grain. This is dependent on several factors with the chief of these being the level of soil nitrate N that the crop gets planted into.
In a dryland cropping system where there is a heavy reliance on fallow periods to recharge stored soil water, this also provides a period for N mineralisation from existing soil organic matter. Mineralisation occurs naturally and is largely controlled by environmental factors (temperature, water, organic matter levels) without any grower input.
For example, fallow periods often allow for the mineralisation of 30–50 kg N/ha in most Vertosol soils which in turn means that at planting time, pulse crops can have 70–80 kg N/ha available (assuming about 30 kg N/ha left after most crops). At this moderate level of soil nitrate N, it has been shown by the mungbean data that it will impede N2 fixation to the point that Ndfa% will be less than 50% depending on the biomass production of the crop. At this level the crop is not fixing enough N to replace what is being taken off in grain.
Future long-term management of N fertility in our broadacre cropping systems will need to account for the potential deficits that can result from growing pulses such as mungbeans and chickpeas. Replacement of soil nitrate N needs to be considered after pulse crops to reduce the pressure on the mineralisation of soil organic matter reserves and providing adequate N supply for the following crop to meet its yield potential.
References
Unkovich M, Herridge D, Peoples M, Cadisch G, Boddey B, Giller K, Alves B and Chalk P (2008) Measuring plant-associated nitrogen fixation in agricultural systems. ACIAR Monograph No. 136, 258 pp.
Sands D, Gentry J, Silburn C (2022) What contribution do mungbeans make to soil nitrogen? GRDC Update paper, Biloela 2022.
Aisthorpe D (2023) Farming systems research in the Northern Grains region and implications for key decisions driving risk and profit in Central Queensland. GRDC Update papers, Emerald 2023.
Sands D (2023) Distribution of nitrates and its effect on plant uptake efficiency in Central Queensland farming systems. GRDC update papers, Emerald 2023.
Acknowledgements
The research undertaken as part of this project is made possible by the significant contributions of growers through both trial cooperation and the support of the GRDC, the author would like to thank them for their continued support.
The authors would like to acknowledge the efforts of Peter Agius, Penny Borger, Ellie Parkinson, Jane Auer who were the technical officers involved in collecting the data that has been presented in this paper.
Contact details
Douglas Sands
Department of Agriculture and Fisheries, Queensland.
99 Hospital Road, Emerald. 4720
Ph: 0457 546993
Email: [email protected]
Date Published
November 2023.
GRDC Project Code: DAQ2007-002RTX, DAQ2104-006RTX,
Was this page helpful?
YOUR FEEDBACK

