What contribution do mungbeans make to soil nitrogen?
Author: Doug Sands (DAF Qld), Jayne Gentry (DAF Qld), Cameron Silburn (DAF Qld) | Date: 24 Nov 2022
Take home message
- There is limited grain yield response to applied nitrogen in the fallow prior to planting mungbeans
- Increasing nitrate supply in the top 60cm of the profile reduces the amount of nitrogen that is fixed from the atmosphere
- Mungbeans are a net consumer of soil nitrates when the nitrogen fixation rate is less than 55% of total nitrogen uptake by the plant.
Introduction
Mungbean (Vigna radiata (L.) Wilczek) is one of the main summer pulses grown on the Australian eastern seaboard and has provided strong cash prices over the last decade. Traditionally, mungbean has been sown as a rotational cash crop that is thought to also contribute nitrogen to the farming system and help reduce reliance on fertiliser nitrogen and mineralised nitrogen from organic sources.
In more recent times the prices for mungbeans has highlighted that strong gross margins could be generated from the crop, and it has become a dedicated cash crop in our farming system. Hence in more recent times, research emphasis has been on increasing the productivity of the crop in our environment. Nutrition is a key area to develop higher levels of production in this crop, within this area nitrogen (N) has been long overlooked as a potential source to enhance production because of the plants’ nitrogen fixing properties.
Over the 2020 and 2021 summer seasons, the Mungbean Agronomy project ran a series of trials examining the grain yield response and nitrogen fixation impacts of applying a range of N rates in the fallow prior to planting mungbeans.
Experimental outline
2020 season
A trial site was established at the Central Queensland Smart Cropping Centre (CQSCC) near Emerald, which had a wheat cover crop planted for the winter of 2019. This crop was planted without any fertiliser and taken through to harvest to reduce the amount of N in the profile.
After wheat harvest, the site was set up for 64 plots (4m x 24m) in a randomised block design. Treatments applied were as follows:
- No N applied (0N)
- No N applied and no inoculation at planting (0N-IN)*
- No N applied plus double starter rate at planting (0N+2ST)
- 30 kg N/ha applied (30N)
- 60 kg N/ha applied (60N)
- 90 kg N/ha applied (90N)
- 120 kg N/ha applied (120N)
- 150 kg N/ha applied (150N)
*All treatments except treatment 2 (0N-IN) have inoculant applied at planting through water injection.
**All N treatments (4 to 8) were applied after wheat harvest on the 25 November. N was applied as urea dissolved in water solution and sprayed onto soil surface between standing stubble rows. Soil profile was too dry and hard to use banding applications. Site was irrigated the following day (26 November) after N applications with 100mm.
***Treatments were doubled up to make two separate trials situated side by side. One trial received supplementary irrigation the other remain in a dryland scenario. Four replicates of eight treatments in each trial making a total of 64 plots for the site.
The whole site was irrigated again starting on the 16 December with another 100mm application by travelling boom irrigator. The site received 217mm of rainfall from the start of January through to planting on the 14 February. Average plant available water content (PAWC) at planting was 120mm (1.2m profile).
The whole site was planted with Jade Au at a seeding rate of 30 seeds/m². Non-nodulating soybeans were hand planted into each plot on 17 February in area of ~1 m². These soybeans were used as the contrast species for 15N isotope analysis of natural abundance testing at peak biomass.
Measurements
- Soil cores were taken for nutrition testing after wheat harvest, at planting and after mungbean harvest. Additional soil cores were taken for gravimetric assessment at planting and at harvest.
- Predicta®B testing was conducted after planting
- Plant establishment counts
- Light interception measurements were taken prior to flowering, at flowering and after flowering
- Dry matter (DM) cuts were taken at peak flowering, peak biomass and 90% black pod. Peak biomass samples were used for 15N assessment. The non-nodulating soybean quadrats were also cut at the same time. The maturity cuts taken at 90% black pod were used for hand harvest assessments
- Dates for 50% flowering, 50% black pod and 90% black pod were recorded for each plot
- Final grain yields obtained via plot harvester.
The irrigated trial was given one application of 50mm by travelling boom on the 24 March (post- flowering). In crop rainfall on 6th March meant the first irrigation prior to flowering was not required.
2021 season
A trial site was established at the CQSCC in early June 2020. This experiment was set up in a similar structure to the previous season (2020) with the addition of two long fallow (LF) treatments. These treatments were set up in early June prior to wheat planting, with one treatment receiving 60 kg N/ha applied on 50 cm bands in the top 10 cm and the other treatment had no N applied as a control for the long fallow (LF60, LF0). The rest of the trial site was planted to a wheat cover crop over the winter of 2020. This crop was planted without any fertiliser and taken through to harvest to reduce the amount of N in the profile.
After the wheat harvest, the rest of the treatments were applied (Table 1) on 19 November with the same configuration as the long fallow treatments. Trial design was a randomised block design with the eight treatments randomised within each replicate with four replicates in total. Each plot was 4 m wide by 24 m long and the whole trial was repeated so that one trial could be managed as a dryland trial and the other would have overhead irrigation applied to create a higher yield demand on the treatments.
Table 1. List of treatments for the N response trial
8 treatments: | No. | Name |
|---|---|---|
Long Fallow + zero N | 1 | LF0N |
Long Fallow + 60N | 2 | LF60N |
Short Fallow + Cover crop +zero N | 3 | CC0N |
Short Fallow + Cover crop +zero N, No inoculant* | 4 | CC0N-Nil Inoc |
Short Fallow + Cover crop +30N | 5 | CC30N |
Short Fallow + Cover crop + 60N | 6 | CC60N |
Short Fallow + Cover crop + 90N | 7 | CC90N |
Short Fallow + Cover crop + 120N | 8 | CC120N |
*All treatments except treatment 4 have inoculant applied at planting through water injection
**N treatments were applied either in June 2020 (treatment 2) or after wheat harvest on the 19 November 2020 (treatments 5 to 8). N was applied as urea between standing stubble rows with a double disc opener into the top 5 cm of the surface profile. Site was irrigated with 100 mm on the 25 November with overhead sprinklers on a travelling boom.
***Treatments were doubled up to make two separate trials situated side by side. Four replicates of eight treatments in each trial making a total of 64 plots for the site.
The whole site was irrigated again starting on the 7 January 2021 with another 100 mm application by travelling boom irrigator. The site received 240 mm of rainfall from the 26 November 2020 through to planting on the 24 February 2021. Average plant available water (PAW) at planting was 132 mm (1.2 m profile).
Whole site was planted with Jade-AU at a seeding rate of 30 seeds/m². Non-nodulating soybeans were hand planted into each plot on 25 February in area of ~1 m². These soybeans were used as the contrast species for 15N testing at peak biomass.
The irrigated trial was given two applications of 40 mm each by travelling boom on the 31 March and the 14 April. Both trials received 90 mm of in-crop rainfall.
Measurements:
- Soil cores were taken for nutrition testing after wheat harvest, at planting and after mungbean harvest. Additional soil cores were taken for gravimetric assessment at planting and harvest
- Predicta®B testing was conducted after planting and at harvest
- Plant establishment counts
- Light interception measurements were taken prior to, at and after flowering
- Dry matter cuts were taken at peak flowering, peak biomass and 90% black pod. Peak biomass samples were used for 15N assessment. The non-nodulating soybean quadrats were cut at the same time. The maturity cuts taken at 90% black pod were used for hand harvest assessments
- Dates for 50% flowering, 50% black pod and 90% black pod were recorded for each plot
- Final grain yields were obtained via plot harvester.
Results
The data from these trials have similar trends, so for the benefit of this paper the results are presented together, however the statistical analysis was done separately for each trial.
In both trials the starting nitrates were measured at planting in the zero N treatments (CC0N) and despite efforts to reduce the starting N by growing a wheat cover crop over the preceding winter; mineralisation rates proved to be higher than normal in the 2020 trial. This trial had 110 kg N/ha at planting to a depth of 120cm with a large proportion of this N being in the 30-60cm layer (Figure 1). The 2021 trial had 77 kg N/ha at planting to a depth of 120cm, with most of this N evenly distributed down the profile (Figure 1).
The 2020 trial had a very high mineralisation rate (68 kg N/ha over 3 months) leading up to planting, while the 2021 trial had a more normal mineralisation rate (21 kg N/ha over 3 months) which would not be unusual in most commercial paddocks.
Figure 1. Average of planting nitrates distributed down the profile for the 2020 trial (left) and the 2021 trial (right).
The grain yield in the 2020 trial showed no significant differences in grain yields (Table 1). This means that none of the applied N rates increased grain yield any more than those treatments that had no N applied (0N, 0N-in, 0N+2ST). The mean yields across the treatments (0.6 – 1.3 t/ha) were considered low by commercial standards and the amount of starting nitrate at planting could have already met the modest crop demands.
The grain yields from the dryland trial in 2021 (Figure 2) did show some significant differences between selected treatments. Most notable was a ~180 kg/ha difference between the CC30N treatment and all the other treatments that received N (CC60N,CC90N,CC120N and LF60N) in the dryland trial. There was also a ~200 kg/ha difference between the two zero treatments (LF0N, CC0N) and the rest of the applied N treatments.
While these differences are statistically valid, the gross margin outcomes suggest that these differences are not worth pursuing. An outlay of $162/ha for 130 kg/ha of urea ($1250/t) will return $200/ha in extra mungbean yield ($1000/t). This amounts to a $38/ha return on the extra fertiliser applied. The other factor is that this marginal response seems to be only relevant to a crop that is yielding ~1.5 t/ha or better, as there was no response in the previous season where yields were less than 1 t/ha.
The use of irrigation in season 2021 increased the general yields across all treatments (Figure 2), however the only significant yield improvement to N application was in the CC120N treatment which was 214 kg/ha better then the CC0N treatment. This trial result would lead to a $111/ha loss in relation to applying 120 kg N/ha as urea.
Table 1. Mean mungbean grain yields recorded for both hand harvested and machine harvested measurements in the 2020 N trial.
Treatments | Dryland | Irrigated | ||
|---|---|---|---|---|
Machine harvest grain yield (kg/ha) | Hand harvest grain yield (kg/ha) | Machine harvest grain yield (kg/ha) | Hand harvest grain yield (kg/ha) | |
0N | 573 | 983 | 1069 | 1295 |
0N + 2ST | 577 | 895 | 1012 | 1199 |
0N -in | 660 | 1041 | 941 | 1418 |
30N | 681 | 1046 | 1130 | 1398 |
60N | 607 | 936 | 1045 | 1538 |
90N | 711 | 1034 | 1019 | 1408 |
120N | 670 | 1164 | 934 | 1349 |
150N | 612 | 922 | 1013 | 1229 |
Trial means | 637 | 1003 | 1021 | 1354 |
SE of means | 60 | 100 | 195 | 153 |
LSD0.05 | n.s. | n.s. | n.s. | n.s. |
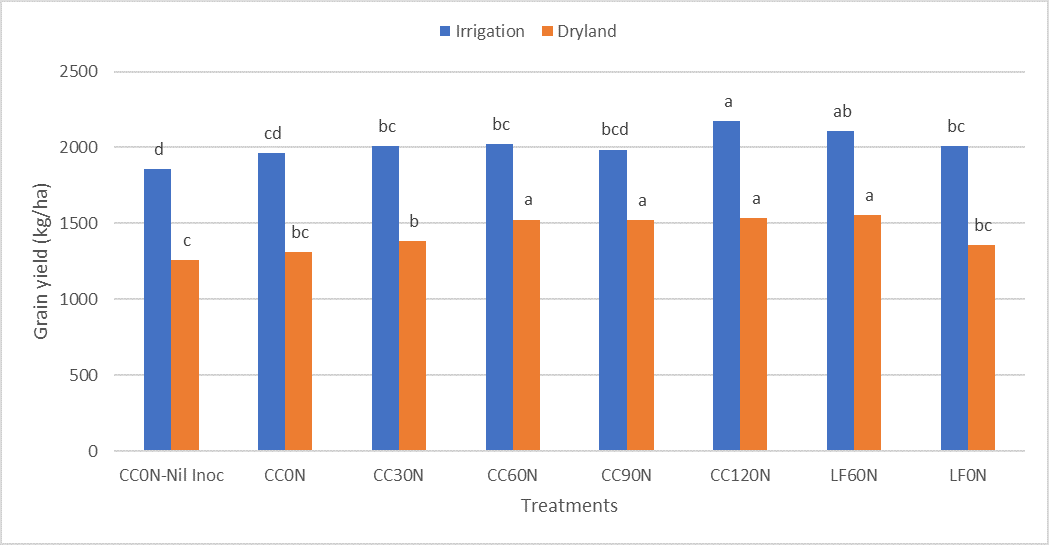
Figure 2. Mean mungbean grain yields recorded for machine harvested measurements in the 2021 N trial. LSD have been generated separately for the irrigation (128.7) and dryland (97.9) trials. Means with same letters are not significantly different at the P=0.05 level.
The yield data from both the 2020 and 2021 trials would suggest that mungbean grain yields are generally not responsive to applied rates of N. This means that either the crop is fixings its own N and does not rely on soil nitrates, or that in both these trials the level of soil nitrates at planting was enough for total crop uptake. The third option is that the crop uses a combination of both soil nitrates and fixed N via rhizobia interaction, to meet its N needs and can compensate using either source during the season without impacting on yield.
To define this issue further, N fixation was measured in both trials through the 15N isotope natural abundance process using non-nodulating soybeans as the comparison species.
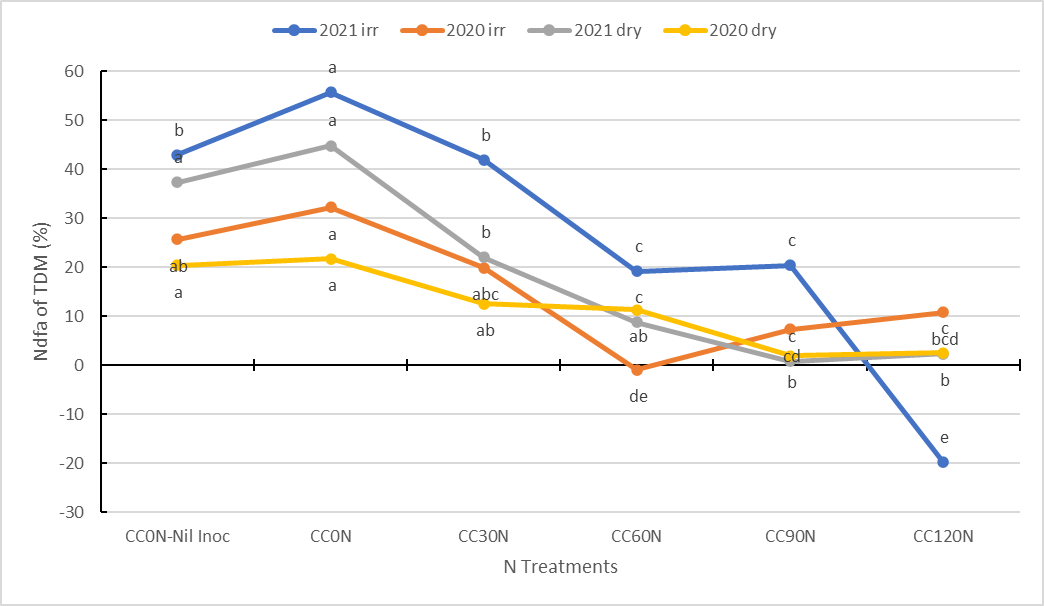
Figure 3. Mean % values of total N uptake in above ground total dry matter (TDM) that can be attributed to nitrogen derived from atmosphere (Ndfa) fixed by symbiotic rhizobium bacteria. These measurements have been taken from both irrigated and dryland trials across the 2020 and 2021 seasons. Means with the same letters are not significantly different at the P=0.05 level.
The percentage of nitrogen derived from atmosphere (Ndfa%) in total dry matter (TDM) measurements (Figure 3) shows a similar pattern across all four trials. Despite the amount of soil nitrate that was present at planting in both years, the crop clearly nodulated and fixed the maximum amount of N in the CC0N (control) treatments. The proportion of fixed N in these controls varied from 20-30 % of TDM in 2020 increasing to 45-55 % in 2021 (Figure 3). This may reflect the fact that the 2021 crop had starting nitrates of 77 kg N/ha which was 33 kg N/ha less then the previous trial in 2020. It could also be a symptom of a higher yielding crop.
The most common factor of all four trials is that the Ndfa% in TDM decreases as nitrate supply increases from N application. In most cases the percentage of Ndfa reduces to less then 10% once the application rate reaches 60 kg N/ha or more. The only exception to this was the irrigated trial in 2021 where the grain yields exceeded 2 t/ha and the Ndfa% remained at 20% for both 60 and 90 kg N/ha applied (Figure 3). This may have been because the plant was feeding a larger biomass.
In three out of the four trials there is a linear regression between increasing N applied and decreasing rate of Ndfa% (linear regression not shown). The reduction in Ndfa% has a direct impact on the amount of ‘free’ N (atmospheric sourced N) which is being incorporated and retained in the soil profile after the crop is harvested. The lab analysis of TDM (Figure 4) and grain (Figure 5) shows how much total N is taken up by the crop irrespective of what the Ndfa% is.
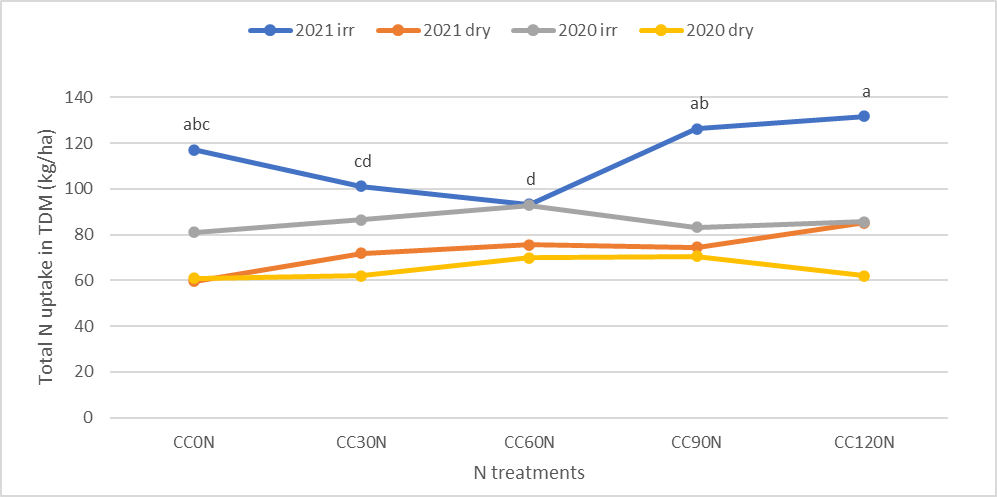
Figure 4. Mean values for the total amount of N taken up in TDM across the five main N rates in each of the four trials. Means with the same letter are not significantly different at the P=0.05 level. Means without letters have no relative significant differences within the data set.
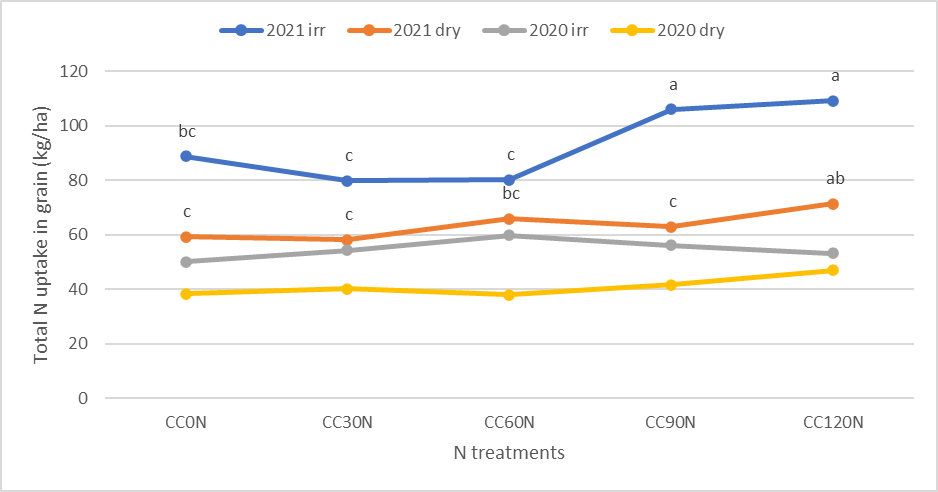
Figure 5. Mean values for the total amount of N taken up in grain across the five main N rates in each of the four trials. Means with the same letter are not significantly different at the P=0.05 level. Means without letters have no relative significant differences within the data set.
The amount of N taken up by the plant in TDM (Figure 4) is not responding to increasing levels of applied N except in the irrigated trial in 2021. The proportion of this crop N uptake in TDM that ends up in the grain is also consistent across N treatments (Figure 5). These two pieces of data can be combined into a N harvest index (Figure 6) which reinforces the consistency in the proportion total N uptake which is distributed to the grain regardless of the amount of N applied (Figure 6). What is surprising about this data is how high this harvest index is, particularly in the 2021 trials. In most situations, the plant is only returning 10-20% of its total N uptake back in residual stubble in the 2021 season. In the 2020 season that proportion increased to 30-40% across all N treatments.
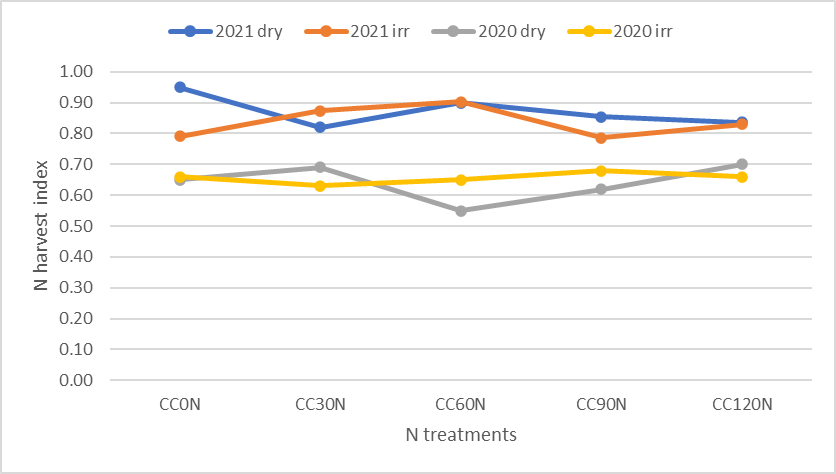
Figure 6. Mean values for the N harvest index calculated across the five main N rates in each of the four trials. Means without letters have no relative significant differences within the data set.
The proportion of N remaining in the residual stubble of the plant after harvest has a direct effect on the amount of Ndfa that is being returned to the soil profile as new N or ‘free N’. Using the Ndfa% and the grain and TDM uptake lab results, a calculation can be made on how much Ndfa is remaining in the residual stubble (Figure 7). The amount of Ndfa being returned to the soil profile is quite small. Even in the control treatments (CC0N) where the amount of fixation was at its highest, the maximum amount of Ndfa being contributed is 14 kg N/ha or less. In the dryland trials that number is closer to 2-4 kg N/ha.
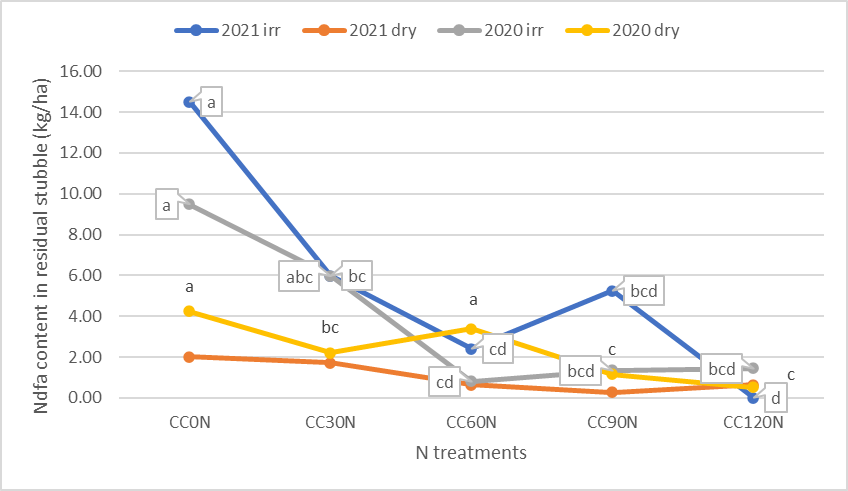
Figure 7. Mean values for the amount of Ndfa remaining in residual stubble after the crop has been harvested. These calculations have been made across the five main N rates in each of the four trials. Means with the same letter are not significantly different at the P=0.05 level. Means without letters have no relative significant differences within the data set.
The amount of Ndfa being returned in stubble needs to be compared to the amount of soil nitrates that are being exported off the paddock in grain. Using the Ndfa% for TDM and applying this proportion to both grain and residual stubble, a calculation can be made on whether the crop is a net contributor or a net consumer of the original pool of soil nitrate that was present at the start of the crop. In all four trials across the two seasons, the calculated data shows that the mungbean crop was a net exporter of soil nitrates (Figure 8). The net amount exported depends on the amount of soil nitrates present at the time of planting and this follows a general linear trend (Figure 8 linear regression not shown). This data shows a range of between 20 – 60 kg nitrates/ha is exported from the soil profile, although the 2021 irrigated trial shows this removal rate can be as high as 130 kg N/ha (Figure 8).
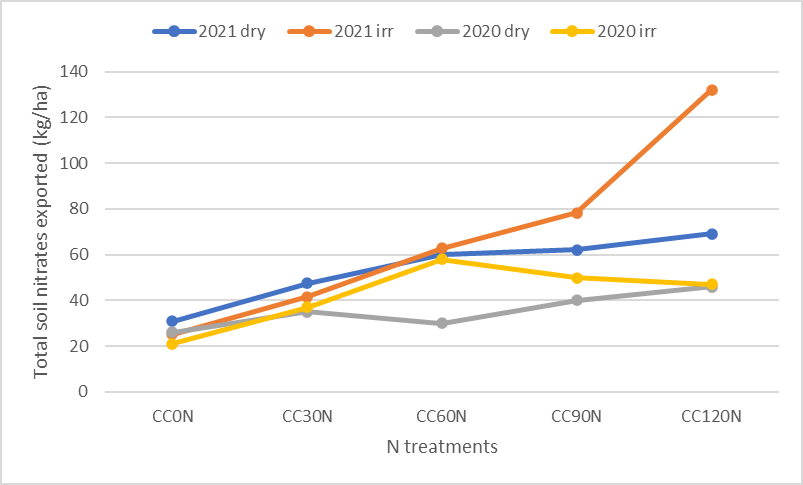
Figure 8. Mean values for the amount of soil nitrates that are exported from the field in grain. These calculations have been made across the five main N rates in each of the four trials. Statistical analysis has not been done on these calculations.
The amount of nitrate in the profile at planting impacts the amount of N exported from the field. The 2021 trials included two long fallow scenarios where plots were left fallow for 15 months prior to planting (wheat 2019 to mungbean 2021). One of these fallow treatments had 60 kg N/ha added eight months prior to planting. The nitrates measured at planting from these two fallow scenarios (Table 2) shows a considerable increase in soil nitrate levels compared to the CC0N and CC60N treatments that had a much shorter fallow (3 months).
The nitrate level in the long fallow 0N treatment was equivalent to the CC60N treatment (60 kg N/ha applied in a short fallow, not shown) and the nitrate levels for the long fallow treatment with 60 kg N/ha applied in June 2020 was equivalent to the CC120N treatment (120 kg N/ha in a short fallow, not shown). These two long fallow scenarios are not uncommon in our current farming systems so the amount of nitrates that are exported off the paddock (Table 2) by mungbeans in these treatments has some commercial validity.
Consistent with the data presented already in relation to N application rates, the long fallow treatments exported similar amounts of soil N off the paddock as those short fallow treatments that had equivalent starting soil nitrates at planting (Table 2, CC60N and CC120N).
The total amount of soil nitrates exported off the paddock by a mungbean crop is worth considering when trying to mange the N supply for the farming system as whole. It could also be critical to understand what layers of the profile where most of those nitrates have been extracted from. Soil testing after harvest of these trials shows data on where the distribution of N is in the profile after a mungbean crop is harvested. The 2021 soil profile data (Figure 9) shows a distinctive trend across a selection of N treatments in both the irrigated and dryland trials. These soil tests are showing that the 0-10cm, 10-30cm and the 30-60cm layers have less than 5 kg of nitrate /ha in both the irrigated and dryland trials. This is compared to the 11 – 16 kg of nitrate/ha that existed at planting (Figure 1) plus the 30 – 60 kg N/ha that was applied in those respective treatments (CC30N, CC60N). This distribution reflects where the mungbean root system is most active in relation to nutrient uptake and this could be strongly related to water access. This could indicate that the more nitrate contained in the top 60cm of the soil profile, the less requirement it has for fixation.
Table 2. Comparison of mean profile nitrates recorded at planting of selected short fallow and long fallow treatments in the 2021 trial. Calculated figures for the amount of soil nitrate exported from these treatments.
Treatment category | Year | Nitrates at planting (kg/ha) | Nitrates exported (kg/ha) | |
|---|---|---|---|---|
Dryland | Irrigated | |||
Short fallow 0N | 2020 | 110 | 26 | 21 |
Short fallow 0N | 2021 | 77 | 31 | 25 |
Long fallow 0N | 2021 | 134 | 67 | 85 |
Long fallow 60N | 2021 | 196 | 75 | 90 |
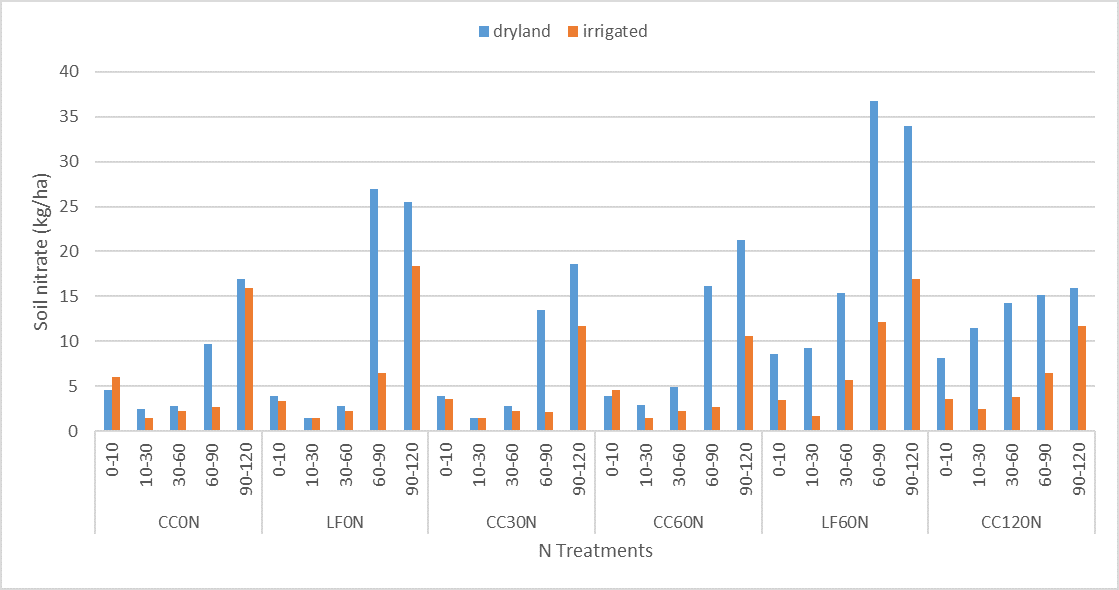
Figure 9. Distribution of mean nitrates across tested layers of the profile within selected N treatments in the 2021 trial site.
The irrigated treatments show much lower nitrate levels remaining after harvest in the 60-90cm layer than in the dryland trial indicating that the irrigation trials were more efficient at taking up nutrient from this layer. The ability of a mungbean crop to extract more water from deeper layers (potentially more nutrients) when supplementary irrigation is used is a characteristic that has been noted in previous time of sowing trials in Central Queensland. There is no clear explanation for this observation.
The soil profile data also shows that as the nitrate supply is increased (LF60N and CC120N), the proportion of soil nitrate remaining in the soil after harvest increases, particularly in the dryland trial. This could mean the higher level of N supply is surplus to the crops requirements and its yield is being restricted by other limitations such as soil water supply or weather factors.
Summary
It is clear from the data presented that pre-applying nitrogen to mungbean crops will not promote better yields unless soil profile levels are very low which may occur in a back-to-back double cropping scenario (not tested in this project) but not under normal broadacre conditions where a six-month fallow is common between crops.
It is also clear from the data that the rate of N fixation from the atmosphere is considerably influenced by the level of soil nitrates in the profile and particularly in the top 60cm of the profile. The Ndfa % can vary depending on natural mineralisation rates, with the 0N treatments across the four trials ranging from 20% to 55%, with higher Ndfa% occurring in the higher yielding crops.
The proportion of N that is exported off the paddock in grain can range from 60 – 90 % of total plant uptake. This means the ability of the mungbeans to contribute Ndfa to the soil profile is compromised and in most cases is reducing the level of soil nitrate in the system that will be available for the next crop. These field trials have shown that mineralisation rates prior to planting and changes in N harvest index are critical components that impact on the amount of fixed N which is returned in stubble.
The specific factors governing changes in the N harvest index are not clear from this work, however, on a broader scale there seems to be a seasonal influence. Natural mineralisation rates can also be quite variable from season to season which makes it hard to predict.
The main issue with mungbean being a net consumer of soil nitrates, is that it puts greater pressure on the organic matter fraction of the soil to continue to mineralise nitrates, if non-organic fertiliser is not used to meet the deficit. While mungbeans do not respond directly to N fertiliser rates, they can be a net consumer of the soil nitrate pool which in-turn can affect the long term N fertility status of the farming system. Growers will need to compensate N fertiliser rates for the following crop to cover for the potential N deficit created by the mungbean crop.
Acknowledgments
The research undertaken as part of this project (DAQ 1805-003RTX) is made possible by the significant contributions of growers through both trial cooperation and the support of the GRDC, the author would like to thank them for their continued support.
The author would also like to recognise the considerable technical officer support provided by Peter Agius and Penny Borger in the management and field data collection that was required for these trials.
Contact details
Douglas Sands
Department of Agriculture and Fisheries
99 Hospital Road, Emerald QLD 4720
M: 0457 546 993
E: douglas.sands@daf.qld.gov.au
GRDC Project Code: DAQ1805-003RTX,
Was this page helpful?
YOUR FEEDBACK

