Tracking the fate of deep P: how much ends up in the crop?
Tracking the fate of deep P: how much ends up in the crop?
Author: Megan Hunter (UQ), Michael Bell (UQ), Bede O’Mara (Incitec Pivot Fertilisers), Tim McLaren (UQ) | Date: 05 Mar 2024
Take home message
- Crop phosphorus (P) responses to fertiliser placement vary widely in Vertosols
- Deep P bands (15 – 30 cm depth) are utilised by crops and can result in higher yield relative to that of starter P alone at low soil P fertility
- Crop P uptake from deep P (20 cm depth) was 1.2 – 5.0 times greater than from starter P, resulting in an additional 2.6 – 3.5 kg fertiliser P ha-1 accumulating in the crop
- The proportion of crop P uptake derived from the fertiliser was 29 – 49 % for deep P and 7 – 23% for starter P
- Crop recovery of fertiliser P was typically low, i.e., up to 24 % of starter P and 10 % of deep P applied was recovered by the crop in the year of application
- In general, crop uptake of fertiliser P was increased with soil N fertility.
Background
Placement strategy of phosphorus (P) fertiliser can be an important factor for improving crop growth and crop P uptake in the northern grains region (NGR) of eastern Australia. Due to continual cropping of clay soils in the NGR, soil fertility has declined which has caused an increasing reliance on mineral fertilisers. Since mineral fertilisers are often added to the topsoil layer, which undergoes frequent drying, soil fertility is often declining in the subsoil layer. This is a problem because root activity is generally higher in the subsoil where there are increased stores of subsoil moisture (Bell et al., 2020). Deep placement of fertiliser P in clay soils has been an effective strategy to overcome crop P deficiency and improve crop production across the NGR.
There has been over a decade of research across southern and central Queensland (DAQ00148, UQ00063 & others) investigating crop responses to deep P, which typically involves the placement of P bands in the 10 – 30 cm soil layer. Substantial yield responses to deep P have been shown compared to the traditional strategy of applying starter P alone, with the benefit of deep P typically being additive to starter P (Bell et al., 2020). However, there are situations where crop responses to deep P were negligible, which may be due to differences in crop type, soil properties, and seasonal growing conditions (detailed in Lester et al., 2022). Furthermore, it is unclear whether deep P results in improved fertiliser P recovery, or more efficient utilisation of native soil P pools.
Using radioisotopes to track P fertiliser
The use of radioisotopes to label mineral fertilisers is a powerful method to track the fate of fertiliser P in the cropping system. In general, radioactive isotopes behave similarly to their stable isotope counterparts, but provide a ‘fingerprint’ or ‘tag’ which can be tracked in the system. All the P in nature exists as the stable P isotope, 31P. The radioactive isotopes of P, i.e., 32P and/or 33P, can be incorporated into a fertiliser source. Therefore, any of the radioactive isotope (e.g., 33P) detected in the crop must have come from the added radiolabelled fertiliser.
The use of radioactive isotopes is the gold standard for tracking the fate of fertiliser P in soil-plant systems. However, there are some limitations including: the half-life or decay of the radioactive isotope (32P half-life = 14.3 days and 33P half-life = 25.4 days), which prevents its use over multiple growing seasons, its high cost to purchase, and increased regulation. Consequently, studies in the field generally need to be carried out in microplots and need careful planning and approval.
The results outlined in this paper are from a single growing season under field conditions using 33P-labelled fertiliser added to microplots at the Colonsay long-term field experiment. It forms part of a PhD project assessing the effects of P placement strategy and soil fertility on crop utilisation of P fertiliser in Vertosols of the NGR.
Method
Experimental design
In 2023, a microplot experiment under field conditions was established at ‘Colonsay’, a long-term N x P experiment located in the Darling Downs region of south-east Queensland. The site is located on a black Vertosol (Isbell, 2016) and has been under cultivation since 1944. In 1985, it was established as an experimental site (Lester et al., 2008). Briefly, the overall experiment is 4 x 4 factorial design comprising main plots (14 x 2.5m) of four N application rates (0, 40, 80, 120 kg N ha-1) and four P application rates (0, 5, 10, 20 kg P ha-1). Agronomic management generally reflects regional farmer practice. This current microplot experiment utilised a subset of the overall long-term N and P treatments to which fresh, 33P-labelled MAP solution was applied using contrasting placement strategies (Table 1).
Table 1. Overview of experimental treatments including past N and P application rates and fresh P placement strategy.
Factor | Description |
|---|---|
Past N application | 1. 0N – no N applied 2. 80N – 80 kg N ha-1 applied as urea in shallow band pre-plant |
Past P application | 1. 0P – no P applied 2. 10P – 10 kg P ha-1 applied as triple superphosphate (TSP) in seeding trench at sowing |
Fresh P placement strategy | 1. Starter P – 33P-MAP applied equivalent to 10 kg P ha-1, placed 5 cm deep 2. Deep P – 33P-MAP applied equivalent to 40 kg P ha-1, placed 20 cm deep |
Soil analyses confirmed that the selected plots provided contrasting initial soil N and P fertility in (at least) the top 30 cm of the soil profile, particularly in the 0 – 10cm layer (Table 2).
Table 2. Soil P and N levels across past N and P application rates at ‘Colonsay’. Sampled June 2022.
Depth | Colwell P (mg P kg-1) | Nitrate-N (mg N kg-1) | ||||||
|---|---|---|---|---|---|---|---|---|
0P, 0N | 80N, 0P | 0N, 10P | 80N, 10P | 0P, 0N | 80N, 0P | 0N, 10P | 80N, 10P | |
0–10cm | 14.0 | 12.0 | 37.0 | 35.0 | 7.3 | 13 | 6.8 | 12 |
10–30cm | 6.0 | < 5 | 8.0 | 14.0 | 6.5 | 7.3 | 5.7 | 6.2 |
Applying 33P-labelled fertiliser to the field
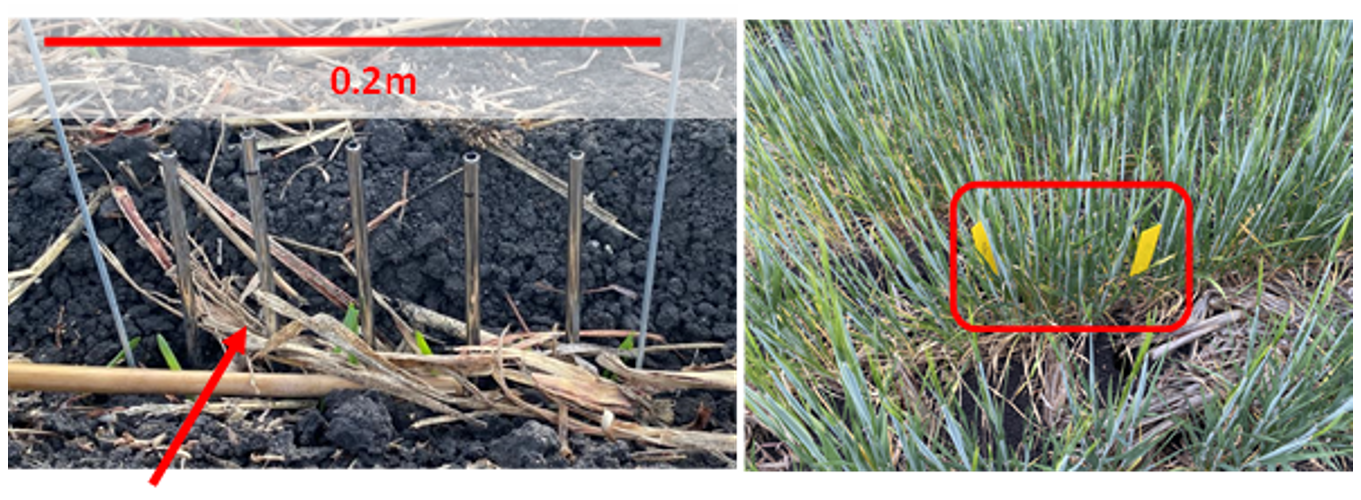
Barley (Hordeum vulgare L.) cv. AGT-Yeti was sown on 11 June 2023 at a planting rate of 100 plants/m2 with 0.32 m row spacing. Commercial-grade MAP was labelled with 33P and was applied in solution form 9 days after sowing (DAS). Briefly, a 0.2 m long microplot along a plant row was established within each pre-existing experimental plot. Microplots were placed in a central plot row where emergence was consistent, and not within 0.5 m of either end of the plot. A 5 mm diameter x 25 cm long metal tube with a removable metal insert was inserted into ground at depth, the metal insert removed, and then the 33P-labelled MAP solution injected into the tube (Figure 1). All microplots were hand-harvested at late-booting (76 DAS) to determine aboveground biomass, total P uptake and uptake of the P released from the 33P-labelled MAP solution.
Figure 1. Example of a microplot where the 33P-fertiliser was applied at 9 DAS (left) and at harvest (right).
33P-labelled MAP solution was applied as: starter P (eqv. to 10 kg P ha-1, 5cm deep);
or deep P (eqv. to 40 kg P ha-1, 20 cm deep) to each microplot.
Results
Seasonal growing conditions and overall crop performance
The 2023 winter growing season was very dry, experiencing decile 1 rainfall for the region. There was a total of 31 mm of rainfall over the season, approximately half of which fell on July 4 (25 DAS). Consequently, grain yields in the broader N x P experiment (i.e., the main plots, which were harvested at maturity) were considerably less than in wetter years, ranging 667 – 1700 kg ha-1, with the bulk of this difference attributed to N.
Biomass responses to contrasting P placement strategy
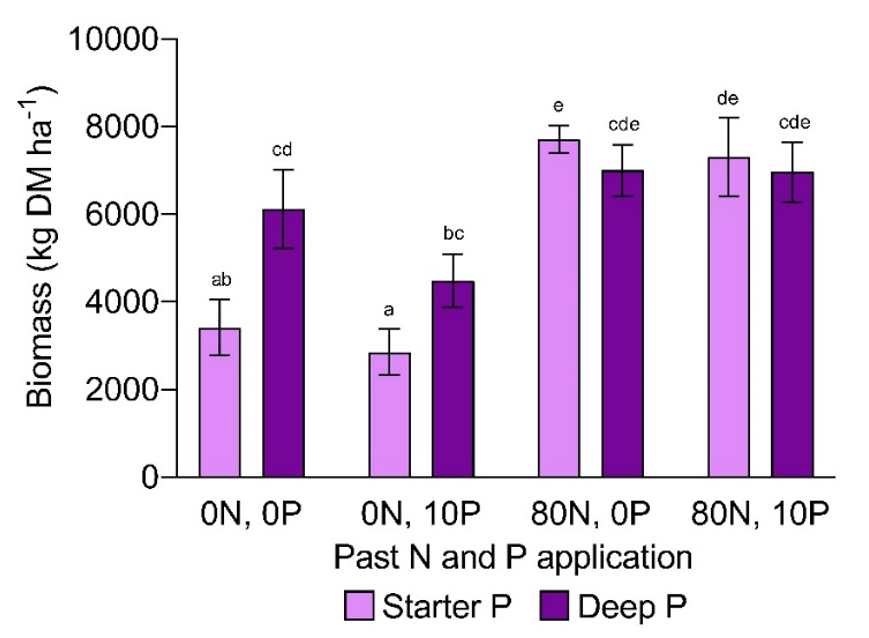
When initial soil N fertility was low, the application of deep P increased barley shoot biomass by 57 – 79 % compared to when starter P was applied to the 0P and 10P plots respectively (Figure 2). In contrast, barley shoot biomass at different P placement was similar under conditions of elevated soil N fertility. This suggests that the growth differences in the 0N treatment were largely an N response to the additional MAP applied with deep placement, consistent with the N responsiveness observed across the broader main-plot experiment. This N limitation was reduced in the 80N plots, where growth was likely limited by water, decreasing the potential for P responses in this season.
Figure 2. Barley aboveground biomass (kg DM ha-1) with contrasting P placement strategy, soil N and P fertility. Error bars represent SEM (n=3), and values do not differ at the 0.05 level if accompanied by a common letter.
How much P fertiliser ended up in the crop?
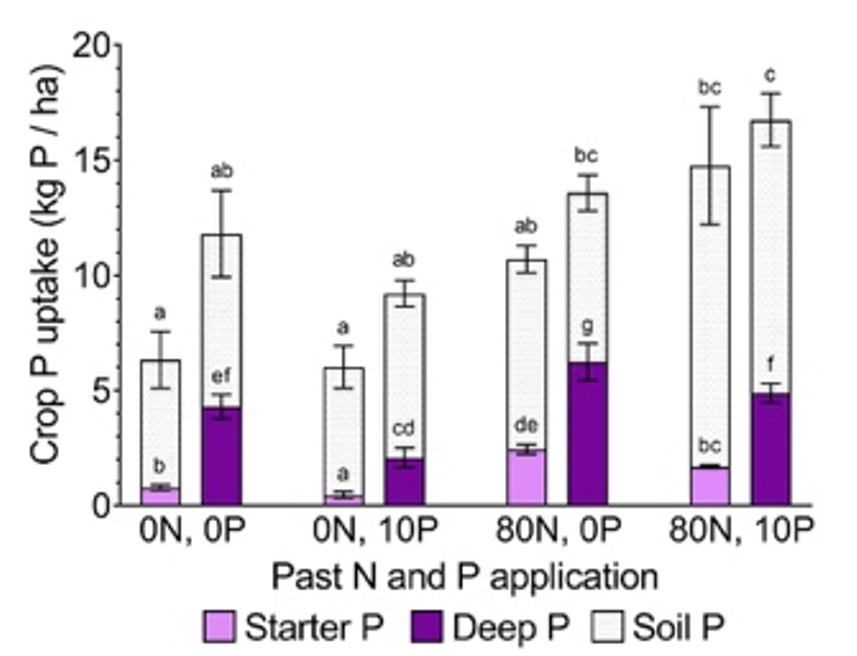
Phosphorus placement strategy had a clear effect on the amount of fertiliser P taken up by the crop. Deep P supplied 1.2 – 5.0 times more crop P than starter P, resulting in an additional 2.6 – 3.5 kg fertiliser P ha-1 accumulating in the crop (Figure 3). This also meant that a greater proportion of total crop P was derived from deep P (29 – 49 %) than starter P (7 – 23 %). Nevertheless, the soil remained the primary source of crop P (> 50 %).
Figure 3. Crop P uptake (kg P ha-1) from 33P-labelled MAP and the soil with contrasting P placement strategy, soil N and P fertility. Error bars represent SEM (n=3). Total crop P uptake does not differ at the 0.05 level if letters above a column are the same. Crop uptake of 33P-labelled fertiliser does not differ at the 0.05 level if letters within a column are the same.
The increase in crop P uptake from fertiliser placed at depth was accompanied by an increase in total crop P uptake. However, these differences were not statistically significant, likely influenced by dry seasonal conditions and considerable variability in crop P uptake. Nonetheless, the increase in fertiliser P uptake with deep placement demonstrates that it was a more effective strategy to get fertiliser P into the crop, providing greater potential to increase yield responses to P when seasonal conditions permit. This is consistent with previous field experiments where yield responses to (unlabelled) deep P are apparent (Lester et al., 2022).
Crop P uptake of fertiliser P was affected by initial soil fertility. Elevated soil N increased crop P uptake of fertiliser P, while increased soil P fertility decreased crop P uptake of fertiliser P, which was due to more P coming from the soil instead. However, dry seasonal conditions likely limited crop uptake of these soil nutrients which are concentrated in the 0 – 10 cm layer, potentially lessening their effect on the contribution of fertiliser P to crop P uptake.
How much P fertiliser was recovered by the crop?
Crop recovery of P from the radiolabelled fertiliser ranged 3 – 24 % (Table 3). Elevated soil N fertility increased crop recovery of fertiliser P, particularly when applied as starter P. Consequently, recovery of deep P was less than starter P in the 80N treatment. However, it is important to consider the overall objectives of deep P application when comparing the recoveries of deep P and starter P. Deep P will likely provide crop P across multiple growing seasons, meaning recovery in the year of application represents only a fraction of what will eventually accumulate in successive crops. While the ability to directly quantify the residual value of deep P using 33P-labelled fertiliser is limited by its short half-life, previous experiments have demonstrated yield responses to deep P at least 5 years following application (Sands et al., 2020). Nonetheless, crop P recovery in the year of application was generally low for both placement strategies, highlighting the need to investigate opportunities to further improve the efficiency of P fertiliser use.
Table 3. Recovery of 33P-labelled MAP (%) with contrasting placement strategy, soil N and P fertility. Values do not differ at the 0.05 level if followed by a common letter.
Past N and P application | Crop recovery of 33P-MAP (%) | |
|---|---|---|
Starter P | Deep P | |
0N, 0P | 8.0bc | 6.9abc |
0N, 10P | 4.6ab | 3.3a |
80N, 0P | 24.4e | 10.0cd |
80N, 10P | 17.0de | 7.8abc |
Summary
This experiment has demonstrated that P placement strategy can have a profound effect on how much fertiliser P ends up in the crop. Deep P was a relatively more important source of crop P compared to starter P, even across conditions of variable soil N and P fertility. While potential growth responses to deep P (and therefore economic benefits) were limited by a lack of rainfall in this dry season, these findings provide further evidence that applying deep P is an effective P management strategy in our northern cropping systems. Furthermore, elevated soil N fertility was found to increase crop recovery of fertiliser P, highlighting the importance of ensuring N supply is adequate to optimise P fertiliser use.
References
Bell MJ, Lester DW, and Sands D (2020) Nutritional strategies to supports productive farming systems. GRDC Update Papers.
Isbell RF (2016) The Australian soil classification. CSIRO Publishing, Clayton South, VIC, Australia.
Lester DW, Birch CJ, Dowling CW (2008) Fertiliser N and P applications on two Vertosols in north-eastern Australia. 1. Comparative grain yield responses for two different cultivation ages. Australian Journal of Agricultural Research 59, 247-259. doi: https://doi.org/10.1071/AR07169.
Lester DW, Sands D, Bell MJ (2022) Deep P and K – Outcomes from 8+ years of research: The good, the bad and the ugly. GRDC Update Papers.
Sands D, Bell MJ, Lester DW (2020) Fine tuning deep phosphorus and potassium management. GRDC Update Papers
Acknowledgements
The research undertaken as part of this project is made possible by the significant contributions of growers through both trial cooperation and the support of the GRDC, the authors would like to thank them for their continued support. We also acknowledge the financial support of the Australian government and The University of Queensland through the Australian Government Research Training Program scholarship.
Contact details
Megan Hunter
The University of Queensland
Gatton, QLD, 4343
Ph: 0429 539 012
Email: megan.hunter@uq.net.au
Date published
March 2024
Varieties displaying this symbol are protected under the Plant Breeders Rights Act 1994.
GRDC Project Code: UOQ2303-005RTX,


