Should waterlogged crops be topdressed with N fertiliser?
Author: Rob Harris, Roger Armstrong and Ash Wallace (Victorian Dept. Economic Development, Jobs, Transport & Resources) | Date: 24 Feb 2015
GRDC project code: DAV 00125
Keywords: nitrogen, fertiliser, waterlogging, wheat, canola, soil nitrate, soil carbon
Take home messages
- Topdressing N around first node of wheat growth improves crop N uptake compared with deep banding N at sowing.
- Synchronising N fertiliser application with peak crop N demand can reduce gaseous N losses from waterlogged soil.
- Soils with high organic carbon (>2.8%) can potentially supply large amounts of plant available N.
Background
As cropping systems have intensified there has been an increased reliance on nitrogen (N) fertiliser, now constituting the single largest variable cost for most grain growers. The challenge for growers is supplying the right amount of N at the right time and place to meet crop demand and optimise yield and quality, without over supplying N and reducing profit. Recent research has shown that high winter rainfall at Hamilton in the high rainfall zone (HRZ) of south west Victoria can lead to high rates of N lost as gas to the atmosphere (Harris et al. 2013). This makes it difficult to judge the appropriate rate of N fertiliser applied to waterlogged crops.
When oxygen supply diminishes under waterlogging, N can be lost to the atmosphere largely in the form of either nitrous oxide (N2O) or di-nitrogen (N2) gas. The form of N gas is influenced by soil water content; N2 tends to be lost from highly waterlogged soil, while N2O from less saturated soil. The rate of gaseous N loss is also driven by soil carbon (C) and soil nitrate (NO3-) supply, as well as soil temperature (Dalal et al. 2003).
Soils in south west Victoria, especially paddocks coming out of long-term grass-clover pasture can have high background levels of soil NO3- and organic C (3 to 5%), and experience prolonged periods of waterlogging. Despite high soil N supply, grain growers often apply high rates of N fertiliser to meet expected crop demand arising from high yield potentials (up to 10 t/ha). This paper summarises findings from recent field experiments seeking to better understand the relationship between crop demand and utilisation of both fertiliser and soil N in western Victoria, providing insights into N management in waterlogged crops.
Methodology
Replicated field experiments were undertaken at Hamilton, Taylors Lake, Tarrington and Westmere over the past three seasons to investigate the effects of rate and placement of N fertiliser on crop performance and N2O losses. At each site pre-sowing (100 cm depth) soil chemical properties were determined, and static chambers used to measure N2O losses, accompanied by crop yield, N uptake and grain quality to quantify differences between management. 15N enriched urea fertiliser was also applied to microplots at Hamilton, Taylors Lake and Tarrington to quantify the amount of synthetic N recovered by the crop, as well as N sourced from the soil. See Table 1 for site and crop management details.
Table 1. Site location, soil type, recent site history, sowing details and additional N management at Hamilton (raised beds), Taylors Lake, Tarrington and Westmere, in western Victoria.
AManagement in the previous year; BBasal fertiliser with the seed at sowing; DB fertiliser banded approximately C10 or D2.5 cm below the seed at sowing; TD topdressed; LTM long-term mean
| Soil type | HistoryA | Sowing date | Crop cultivar | Treatments | Fert. at sowB (kg /ha) |
Additional N | ||
|---|---|---|---|---|---|---|---|---|
| Appl. date |
Appl. method |
Urea N amount (kg N/ha) |
||||||
| Hamilton 2012 (LTM annual rainfall 685 mm) | ||||||||
| Brown Chromosol |
fallow |
31/5 |
wheat |
0N |
DSP 88 |
|||
|
25N |
DAP 83 |
10/9 |
TD |
10 |
||||
|
50N |
DAP 83 |
10/9 |
TD |
35 |
||||
|
100N |
DAP 83 |
10/9 |
TD |
85 |
||||
|
200N |
DAP 83 |
10/9 |
TD |
185 |
||||
|
Hamilton 2012 15N enrich Exp. |
||||||||
|
same as above |
DB100N@Z00C |
DSP 88 |
31/5 |
DB |
100 |
|||
|
TD100N@Z31 |
DSP 88 |
10/9 |
TD |
100 |
||||
|
Taylors Lake 2012 15N enrich Exp. (LTM annual rainfall 444 mm) |
||||||||
|
SodicVertosol |
wheat |
6/6 |
wheat cv. JNZ Clearfield |
DB50N@Z00D |
DSP 128 |
6/6 |
DB |
50 |
|
TD50N@Z30 |
DSP 128 |
3/9 |
TD |
50 |
||||
|
Tarrington 2013 (LTM annual rainfall 685 mm) |
||||||||
|
Brown |
canola |
9/5 |
wheat cv. Bolac |
0N |
DSP 88 |
|||
|
25N |
DAP 83 |
19/8 |
TD |
10 |
||||
|
50N |
DAP 83 |
19/8 |
TD |
35 |
||||
|
100N |
DAP 83 |
19/8 |
TD |
85 |
||||
|
200N |
DAP 83 |
19/8 |
TD |
185 |
||||
|
Tarrington 2013 15N enrich Exp. |
||||||||
|
same as above |
DB100N@Z00C |
DSP 88 |
9/5 |
DB |
100 |
|||
|
TD100N@Z31 |
DSP 88 |
19/8 |
TD |
100 |
||||
|
Taylors Lake 2013 15N enrich Exp. |
||||||||
|
Sodic |
wheat |
27/5 |
wheat cv. Grenade |
DB50N@Z00D |
DSP 128 |
27/5 |
DB |
50 |
|
TD50N@Z30 |
DSP 128 |
13/8 |
TD |
50 |
||||
|
Westmere 2013 (LTM annual rainfall 540 mm) |
||||||||
|
Grey |
wheat |
9/5 |
canola cv. Hyola 50 |
0N |
SSP 165 |
|||
|
25N |
SSP 165 |
6/8 |
TD |
25 |
||||
|
50N |
SSP 165 |
6/8 |
TD |
50 |
||||
|
100N |
SSP 165 |
6/8 |
TD |
100 |
||||
|
200N |
SSP 165 |
6/8 |
TD |
200 |
||||
|
Hamilton 2014 |
||||||||
|
Brown |
canola |
7/5 |
wheat cv. Bolac |
0N |
DSP 88 |
|||
|
25N |
DAP 83 |
18/7 |
TD |
10 |
||||
|
50N |
DAP 83 |
18/7 |
TD |
35 |
||||
|
100N |
DAP 83 |
18/7 |
TD |
85 |
||||
|
200N |
DAP 83 |
18/7 |
TD |
185 |
||||
AManagement in the previous year; BBasal fertiliser with the seed at sowing; DB fertiliser banded approximately C10 or D2.5 cm below the seed at sowing; TD topdressed; LTM long-term mean
Results and discussion
15 N fertiliser recovery and N2O losses
To determine the fate of applied fertiliser N, isotopic labelled (15N) urea was used at Hamilton, Tarrington and Taylors Lake to track the movement of N application over the growing season. At crop maturity the amount of 15N in the soil (0-40cm) and crop (grain and straw) was measured and the amount not recovered assumed to be lost to the atmosphere or deeper into the soil. 15N urea was either deep banded at sowing (Z00) or topdressed later in the season (end of tilling Z30 or first node Z31); at all sites topdressing N resulted in better recovery of applied N than deep banding, especially at Hamilton and Tarrington (Figure 1). The poor recovery of deep banded 15N urea at Hamilton and Tarrington compared with Taylors Lake was possibly due to higher winter rainfall and longer periods of winter waterlogging providing opportunity for gaseous or drainage losses before the crop had reached peak growth and demand for N in spring.
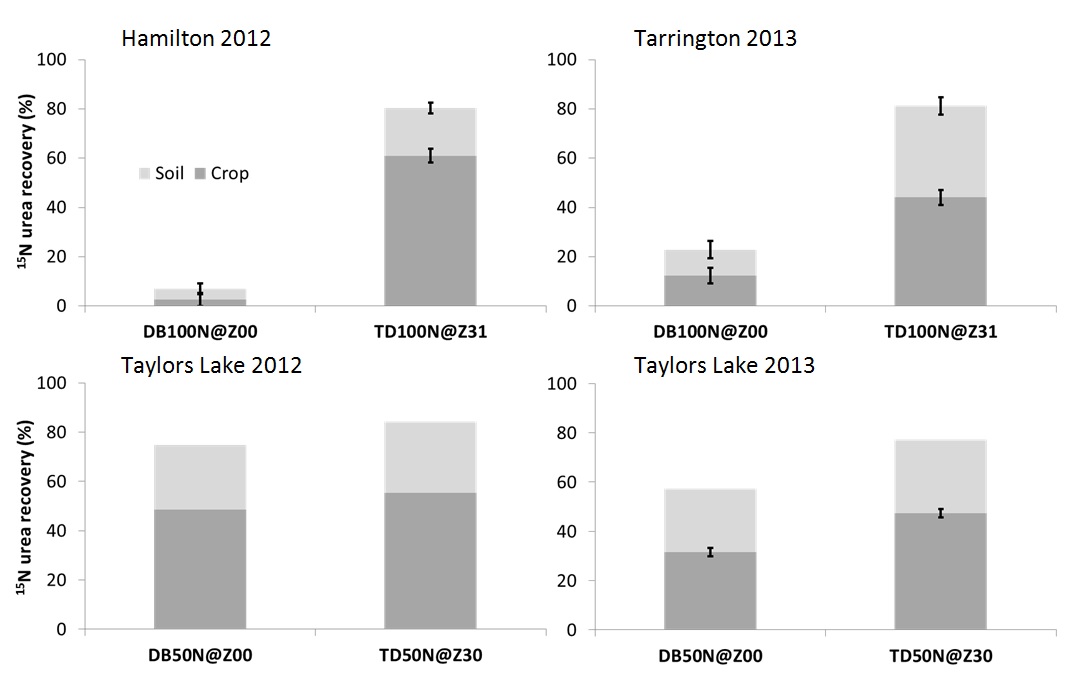
Figure 1. Percent recovery of 15N urea in the crop (grain and straw) and in the soil (0-40cm) where 50 (50N) or 100 (100N) kg N/ha was deep banded (DB) at sowing (Z00) or top-dressed (TD) at first node (Z31) or end of tilling (Z30) of wheat growth in western Victoria. Bars indicate LSD (P<0.05).
Total losses of N2O as a proportion of applied N fertiliser are often less than 1% in dryland cropping systems, but may be higher during prolonged waterlogging events, especially in acidic soils with high clay content subsoil restricting drainage. Static chambers were installed in plots adjacent to the 15N fertilised microplots at Hamilton and Tarrington to measure N2O losses. At all sites deep banding urea N at sowing resulted in higher N2O losses compared with topdressing later in the season, while losses from topdressing was only slightly higher than the 0N treatment at both sites (Figure 2).
N2O losses were higher at Hamilton compared with Tarrington possibly for two reasons: (1) greater concentrations of soil NO3- at the beginning of the growing season at Hamilton compared with Tarrington (an extra 199 kg NO3-/ha); and/or (2) raised beds at Hamilton prevented the soils from becoming wet enough to produce N2, instead producing more N2O, compared with the wetter Tarrington site that may have produced more N2 than N2O in the absence of raised beds.
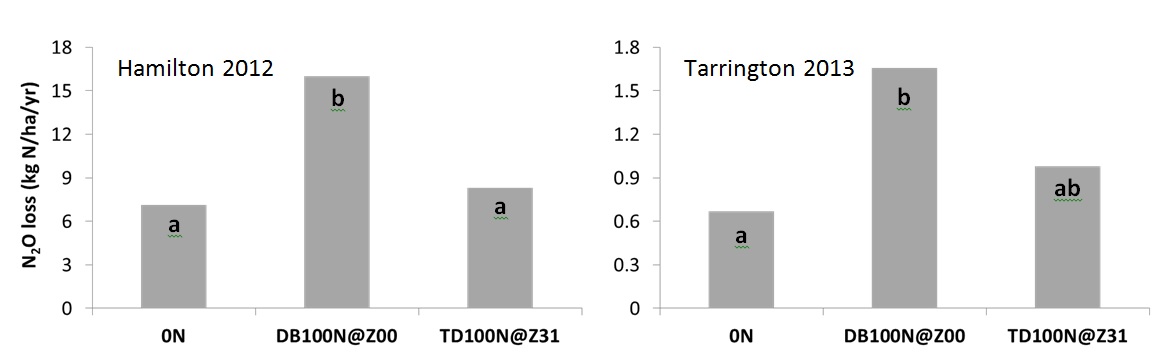
Figure 2. Cumulative N2O loss where either no urea N (0N) or 100 (100N) kg of urea N/ha was deep banded (DB) at sowing (Z00) or top-dressed (TD) at first node (Z31) of wheat growth in south west Victoria. Treatment means with the same letter are not significantly different; P<0.05 at Hamilton and P<0.10 at Tarrington.
Waterlogged crops responsiveness to urea N in the HRZ
Water use efficiency (WUE) in wheat growing at Hamilton in 2012, Tarrington in 2013 and Hamilton in 2014 were 16, 15 and 20 kg grain/mm of plant available water (PAW), respectively. The benchmark of 20 kg grain/mm of PAW suggested by French and Schultz (1984) was only achieved in 2014. Table 2 provides a summary of rainfall and starting soil chemical properties measured at each HRZ field experiment.
Table 2. Fallow (January to March), growing season (GSR), winter and spring rainfall, soil organic carbon (SOC) and soil profile mineral N (sum of NH4+ and NO3-) at Hamilton, Tarrington and Westmere in south west Victoria.
|
Exp. |
Year |
Rainfall (mm) |
SOC (0-10 cm) % |
Mineral N (0-100 cm) kg N/ha |
|||
|---|---|---|---|---|---|---|---|
|
Fallow |
GSR |
Winter |
Spring |
||||
|
Hamilton |
2012 |
90 |
530 |
285 |
143 |
3.1 |
396 |
|
Tarrington |
2013 |
42 |
547 |
258 |
198 |
3.9 |
215 |
|
Westmere |
2013 |
26 |
411 |
209 |
148 |
1.2 |
70 |
|
Hamilton |
2014 |
54 |
412 |
200 |
84 |
2.8 |
168 |
|
Long-term mean |
|||||||
|
Hamilton & Tarrington |
101 |
538 |
233 |
193 |
|||
|
Westmere |
94 |
407 |
157 |
159 |
|||
Topdressing urea N did not increase wheat yield (grain or biomass) at Hamilton and Tarrington, yield increases from the input of urea N was only observed in canola at Westmere during the 2013 season (Figure 3 and Table 2). Large amounts of urea N (above 50 kg N/ha) topdressed to wheat at Hamilton in 2012 actually resulted in a loss of grain yield and a decline in grain size and an associated increase in grain screenings (Table 3). This was possibly due to the preceding fallow causing large amounts of residual soil mineral N (Table 2) to accumulate before sowing Bolac wheat later (Table 1) than optimal for a mid to long seasoned cultivar, and subsequent below average spring rainfall (Table 2).
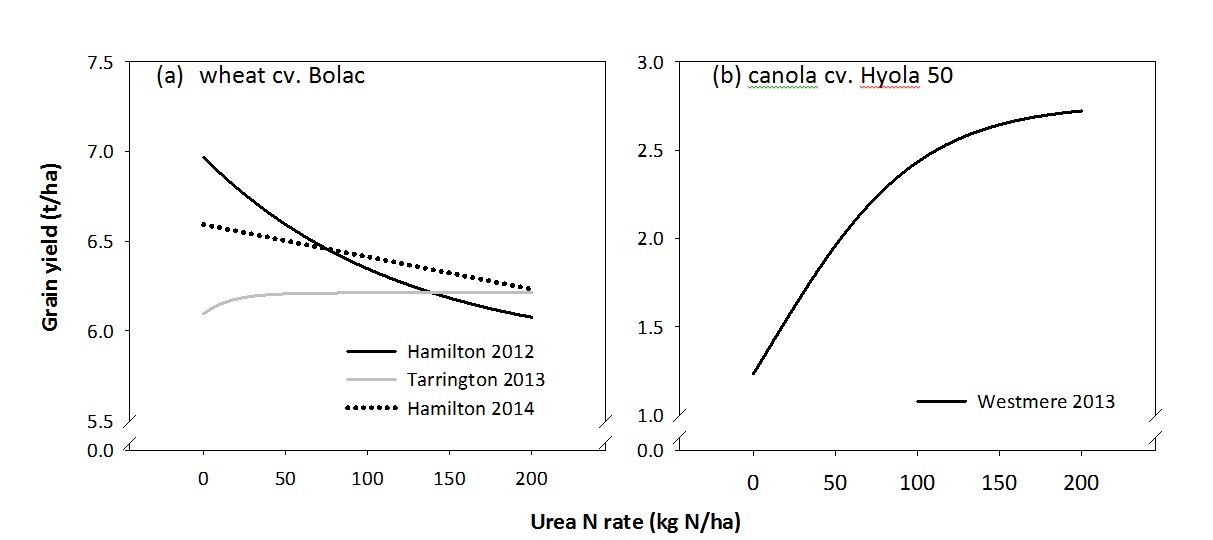
Figure 3. Grain yield curves in response to different rates of urea N applied to wheat at Hamilton and Tarrington (a) and canola at Westmere (b) in south west Victoria.
The absence of a yield response to urea N at Tarrington may have resulted from waterlogging in late winter causing root death (Paterson 2007), although urea N application at first node was expected to help the roots recover. Unfortunately the waterlogging prevented the timely application of fungicide, and subsequent Septoria tritici outbreaks damaged the flag leaf and possibly hindered the potential yield response from urea N applications.
At Westmere, below average summer rainfall, resulting in low levels of mineralisation over the summer period, in combination with the incorporation of previous wheat residue, probably contributed to the low concentrations of soil mineral N measured in the profile before seeding (Table 2). The low background soil N, accompanied by slightly above average growing season rainfall, appeared to provide conditions for large gains in canola yield from extra urea N applied at Westmere in 2013 (Figure 3 and Table 3).
The 2014 wheat crop at Hamilton experienced a drier than average winter and less severe waterlogging which may have allowed deeper root penetration and access to subsoil water in a season receiving well below average spring rainfall (Table 2). Furthermore, sowing and foliar fungicide applications were far better timed than previous seasons. Despite the better than expected yield in 2014, yield responses to urea N were not measured, possibly due to sufficient soil N supply to meet the water limited yield in a season receiving well below average rainfall (Table 2).
Table 3. The effect of N fertiliser rate on aboveground maturity biomass, crop N uptake, yield and grain quality at Hamilton, Tarrington and Westmere, in south west Victoria.
|
N rate |
Maturity biomass |
Crop N uptakeA |
Grain yield |
Grain protein |
1000 grain weight |
Grain screenings |
Oil content |
|---|---|---|---|---|---|---|---|
|
kg N/ha |
t DM/ha |
kg N/ha |
t/ha |
% |
g |
% |
% |
|
Hamilton 2012 |
|||||||
|
0N |
16.6 |
194 |
6.9 |
11.2 |
34.0 |
6.8 |
|
|
25N |
16.5 |
218 |
7.0 |
11.3 |
31.5 |
7.4 |
|
|
50N |
16.4 |
223 |
6.5 |
12.1 |
29.3 |
8.9 |
|
|
100N |
16.1 |
239 |
6.3 |
13.1 |
30.6 |
10.1 |
|
|
200N |
16.1 |
260 |
6.1 |
13.8 |
27.4 |
11.8 |
|
|
LSD (P<0.05) |
ns |
21 |
0.6 |
0.6 |
3.1 |
1.8 |
|
|
Tarrington 2013 |
|||||||
|
0N |
10.8 |
139 |
6.1 |
11.2 |
36.7 |
2.0 |
|
|
25N |
11.1 |
146 |
6.1 |
10.9 |
35.3 |
1.7 |
|
|
50N |
11.5 |
153 |
6.3 |
11.3 |
37.0 |
1.8 |
|
|
100N |
11.5 |
176 |
6.2 |
12.1 |
34.5 |
2.0 |
|
|
200N |
11.2 |
194 |
6.2 |
13.3 |
32.6 |
2.6 |
|
|
LSD (P<0.05) |
ns |
20 |
ns |
0.8 |
3.0 |
0.4 |
|
|
Westmere 2013 |
|||||||
|
0N |
4.6 |
50 |
1.3 |
16.1 |
4.3 |
49.2 |
|
|
25N |
7.2 |
64 |
1.6 |
15.9 |
3.8 |
49.5 |
|
|
50N |
8.5 |
85 |
1.8 |
16.1 |
4.7 |
50.2 |
|
|
100N |
11.9 |
110 |
2.6 |
16.0 |
4.8 |
49.1 |
|
|
200N |
11.2 |
147 |
2.7 |
17.7 |
3.9 |
48.0 |
|
|
LSD (P<0.05) |
3.7 |
30 |
0.5 |
0.7 |
ns |
0.8 |
|
|
Hamilton 2014 |
|||||||
|
0N |
15.0 |
127 |
6.4 |
9.2 |
37.2 |
1.8 |
|
|
25N |
15.8 |
143 |
6.6 |
9.4 |
35.6 |
2.5 |
|
|
50N |
15.9 |
145 |
6.5 |
10.2 |
35.6 |
2.6 |
|
|
100N |
15.1 |
153 |
6.6 |
11.0 |
34.9 |
2.9 |
|
|
200N |
15.0 |
173 |
6.1 |
12.6 |
34.0 |
4.5 |
|
|
LSD (P<0.05) |
ns |
17 |
ns |
0.8 |
2.0 |
1.1 |
|
Astraw and grain; ns not significant
Although in-crop N mineralisation was not measured in our studies, applying the model of Baldock (2003) highlights the potential for greater mineralisation and N supply from soils at Hamilton and Tarrington where surface organic C was much higher than Westmere (Table 4). The literature suggests that the proportion of mineralised N can vary from 3 to 5%, and so Table 4 provides a range of potential mineralisation amounts for each site. In addition, the 15N microplot study at Tarrington provided field evidence that soils with high organic C can supply significant quantities of N for crop uptake. Despite the poor recovery where 15N was deep banded at sowing (DB100N@Z00) compared with topdressing (TD100N@Z31), both treatments achieved the same grain yield, because the deep banded treatment compensated for low fertiliser uptake by sourcing more N from the soil (Figure 4). Further research seeking to quantify when and how much N mineralisation takes place in high organic matter soils could improve N management in waterlogged crops.
Table 4. Soil organic carbon (SOC), total soil nitrogen (TSN), carbon to nitrogen (C:N) ratio and bulk density (BD) at Hamilton, Tarrington and Westmere in south west Victoria; used to estimate in-crop N mineralisation* amounts at different proportions of mineralised N (3, 4 and 5%).
|
Exp. |
Year |
SOC (0-10cm) % |
TSN (0-10cm) % |
C:N ratio |
BD g/cm3 |
Est. in-crop N mineralisation |
||
|---|---|---|---|---|---|---|---|---|
|
3% |
4% |
5% |
||||||
|
kg N/ha |
||||||||
|
Hamilton |
2012 |
3.1 |
0.32 |
10 |
1.06 |
99 |
131 |
164 |
|
Tarrington |
2013 |
3.9 |
0.32 |
12 |
1.2 |
117 |
156 |
195 |
|
Westmere |
2013 |
1.5 |
0.15 |
10 |
1.2 |
54 |
72 |
90 |
|
Hamilton |
2014 |
2.8 |
0.28 |
10 |
1.2 |
101 |
38 |
168 |
*In-crop N mineralisation = (proportion of mineralised N%/100) x SOC% x 1/C:N x BD x 10000 = kg N/ha (Baldock 2003)
While positive yield responses to topdressing urea N were restricted to canola growing at Westmere, at all sites topdressing resulted in incremental increases in crop N uptake in response to increasing rates of urea N (Table 3). At Tarrington and Hamilton in 2014, the additional crop N uptake was actually beneficial for grain protein concentrations without compromising grain screenings (Table 3).
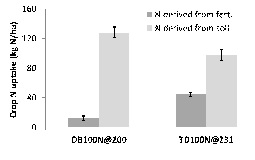
Figure 4. The quantity of 15N urea fertiliser recovered by the crop and the amount of N sourced from the soil where 100 kg N/ha was either deep banded (DB) at sowing (Z00) or topdressed (TD) at first node (Z31) of wheat growth during the 2013 season at Tarrington in south west Victoria. Bars indicate LSD (P<0.05).
Conclusion
- Topdressing 15N urea fertiliser around first node improved crop N fertiliser uptake compared with deep banding 15N at sowing, especially in the high rainfall zone around Hamilton.
- Topdressing urea N around first node of wheat growth reduced N2O losses compared with deep banding urea at sowing.
- Applying high amounts of urea N to soil with large background concentrations (396 kg N/ha) of soil profile mineral N can be detrimental to grain yield, grain size and grain screenings.
- In-crop N mineralisation rates are likely to be lower in soils with low organic C, and crops growing in these soils more likely to be yield responsive to urea N.
- Grain protein rather than yield responses have been observed where urea N was topdressed at first node to waterlogged wheat growing in soils with high background levels of mineral N and organic C.
References
Baldock J (2003) Match fertiliser rates with available water. Farming Ahead 140, 40-43.
Dalal RC, Weijin W, Robertson GP, Parton WJ (2003). Nitrous oxide emission from Australian agricultural lands and mitigation options: a review. Australian Journal of Soil Research 41, 165-195.
French RJ, Schultz JE (1984) Water use efficiency of wheat in a Mediterranean-type environment I. The relationship between yield, water use and climate. Australian Journal of Agricultural Research 35, 743-764.
Harris RH, Officer SJ, Hill PA, Armstrong RD, Fogarty KM, Zollinger RP, Phelan AJ, Partington DL (2013) Can nitrogen fertiliser and nitrification inhibitor management influence N2O losses from high rainfall cropping systems in South Eastern Australia? Nutrient Cycling in Agroecosystems 95, 269–285.
Paterson J (2007) Unravelling the roots of waterlogged wheat. Farming Ahead 180, 44-45.
Acknowledgements
We thank the federal Dept. of Agriculture, the Grains Research and Development Corporation and the Victorian State Government for funding.
Contact details
Rob Harris
Victorian Dept. Economic Development, Jobs, Transport and Resources
PO Box 105, Hamilton Vic, 3300
03 5573 0963
0409 965 865
rob.harris@ecodev.vic.gov.au
GRDC Project Code: DAV00125,
Was this page helpful?
YOUR FEEDBACK