Using crop competition for weed control in barley and wheat
Author: Simon Goss, Rob Wheeler | Date: 10 Feb 2015
Simon Goss, Rob Wheeler, SARDI, Waite Campus.
GRDC project code: DAN00173
Keywords: weed competition, barley varieties, wheat varieties, seeding rates
Take home messages
- Varieties differ in their ability to compete with weeds;
- New durum variety DBA Aurora shows similar weed competitiveness to Mace wheat; and
- Weed competitive varieties are a useful weed management tool.
Background
With heavy reliance on chemicals in today’s farming systems, resistance is becoming a serious and complicated issue. While chemicals still control the majority of weeds in crop, other strategies need to be used to reduce the amount of the weeds which escape chemical treatment and reach seed set. Funded by the GRDC and SAGIT, varietal differences in weed competitiveness and techniques such as seeding rate, seed size, seed bed utilisation and row spacing are currently being examined.
Sowing dates are moving earlier and many growers are sowing dry in mid-late April. Chemicals can be less effective during this time due to fewer weeds being able to be killed with a knockdown, which leads to more pressure on control using pre and post emergent chemicals. A crop with good early vigor and ability to establish before the weeds, and shade out the canopy especially in dry sowing conditions, should increase yield and also play an important role in integrated weed management systems. Varieties differ in their growing patterns with some having erect leaves, low early vigor and fewer tillers, which allow more light into the canopy. Others have more tillers, high early vigor and larger leaf area which allow less light into the canopy. A restricted amount of light allowed into the canopy should result in less light being available for weeds to photosynthesise.
As varieties differ in growing patterns this work has been completed to determine which varieties perform better under high weed pressure situations to see if their yield is affected as well as their ability to restrict weed seed set.
Variety trials are often conducted under weed free conditions but elite performers in these situations may not be the case where high weed pressure occurs. These trials will hopefully provide another tool for selecting varieties to use as another form of weed control in problem paddocks.
Crop and grass response to seed rate and seeding method
Durum wheat has typically been a poor performer in terms of competitiveness with many farmers turned away due to this, as well as other issues. Over the past three years, research by the Southern Australian Durum Growers Association, with funding from SAGIT and corporate sponsors, has investigated the best management system for tackling weed issues in durum crops. A trial was conducted in 2014 through the Hart Field Day Group at their site which was aimed at comparing DBA Aurora to Mace wheat to see what management packages worked best and how the two crop types faired against each other. This was conducted by firstly spreading rye grass over the site at a rate of 10 kg/ha. Selected plots were then treated with a pre-emergent herbicide, to create plots which were under varying weed pressure. Several different treatments were applied to test the effect of seeding rates and normal and spreader seeding boots.
Table 1. The effect of seed rate and normal and spreader seeding boots on grain yield, t/ha, and grass seed set, heads/m2, when sown to DBA-Aurora durum wheat and Mace wheat at Hart, SA in 2014. Yield loss percentage is the difference between plots with high weed pressure compared to no weed pressure.
|
Variety |
Seeding boot |
Seeding Rate |
Yield Loss % |
Rye Grass heads/m² |
Yield t/ha |
|---|---|---|---|---|---|
|
DBA Aurora |
Normal Boots |
100 |
9.26 |
138 |
2.29 |
|
DBA Aurora |
Normal Boots |
200 |
12.16 |
90 |
2.44 |
|
DBA Aurora |
Normal Boots |
300 |
8.17 |
29 |
2.95 |
|
Mace |
Normal Boots |
100 |
9.61 |
100 |
3.02 |
|
Mace |
Normal Boots |
200 |
11.52 |
79 |
3.52 |
|
Mace |
Normal Boots |
300 |
3.94 |
52 |
3.75 |
|
DBA Aurora |
Spreader Boots |
100 |
18.34 |
104 |
2.41 |
|
DBA Aurora |
Spreader Boots |
200 |
10.80 |
67 |
2.75 |
|
DBA Aurora |
Spreader Boots |
300 |
9.16 |
54 |
3.02 |
|
Mace |
Spreader Boots |
100 |
8.26 |
138 |
3.19 |
|
Mace |
Spreader Boots |
200 |
8.72 |
90 |
3.75 |
|
Mace |
Spreader Boots |
300 |
7.27 |
29 |
3.83 |
|
|
LSD |
2.59 |
30 |
0.27 |
|
From a statistical analysis at a 95 per cent confidence interval the following findings were made. Please note that this trial has only been completed once in 2014 at 1 site.
Key findings
- In Mace wheat and DBA Aurora durum, increasing the seeding rate reduced rye grass head set;
- DBA Aurora and Mace were similar in ability to reduce ryegrass seed set;
- Mace had less yield loss than DBA Aurora when under high weed pressure;
- Varying seeding rates can change the amount of crop yield loss under high weed pressure; and
- No significant difference was found between normal and spreader seeder boots.
Barley varietal response to weed competition
A series of barley variety trials testing both varietal ability to tolerate weed competition through reduced yield loss and ability to suppress weed growth were conducted at Turretfield Research Centre in the years 2012-2014. These were completed by spreading oats over the plot before sowing a range of barley varieties. The oats were harvested with the barley and a sub-sample taken to determine the proportion of oats and barley yield.
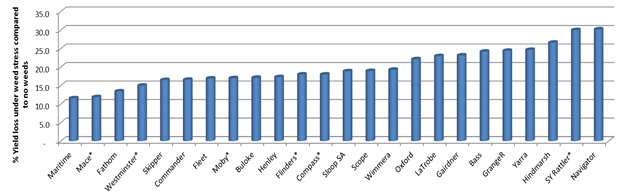
Figure 1. Barley variety and Mace wheat grain yield loss (expressed as percentage of trial average yield) when oats is under sown as a weed at 75 plants/m2, Turretfield Research Centre, 2013- 2014. LSD = 8.6, *only tested in 1 year.
The results of this trial show that losses between 10 per cent and 25 per cent were measured when barley varieties were grown under simulated weed pressure. Varieties which show the highest losses were those which are either later maturing such as Navigator and Oxford, have slower early growth rates such as Yarra, and others such as La Trobe and Hindmarsh which are erect plant types. Varieties such as Fathom and Maritime show less yield loss, possibly because of greater biomass production and higher growth rates and tiller production.
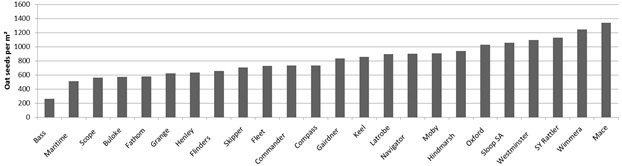
Figure 2. The effect of barley variety on oat seed yield, seed/m2, when oats are under sown as a weed at 75 plants/m2, Turretfield Research Centre, 2014. LSD = 598.
The varietal ranking in Figure 2 appears correlated to rankings in Figure 1, as many varieties which showed less yield penalty under weed pressure also managed to suppress the oat seed set. With farmers spending thousands of dollars each year on premergent chemcials, choosing varieties which can reduce weed seed set by 30 per cent over another should be considered when planning a weed management system.
Wheat varietal response to weed competition
Similar trials to barley mentioned above have been conducted on a range of different wheat varieties. These trials were also conducted with GRDC funding. Wheat is typically the weak link in weed management in cropping systems in South Australia. Herbicide resistant weeds are becoming widespread which require wheat with better weed competitive ability to reduce weed seed banks. This trial was conducted under the same protocol as the barley weed competition studies above.
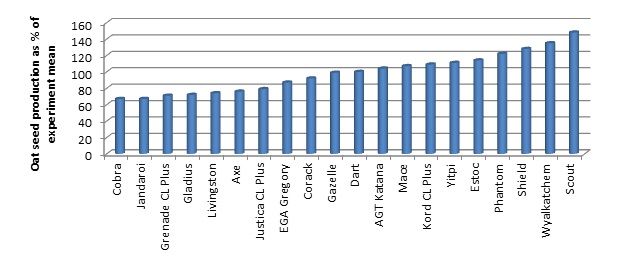
Figure 3. The effect of wheat variety on oat seed yield (as percentage experimental mean yield) when oats is under sown as a weed at 75 plants/m2, Turretfield Research Centre and Palmer, 2013.
Please note that at time of article publication 2014 trial results were not available and results in Figures 3 and 4 are only representative of two trials conducted in 2013. Additional data is required for more accurate interpretation of results.
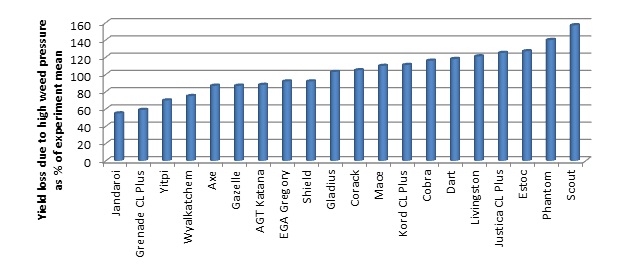
Figure 4. Wheat variety grain yield loss (percentage of trial average yield) when oats is under sown as a weed at 75 plants/m2, Turretfield Research Centre and Palmer, 2013. LSD = 61.
The mean yield data from trials conducted in 2013 at Palmer and Turretfield Research Centre are presented in Figures 3 and 4. Results from each site showed some variability in oat seed production and effect on crop yield and have been revalidated in 2014. The 2013 results shown above may be explained by the harsh finish to the season at each location which affected both crop yields and oat seed set. Oat seed set was reduced to low numbers and this limited the range between the top and poor wheat cultivars making it difficult to distinguish differences between varieties. At the time of preparation of this paper, results from similar trials conducted in 2014 were unavailable.
Conclusion
Selecting the correct variety for a specific paddock can provide substantial yield improvements. If a stand out variety in NVT results is found, growers and advisors should check its performance under weed pressure to make sure it is suited to the growing conditions.
Competitive varieties are an integral part of integrated weed management systems and should be considered when planning for weed control. Increasing seeding rates improves yield by out competing with weeds and reduce the amount of weeds that set seed.
Some data from the trials conducted was not available at time of print and will be presented at the 2015 GRDC Update in Adelaide.
Contact details
Simon Goss
SARDI Waite Campus
0408 464 795
simon.goss@sa.gov.au
GRDC Project Code: DAN00173,
Was this page helpful?
YOUR FEEDBACK