Can high performance surface irrigation reduce nitrogen losses in broadacre cropping systems?
Author: Wendy Quayle and Hizbullah Jamali (CSIRO Agriculture Flagship, Griffith) | Date: 12 Mar 2015
Take home messages
Applying irrigation with smaller application depths (30-60 mm), more frequently was found to:
- Reduce N2O emissions
- reduce leaching losses of nitrogen and water
- improve plant N uptake.
These observations however, require evaluation and development at field scale in high performance broadacre surface irrigation systems (e.g. terraced systems or level furrows).
Smaller, more frequent irrigation applications in combination with the nitrification inhibitor, 3,4-dimethylpyrazol phosphate (DMPP), offers enhanced opportunity for reducing nitrogen losses.
Introduction
This paper reports results from some recent findings from a National Agricultural Nitrous Oxide Reduction Programme (NANORP) project, funded by the Federal Department of Agriculture and administered by GRDC. Using automated greenhouse gas chambers fitted to soil monoliths in a large weighing lysimeter facility, water and nitrogen losses in the form of nitrous oxide emissions to the atmosphere and through deep drainage have been measured during manipulation of the irrigation schedule.
The crops used were sorghum as an example irrigated summer crop, followed by wheat in the presence of a nitrification inhibitor (DMPP, e.g. Entec®). The project assessed N losses through denitrification in the form of nitrous oxide (N2O), and as mineral N in leachates, and the amount of N taken up by plants across a range of irrigation application volumes. Total seasonal water application was kept constant. The crops were grown in 2014 in large intact soil monoliths comprising transitional red-brown earths, locally known as Willbriggie clay-loam type soils from the Murrumbidgee Valley.
Irrigation Layout Design
In the irrigated regions of southern NSW, recent innovation in surface irrigation design layout in the form of drain back level basins and level furrow systems, are allowing labour savings, ease of automation, a higher degree of water depth control, uniformity and irrigation efficiency and in some cases more efficient machinery practises and flexibility to grow a very wide range of crops. High water supply flow rates (30 ML/day), that are available to irrigators in the Murrumbidgee Valley have resulted in a rapid increase in the numbers of systems comprised of series of benched level basins (terraces) with side ditches that have automatic gates that allow individual bays to be filled and drained independently (Ground-Cover-Issue-106-Sept-Oct-2013). Other high efficiency systems, known as level furrow systems, potentially allow a wide range of crops (including rice) to be grown on beds within one irrigation system (pers. comm Sam North, NSW DPI and Flannagan’s, Benerembah). In the Murray Valley, where there are more constraints on maximum flow rates and there is less on-farm storage, overhead sprinkler systems may provide an alternative method of application for a high degree of control since it has been demonstrated that higher flow rates can lead to irrigation efficiency increases of 20% (Smith, 2013).
The new surface layouts are more automated than ever before and enable lower volume, more frequent irrigations to be applied at scale, without excessive labour costs. To date, the greater degree of irrigation control has primarily been driven from the aspect of improving plant water supply, potentially enabling farmers to supply crops with water as plants demand it, more accurately, more efficiently and with greater uniformity. However, equally as important is the degree to which the improvements in water scheduling can also allow accurate nutrient scheduling. Development of nutrient management methods are now necessary to better suit the new layouts, crop types, varieties, cropping systems and soils that are being used (Stott, 2013). The factors that drive nitrification and denitrification, the processes that control N losses to the atmosphere and leachate losses in irrigated soils, are primarily governed by soil moisture through the fundamental parameter; redox potential (the amount of electrons in the soil available to reduce soil nitrate or other soil chemical species). Therefore, developing reliable relationships between irrigation application, soil moisture and nitrogen uptake and losses from fertiliser application is critical to optimising the right amount of nitrogen so that it is available for plant growth at the right time.
Methods
CSIRO lysimeter facility
The experimentation was conducted at the CSIRO lysimeter facility at the Griffith Laboratory. The facility can house up to 32 intact soil monoliths (0.7 m diameter x 1.2 m height). Sixteen of the monoliths are located upon load cells that continuously measure evapotranspiration through mass loss. Twelve of these monoliths have been fitted with automated greenhouse gas chambers linked to a gas chromatograph and infra-red detection for N2O, CH4 and CO2 emission measurement. Intact soil cores were collected in 6mm thick mild steel casings with a cutting edge welded at the bottom. A pneumatic hammer and a crane were used to push the casings into the soil (Figure 1). The soil cores were then pulled out through an excavated side trench with a crane. A perforated polyvinyl chloride (PVC) manifold was attached to the bottom of the core with an outlet for collecting leachates. The space around the PVC manifold was filled with fine sand and the core was sealed by welding a steel plate to the bottom of the core.
Soil cores were collected from Willbriggie, about 20km south of Griffith, New South Wales, Australia in November, 2013. The soil type is classified as a Chromosol (Isbell, 2002), used in irrigated broad acre cropping in the Murrumbidgee Valley.
For soil characterisation, ten cores of smaller diameter (10cm diameter x 1.2m depth) were also collected using a hydraulic corer. Five of the smaller cores were used for determining the bulk density (BD) while the remaining five were bulked and analysed for soil texture (hydrometer method), total carbon (TC), organic carbon (TOC), total nitrogen (TN), mineral nitrogen (MN) and pH. Soil physical and chemical properties are shown in Table 1.
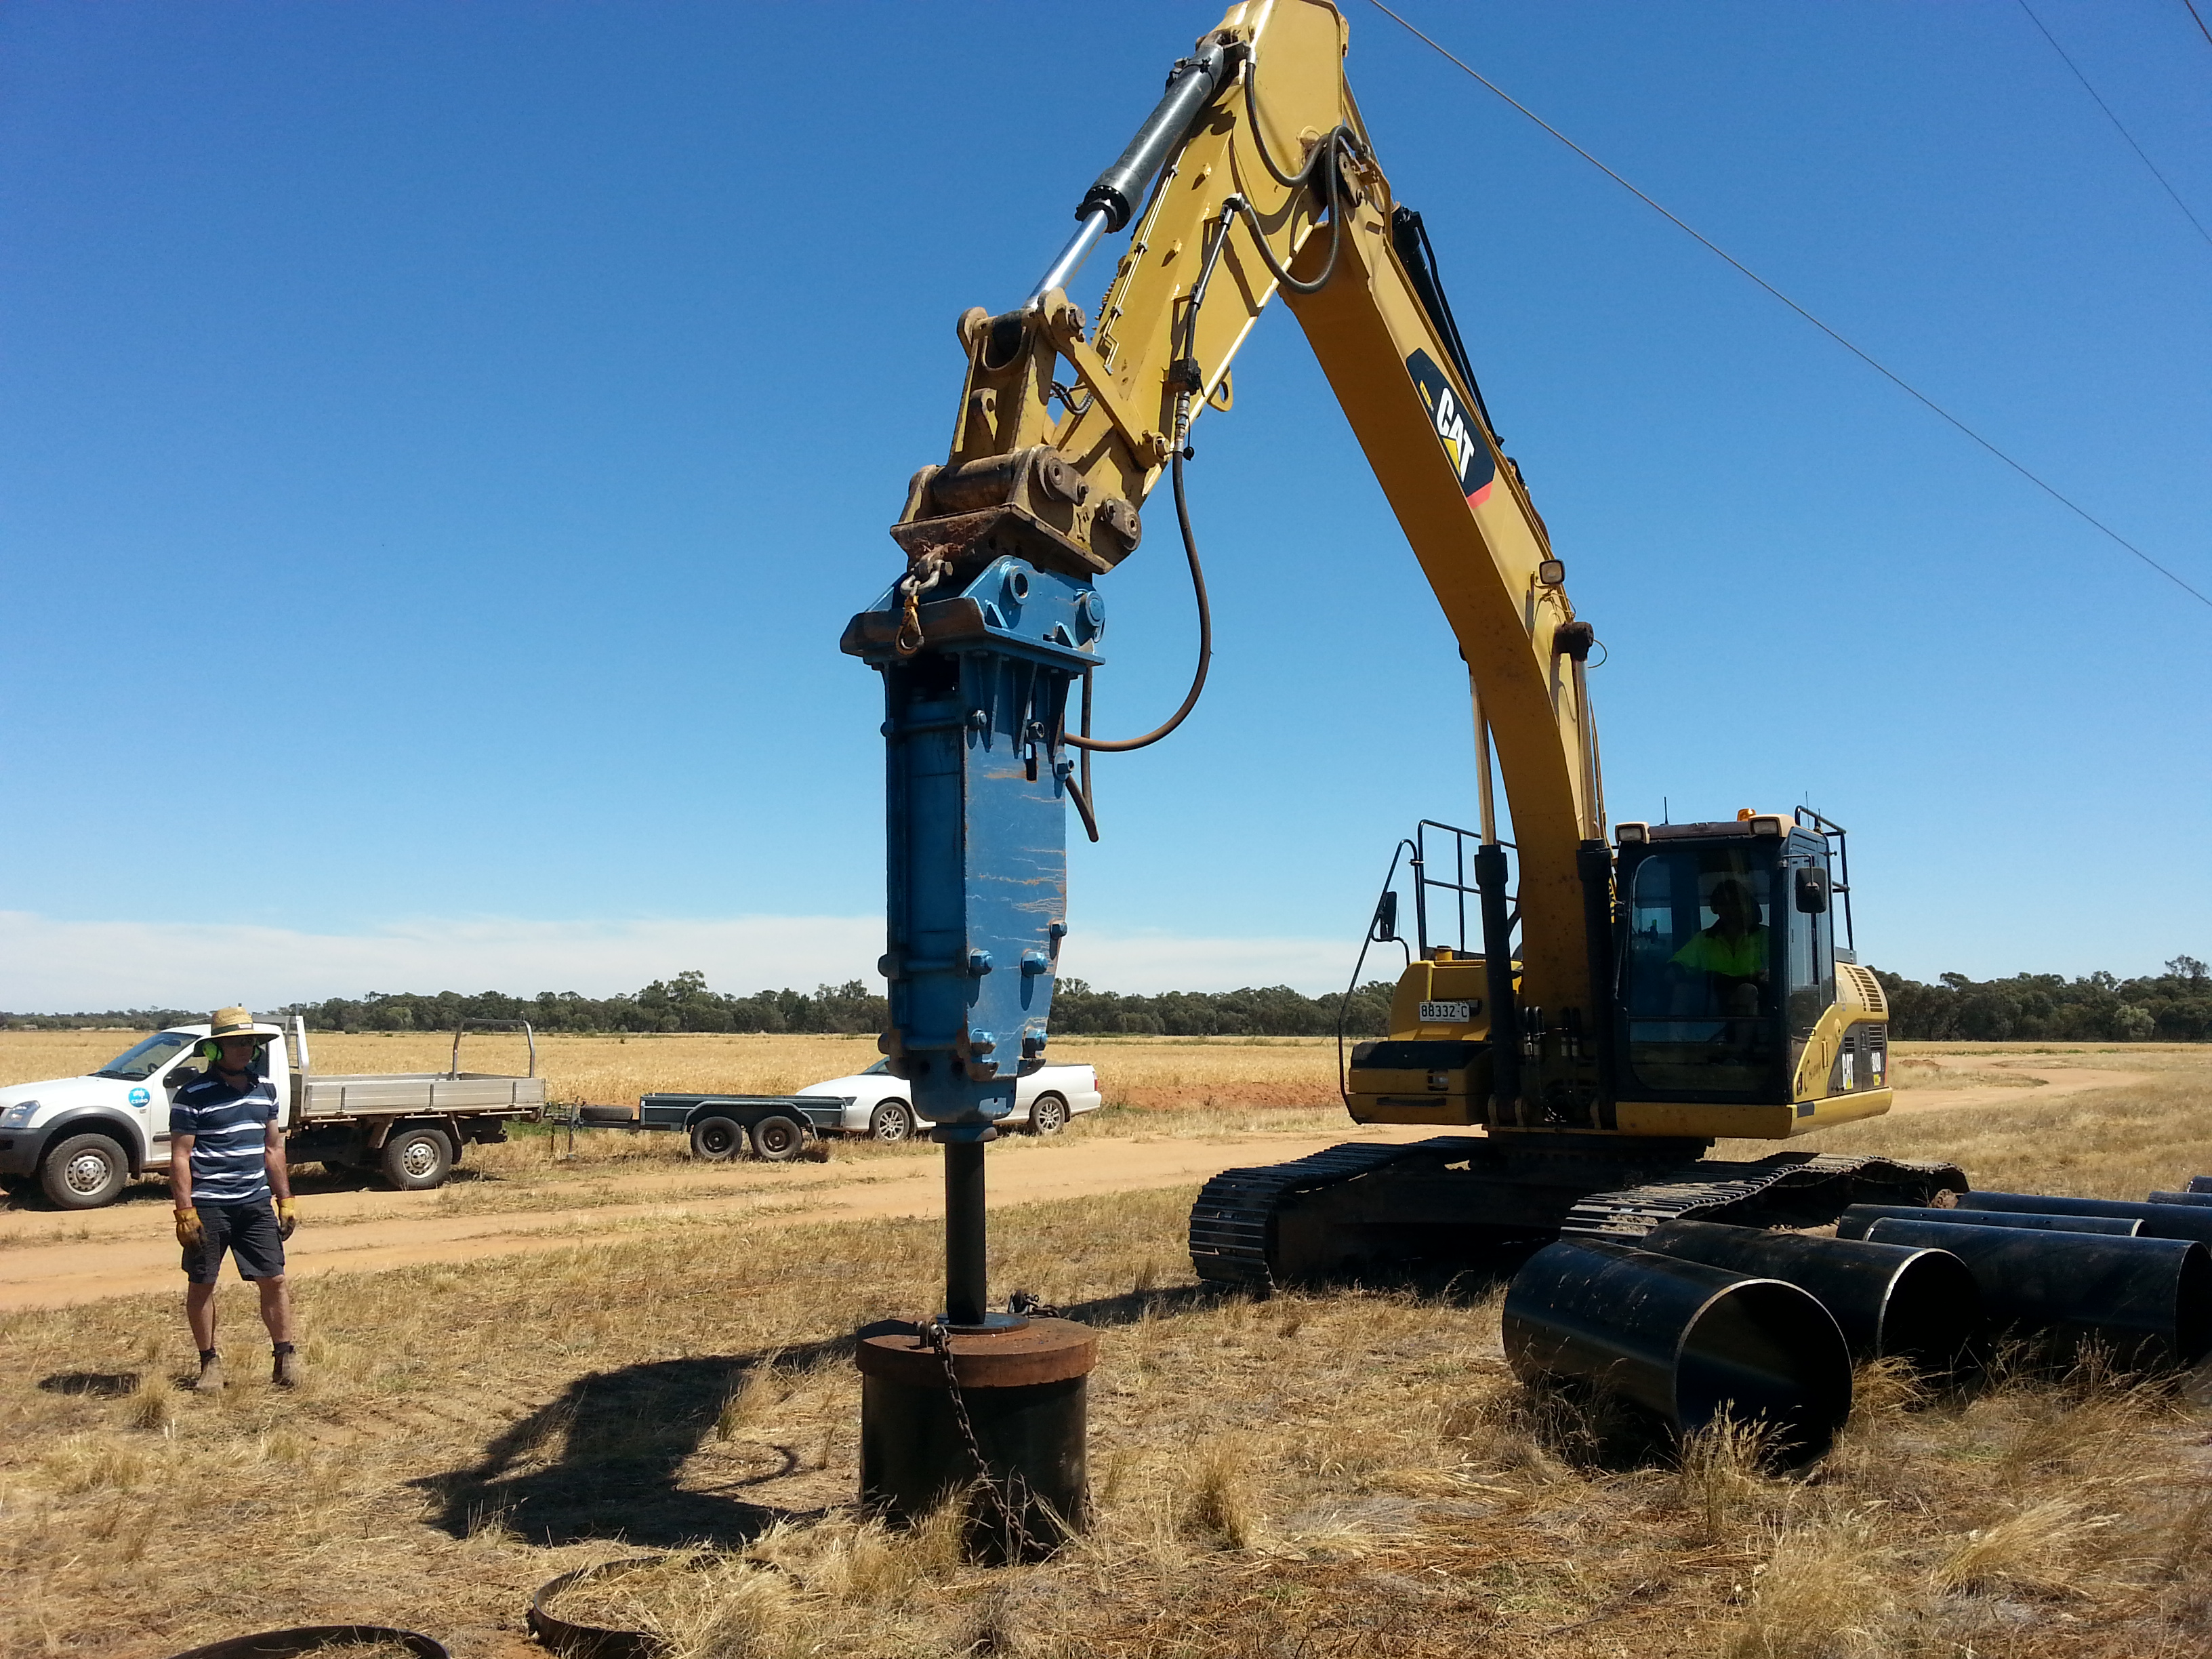
Figure 1. Collection of soil monoliths for installation into weighing lysimeter at Willbriggie, Griffith, NSW. Source CSIRO
Table 1: Soil physical and chemical properties at ten cm depth intervals for the Willbriggie Clay Loam (Chromosol) used in this study (Jamali, 2015b)
| Depth (cm) | BD (g cm-3) |
Sand >20 µm (%) |
Silt 2-20 µm (%) |
Clay <2µm (%) |
TOC (%) |
TC (%) |
TN (%) |
C:N | NO3- mgN kg-soil-1 |
NH4+ mgN kg-soil-1 |
pH |
|---|---|---|---|---|---|---|---|---|---|---|---|
| 0-10 | 1.45 (0.05) |
50.6 | 19.3 | 30.1 | 1.18 | 1.35 | 0.13 | 10.1 | 5.91 | 0.21 | 6.83 |
| 10-20 | 1.57 (0.06) |
50.2 | 21.9 | 27.9 | 0.50 |
0.60 | 0.07 | 8.3 | 1.47 | 0.13 | 6.50 |
| 20-30 | 1.63 (0.04) |
37.4 | 25.9 | 36.8 | 0.41 | 0.44 | 0.08 | 5.6 | 0.37 | 0.06 | 6.74 |
| 30-40 | 1.69 (0.07) |
34.6 | 16.4 | 49.0 | 0.40 |
0.49 | 0.07 |
6.6 | 0.59 | 0.05 | 6.87 |
| 40-50 | 1.74 (0.02) |
23.5 | 16.1 | 60.4 | 0.35 | 0.45 | 0.08 | 5.7 | 0.29 | 0.05 | 7.03 |
| 50-60 | 1.61 (0.04) |
20.6 | 38.9 | 40.4 | 0.28 | 0.38 | 0.08 | 4.9 | 0.51 | 0.05 | 7.31 |
| 60-70 | 1.66 (0.04) |
25.8 | 26.5 |
47.7 | 0.25 | 0.39 | 0.07 | 5.9 | 0.89 | 0.03 | 7.24 |
| 70-80 | 1.51 (0.02) |
27.1 | 36.6 | 36.3 | 0.23 | 0.66 | 0.06 | 10.5 | 0.44 | 0.02 | 7.26 |
| 80-90 | 1.43 (0.06) |
30.7 | 20.0 | 49.3 | 0.40 | 1.40 | 0.07 | 20.3 | 0.22 | 0.04 | 7.42 |
| 90-100 | 1.45 (0.04) |
29.0 | 26.3 | 44.7 | 0.17 | 0.46 | 0.07 | 6.2 | 0.33 | 0.13 | 7.37 |
Continuous N2O measurements
Automated chambers (Figure 2) were used to measure near-continuous fluxes of N2O, CH4 and CO2 (only N2O data are presented here). The automated chambers, custom designed to fit the round surface area of lysimeter cores, were built in-house at CSIRO, Griffith (Jamali et al, 2015a). The automated chambers were connected to a sampling unit, a CO2 analyser and a gas chromatograph (Breuer, et al, 2002). The 12 chambers were divided into three sets of four chambers with each set closing sequentially for one hour. During the hour when the chambers were closed the concentration of N2O, CH4 and CO2 was measured at 0, 20 40 and 60 minutes. The arrangement allows eight gas flux measurements per day per chamber. A one point calibration was performed by running a mixed calibration standard (0.5ppm N2O, 4ppm CH4, 500ppm CO2) after every four samples. Hourly fluxes for N2O (µg N2O-N m-2 h-1) were calculated by using linear regression and corrected for chamber temperature and pressure using the ideal gas law. The minimum detection limit of the system was approximately 3.0 µg N2O-N m-2 h-1. Daily N2O fluxes were calculated by averaging the eight measurements taken each day for each chamber. Daily N2O fluxes were integrated to calculate the cumulative N2O fluxes over the entire season.
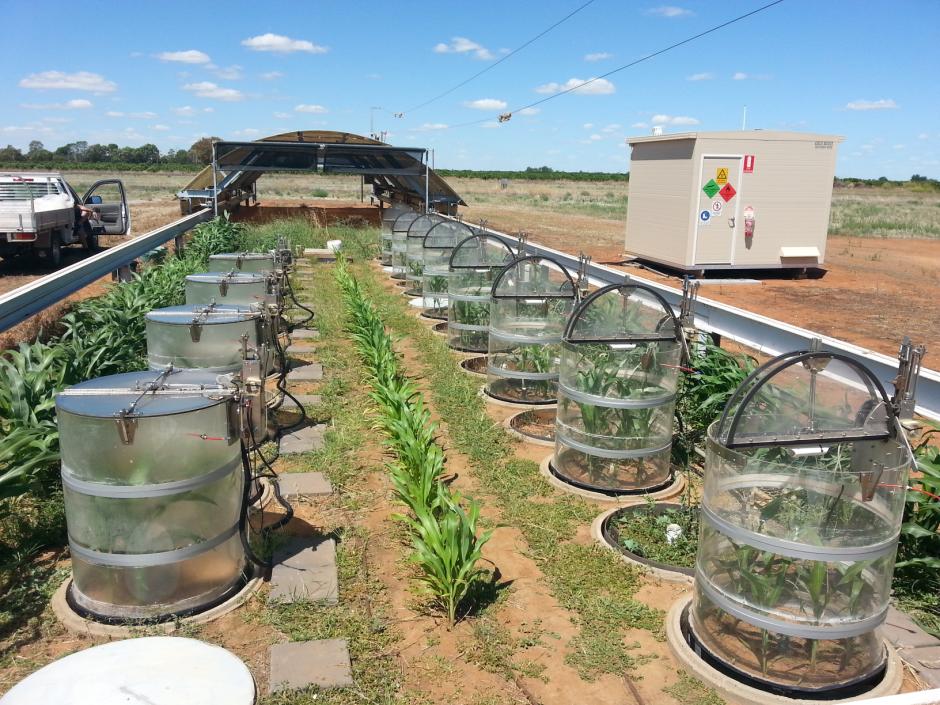
Figure 2. Irrigation experiment in progress at CSIRO Griffith lysimeter site with sorghum growing at 3-leaf stage (Source CSIRO).
The twelve soil cores used for automated N2O measurements were fitted with EnviroPro® probes (MEA, Magill, SA, Australia) to measure soil volumetric water content (VWC), soil temperature (T) and soil salinity (S) at 0.1m intervals to a depth of 1.2m. Each of these probes was connected to an individual data logger (CR1000, Campbell Scientific®, USA) which was programmed to feed data into the networked database (Irrigate Way website). Rainfall was measured from the CSIRO Griffith on-site weather station.Experimental design
The primary treatment investigated was the size of the applied irrigation events in sorghum plants grown in summer 2014, followed by the irrigation schedule in combination with the denitrification inhibitor, DMPP (Entec®) in irrigated wheat in 2014. In the case of sorghum, the total seasonal amount of irrigation water applied in all treatments was equal (3.6 ML/ha + rainfall), the application size (120 mm, 90 mm, 60 mm and 30 mm) and frequency of irrigation events varied across the four treatments (Table 2). Irrigation water used was supplied by Murrumbidgee Irrigation Ltd. Rainfall was excluded by using the lysimeter rain out shelter (Figure 1) during the period when irrigation treatments were applied (18th February to 20th April, 2014).
Table 2. Irrigation event size and frequency, fertiliser N application rate, measured N2O fluxes, total plant biomass and total plant N uptake obtained under the different irrigation treatments (Jamali et al, 2015b).
| Measurements | Unit | Treatments | |||
|---|---|---|---|---|---|
| 120mm | 90mm | 60mm | 30mm | ||
| Irrigation event size |
mm | 120 | 90 | 60 | 30 |
| Number of events | 3 | 4 | 6 | 12 | |
| Irrigation | mm | 407 | 407 | 407 | 407 |
| Rain | mm | 83 | 83 | 83 | 83 |
| Fertiliser | kg N ha-1 | 300 | 300 | 300 | 300 |
| Cumulative seasonal N2O flux |
kg N ha-1 season-1 | 1.71 (0.7) a | 1.81 (0.4) a | 1.28 (0.5) ab | 0.88 (0.2) b |
| Total plant biomass |
Mg dry matter ha-1 |
9.33 (1.9) a | 11.75 (0.6) a | 12.79 (2.2) a | 11.94 (0.9) a |
| Plant N uptake | Kg N ha-1 | 141 (26) a | 210 (13) b | 231 (31) b | 218 (15) b |
Prior to sowing sorghum the soil monoliths were all wet up equally to field capacity and allowed to drain and equilibrate for 2-3 days. Grain sorghum (Sorghum bicolor; variety MR-Taurus) was sown on 14th January, 2014. The sowing date is later than would be typically carried out commercially but was undertaken due to plants having to be re-sown due to some equipment failure. After germination, the number of plants was maintained at six plants per core which corresponded to the field recommendation of 150,000 plants per hectare for this grain sorghum variety. Sorghum plants were harvested on 30th April, 2014. All cores received an equivalent of 300 kg N ha-1 as urea split in three applications of 100 kg N ha-1 each. The first of the three fertiliser applications was applied prior to sowing in 6cm deep bands. For the two post-sowing fertiliser applications (10 and 26 February, 2014), the required amount of urea was dissolved in three litres of water and sprinkled onto the lysimeter cores using a watering can.
For the following wheat crop, the dwarf variety Maringa Rht3 was sown on 10th June, 2014 at 150 plants/m2 into the same lysimeter monoliths as the previous sorghum. Above ground biomass from the sorghum was removed. The upper surface of the soil was mixed and larger roots removed. At sowing 20 kg Nha-1 was applied as diammonium phosphate (DAP). A total of 150 kg N ha-1 was applied as urea in two applications of 75 kg N ha-1 each applied at six leaf stage (21st July, 2014) and flag-leaf stage (1st September, 2014). Treatments with two irrigations had water applied 1st September, 2014 and 15th September 2014, treatments with four irrigations had water applied 1st, 15th and 30th September, 2014 and 15th October 2014. Treatments are shown in Table 3. Urea and DMPP were dissolved in one litre of water and sprinkled on cores evenly using a watering can.
Table 3. Irrigation and nitrogen treatments applied to irrigated wheat in 2014.
| Treatment | Urea Kg N ha-1 |
DMPP | No. Irrigations |
Irrigation mm |
Total Irrigation mm |
|---|---|---|---|---|---|
| U+2I | 150 | - | 2 | 60 | 120 |
| U+2I+D | 150 | Y | 2 | 60 | 120 |
| U+4I | 150 | - | 4 | 30 | 120 |
| U+4I+D | 150 | Y | 4 | 30 | 120 |
Leachate measurements
Containers (20L) were attached to drainage outlets for leachate collection (Figure 3). Leachate was measured at least once a week and a sample collected and frozen for later analyses for mineral N .
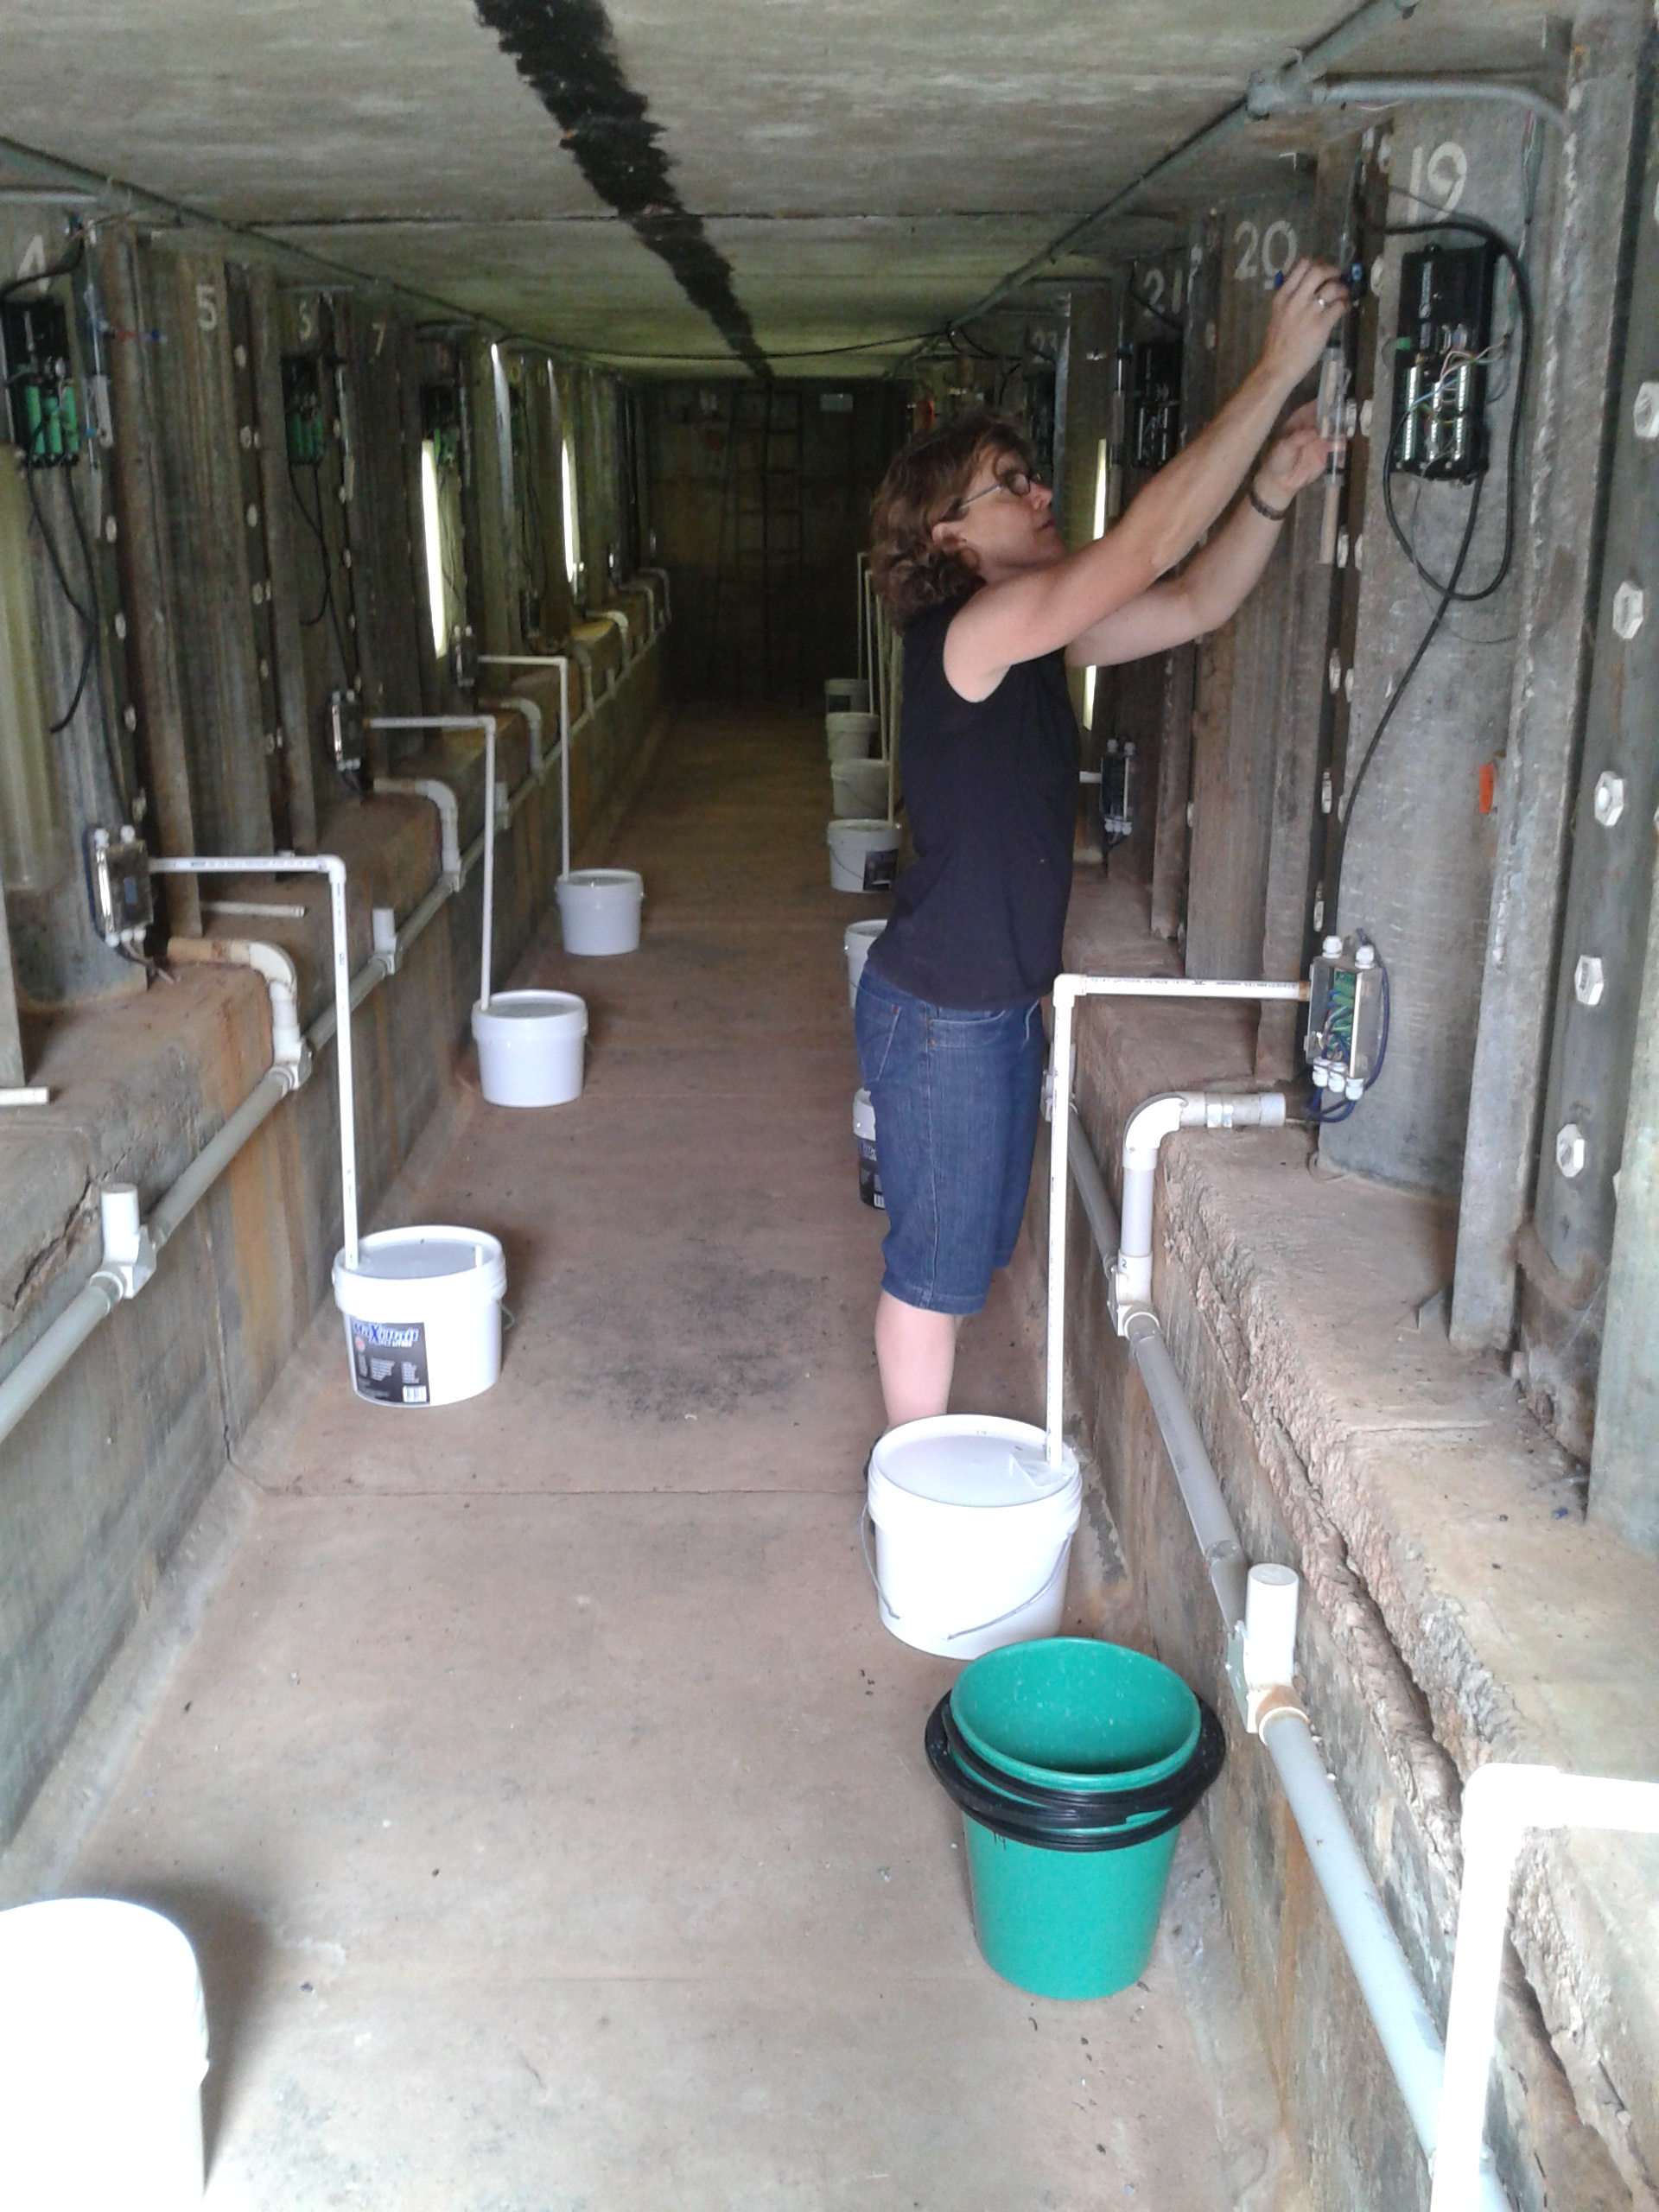
Figure 3. Underground view of the lysimeter facility showing leachates and soil water collection (Source CSIRO).
Results and discussion
Impact of irrigation on temporal N2O fluxes - sorghum
The magnitude of N2O flux varied according to the applied treatments (Fig. 4). The highest N2O fluxes were recorded after irrigation events following a fertiliser application (Fig. 5). Prior to crop irrigation on the 18th February, the application of fertiliser on the 10th February had a negligible effect on background N2O emissions (Fig. 4).
Following the fertiliser application of 100 kg N ha-1 on 10th February, the irrigation applied on 18th February generated high but variable N2O pulses across treatments. The highest daily average N2O pulse in response to this irrigation was measured in the 90 mm treatment (84±6 g N2O-N ha-1 day-1) followed by the 120mm (54 ±14 g N2O-N ha-1 day-1) and 60 mm (46 ±40 g N2O-N ha-1 day-1) treatments with negligible response from the 30 mm treatment (Figure 4, Jamali et al, 2015). The N2O fluxes in the 30mm treatment generally remained below 10 g N2O-N ha-1 d-1 and increased to a maximum of 18 ± 4 g N2O-N ha-1 day-1 in response to the irrigation. Elevated N2O fluxes were sustained for the longest duration in the 120 mm treatment before declining to pre-irrigation levels (~10 g N2O-N ha-1 day-1) 10 days after irrigation. In the 90 mm and 60 mm treatments the N2O pulses dropped to pre-irrigation levels in approximately five and two days, respectively, after irrigation.
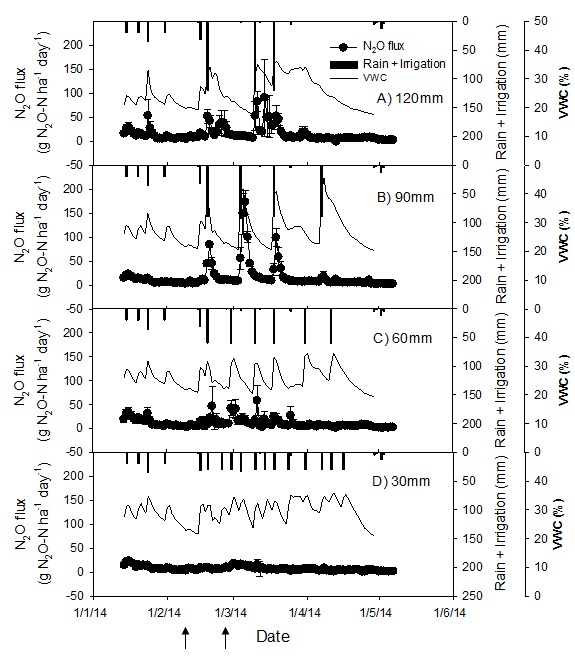
Figure 4. Seasonal pattern of N2O emissions and volumetric water content (0-10 cm) in sorghum in response to different irrigation treatments; N2O fluxes and water content are expressed as average from three cores. Arrows on x-axis show urea application date, applied to all treatments (Jamali et al 2015b)
A further 100 kg N ha-1 fertiliser applied on 26th February did not generate significant N2O fluxes until the irrigation was applied according to treatments (Figure 5). The irrigation following this fertiliser application resulted in N2O pulses of greatest magnitude in the 90 mm treatment followed by the 120 mm treatment and the 60 mm treatment, and negligible response in the 30 mm treatment (Figure 5). Thus, the difference between the cumulative N2O fluxes in the 90 mm and the 120 mm treatments increased as the season progressed.
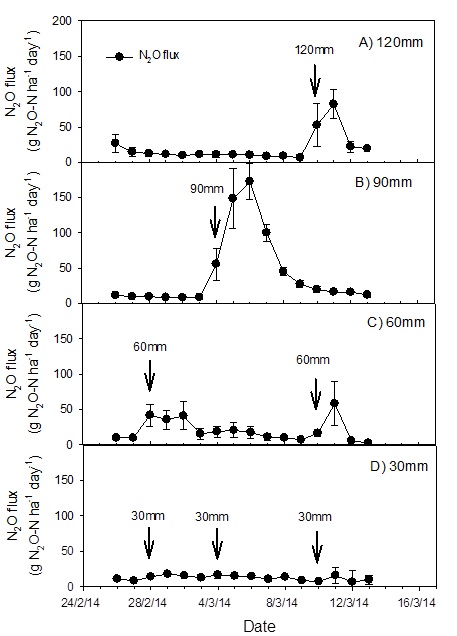
Figure 5. Daily N2O flux from sorghum from a selected period (26 February - 13 March) showing response to irrigation events; error bars are standard error of the mean (n = 3); black arrows show the date of irrigation application with amount (mm) of water shown on top of each arrow; grey arrow shows timing of 100 kg N ha-1 applied as urea (Jamali et al, 2015b)
There was a significant effect of irrigation event size on N2O fluxes. The average daily N2O flux over the entire growing season in the 30 mm treatment was significantly smaller than in the 90 mm and 120 mm treatments, but was not significantly different from the 60 mm treatment. The cumulative N2O emissions integrated over the entire season (107 days) were 1.71 ± 0.70 (120 mm), 1.81 ± 0.39 (90 mm), 1.28 ± 0.51 (60 mm) and 0.88 ± 0.21 (30 mm) kg of N emitted as N2O per hectare (Table 2).
Losses of water and mineral-N through leaching
Irrigation treatments had a significant effect on leaching losses of water. Deep drainage was greatest in the 120 mm treatment which lost 48 ± 1% of the total water applied to the cores as irrigation and rain (Table 3). Water losses through drainage were least in the 30 mm treatment which lost 14 ± 4% of total water applied as irrigation and rain. The 60 mm and 90mm irrigation treatments were intermediate losing 30 ± 2% and 30 ± 9% of applied water, respectively, (Table 4). Leaching losses of mineral N were dominated by NO3- with NH4+ losses accounting for <2% of total leached N. Mineral-N losses through leaching responded to irrigation treatments and decreased in the order 120 mm (20%) > 90 mm (9%) > 60 mm (6%) > 30 mm (3%) as shown in Table 3. The difference in leaching losses of water and mineral N were only significant between 120 mm and 30 mm treatments (Table 4).
Table 4. Mean evapotranspiration and mean leaching losses of water and mineral nitrogen (ammonium + nitrate) (Jamali et al., 2015b).
| Treatment | Evapotranspiration | Water leaching | Mineral N leaching |
|---|---|---|---|
| (mm) | (mm) | (Kg N ha-1) | |
| 120mm | 317 (5)a | 211 (5) a | 61.3 (11.5) a |
| 90mm | 377 (71) ab | 132 (41) ab | 25.6 (12.9) ab |
| 60mm | 374 (13) ab | 134 (11) ab | 17.4 (3.4) ab |
| 30mm | 453 (17) b | 60 (18) b | 8.4 (4.5) b |
Evapotranspiration (ET)
Surface losses of water through evapotranspiration were greatest in the 30 mm treatment (453 ± 17) and lowest in the 120 mm treatment (317 ± 5) (Table 4). The highest ET was observed following irrigation applications. The differences in ET were statistically significant between 120 mm and 30 mm only (Table 3).
Plant biomass and nitrogen uptake
Plant N uptake was lowest in the 120 mm treatment compared with the 90 mm, 60 mm and 30 mm treatments (Table 2). Plant N uptake in the 30 mm and 60 mm treatments were significantly higher than the 120 mm treatment (Table 2). Plant biomass showed a similar pattern with a lower biomass being obtained in the 120 mm treatment relative to the other three treatments. However, the differences in plant biomass were statistically not significant (Table 2). Yield data was unavailable. However, the biomass and plant N uptake data under the smaller and more frequent irrigation applications indicated that a higher frequency, split irrigation may offer no yield penalty while also potentially reducing N2O emissions. Indeed, the 30 mm and 60 mm treatments both showed significant increases in plant N uptake suggesting yield may be improved through the decreases in N losses through leaching and denitrification.
Effect of irrigation on N2O fluxes
The results show the potential of more precise surface irrigation applications which may be possible to achieve in systems which have high flow rate water supplies and terraced or level furrow layout designs, which may reduce system N losses. The cumulative N2O emissions were reduced by ~50% and ~25% when irrigation was applied in 30 mm and 60 mm events, respectively, compared with the more usual farmer practice of ~120 mm irrigation events (Table 2).
Reduced N2O emissions in the 30 mm and the 60 mm irrigation treatments resulted from an avoidance of large N2O emission which constituted 56%, 56% and 41% of total emissions in the 120 mm, 90 mm and 60 mm treatments, respectively, but only 5% of total emissions in 30 mm treatment. The size of N2O pulses was regulated by the size of irrigation event and the time since fertiliser was applied. Soil moisture plays a key role in driving the processes of nitrification and denitrification by regulating soil oxygen levels when mineral N is not limiting (Bouwman, 1998). In this study, all of the N2O pulses of ≥20 g N2O-N ha-1day-1 occurred at water filled pore space (WFPS) above 49% (Figure 6). The optimum WFPS for N2O production is considered to be between 70% and 80%, depending on soil type, above which the dominant end product of denitrification is N2. These previous findings concur within this study in which 77% of pulses, sized ≥50 g N2O-N ha-1day-1, were measured at WFPS above 75% (Figure 6).
The large N2O pulses from the soil monoliths, which contributed significantly to total N2O emissions, were observed at high soil water contents only when mineral N was not limiting in the soil. All N2O pulses, ≥50 g N2O-N ha-1day-1, with the exception of one, occurred in the first 30 days after fertiliser application and the commencement of irrigations (Figure 6). The periods with high soil water content but low soil mineral N, and vice versa, did not generate high N2O pulses.
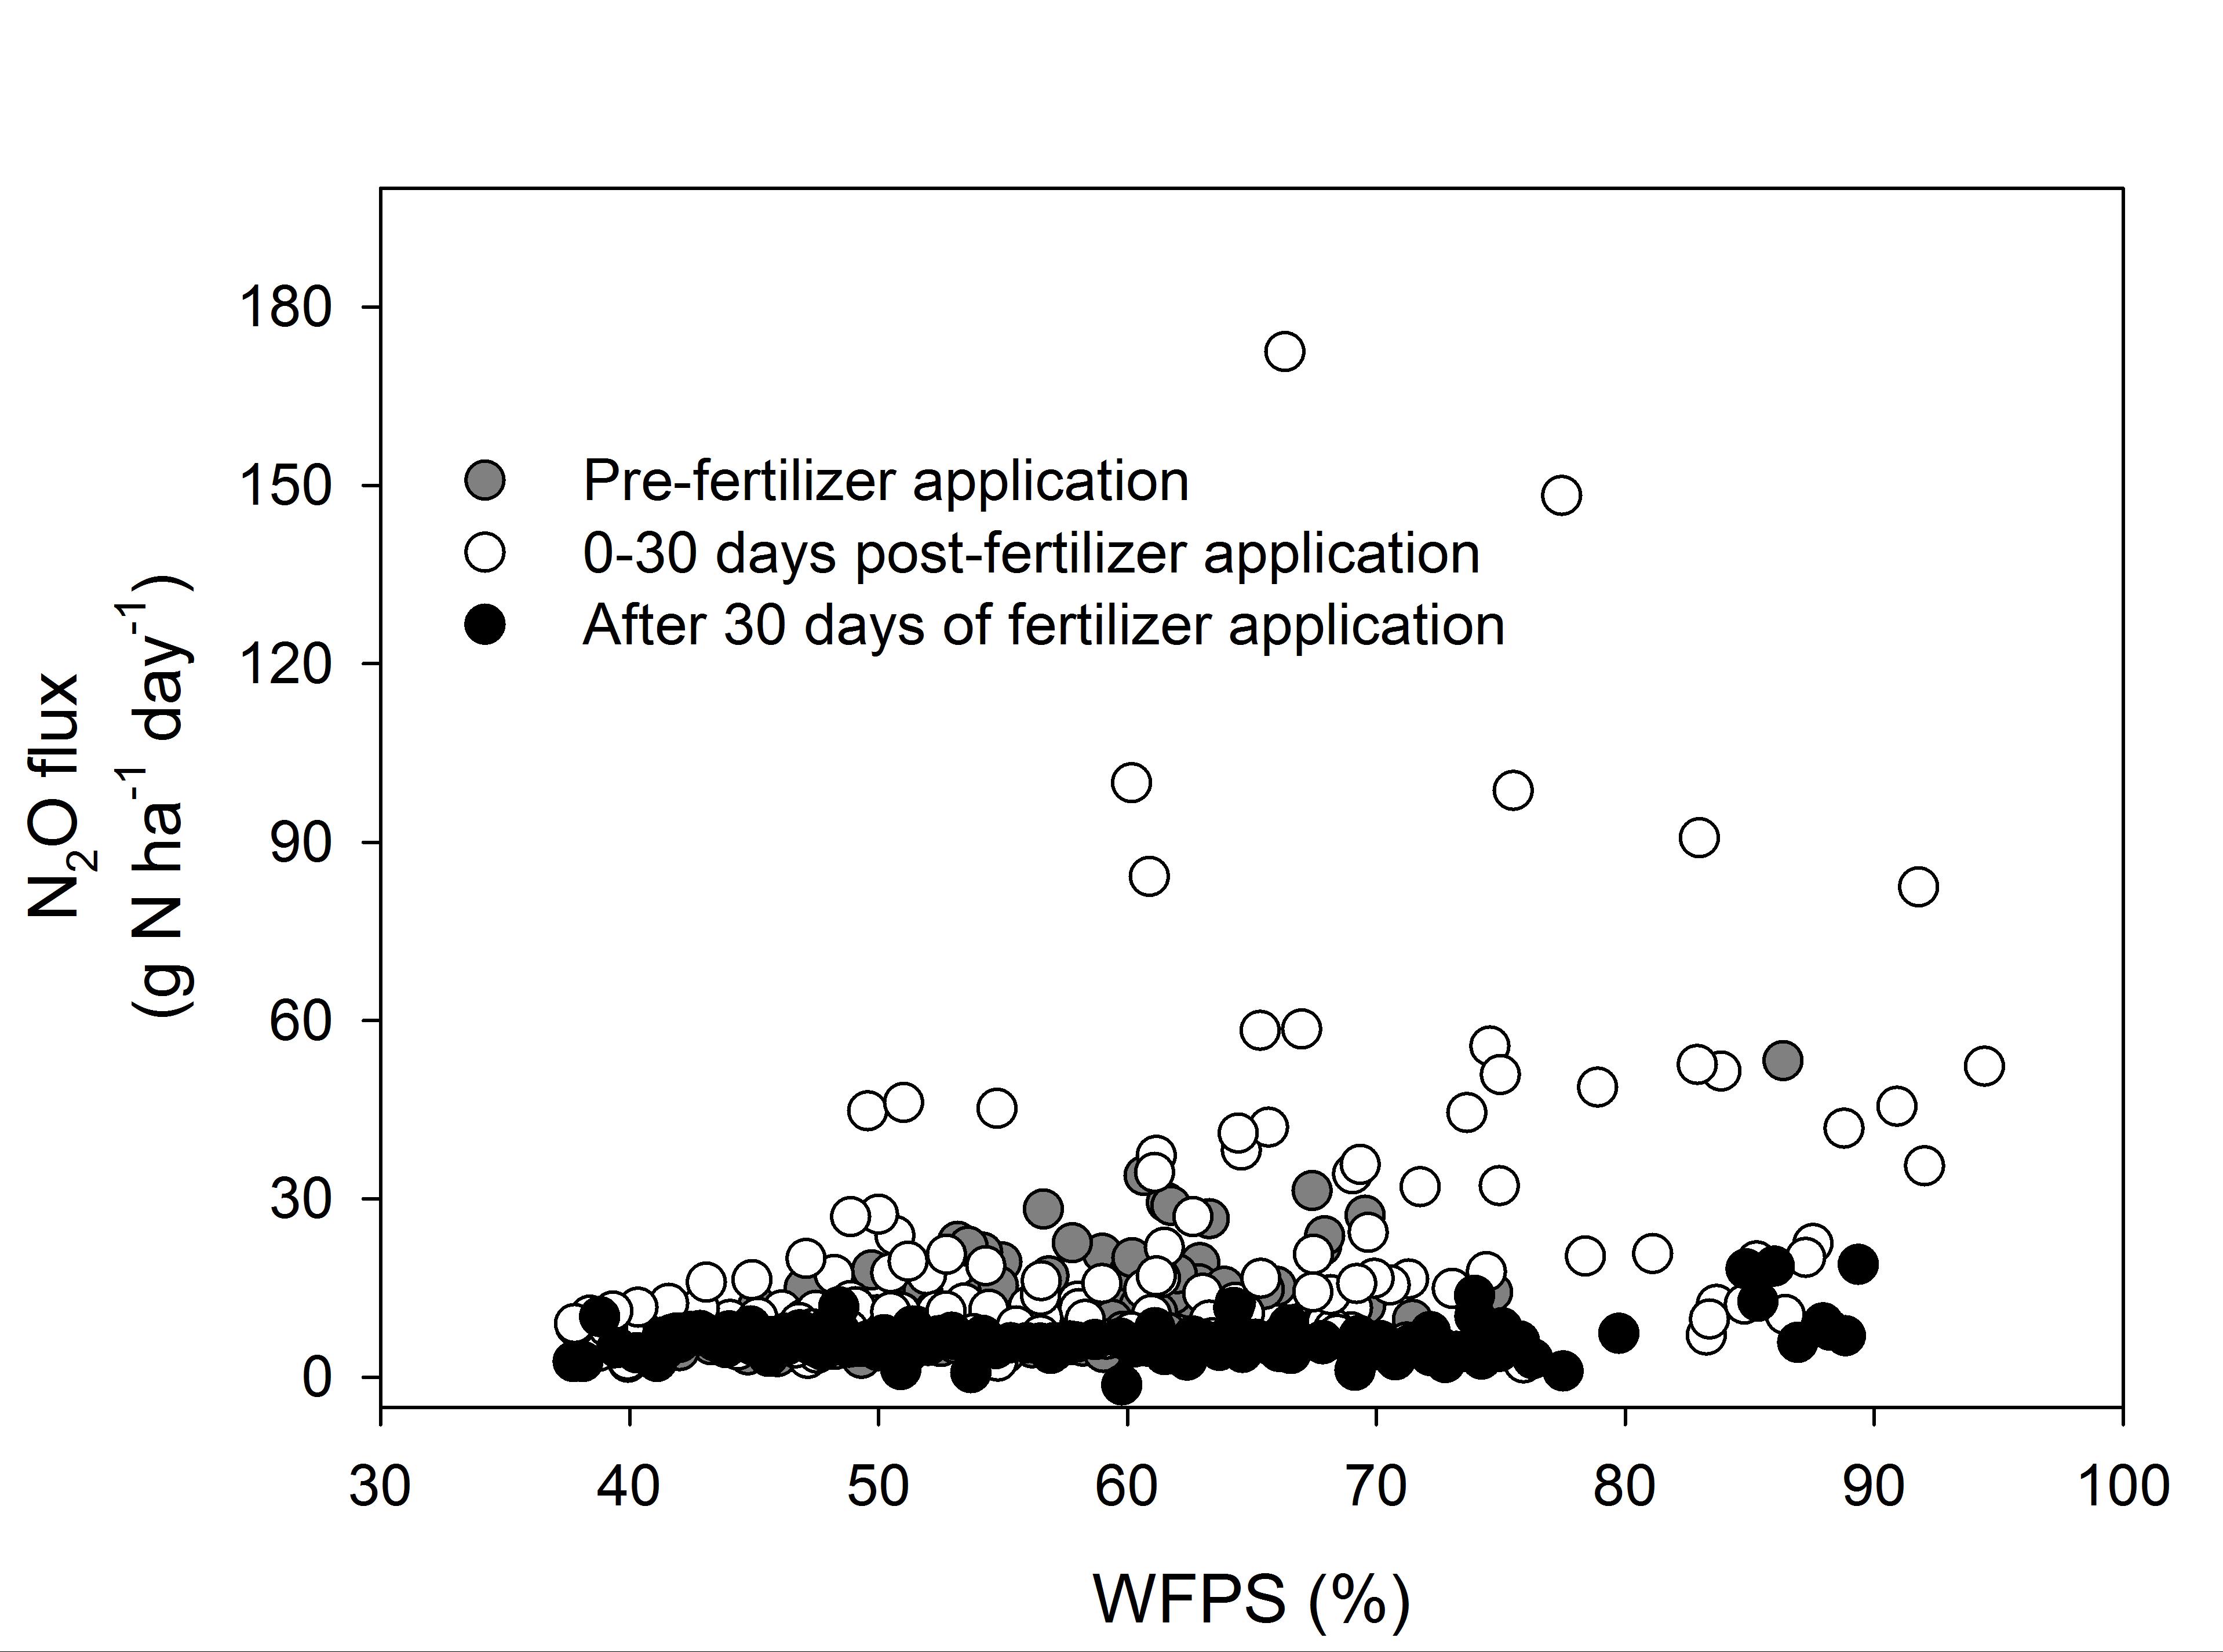
Figure 6. Average daily N2O flux (n=3 cores) plotted against average daily water filled pore space (WFPS) for three periods including: 1) Pre-fertiliser (after sowing): between 14 January and 9 February; 2) 0-30 days post fertiliser application: between 10 February and 25 March and, 3) After 30 days of fertiliser application: 26th March onwards (Jamali et al, 2015b).
The treatments emitting the lowest cumulative N2O emissions (30 mm and 60 mm) also had the smallest amount of losses of N through leaching (Figure 7, Table 3) which suggests soil oxygen levels, rather than mineral N, may have been the limiting factor for N2O emissions in these two treatments. The cumulative N2O emissions from the 90 mm irrigation application treatment were larger than the 120 mm treatment, although insignificant (Table 2). The cumulative emissions from the 120 mm treatment dropped below the 90 mm treatment only after the application of a second irrigation applied on 4th (90 mm) and 10th March (120 mm), 2014. We consider that, lower soil oxygen conditions developed under the 120 mm treatment than the 90 mm treatment due to a higher WFPS in the former which endured for longer periods. These conditions favoured denitrification progressing through to its end product, N2.
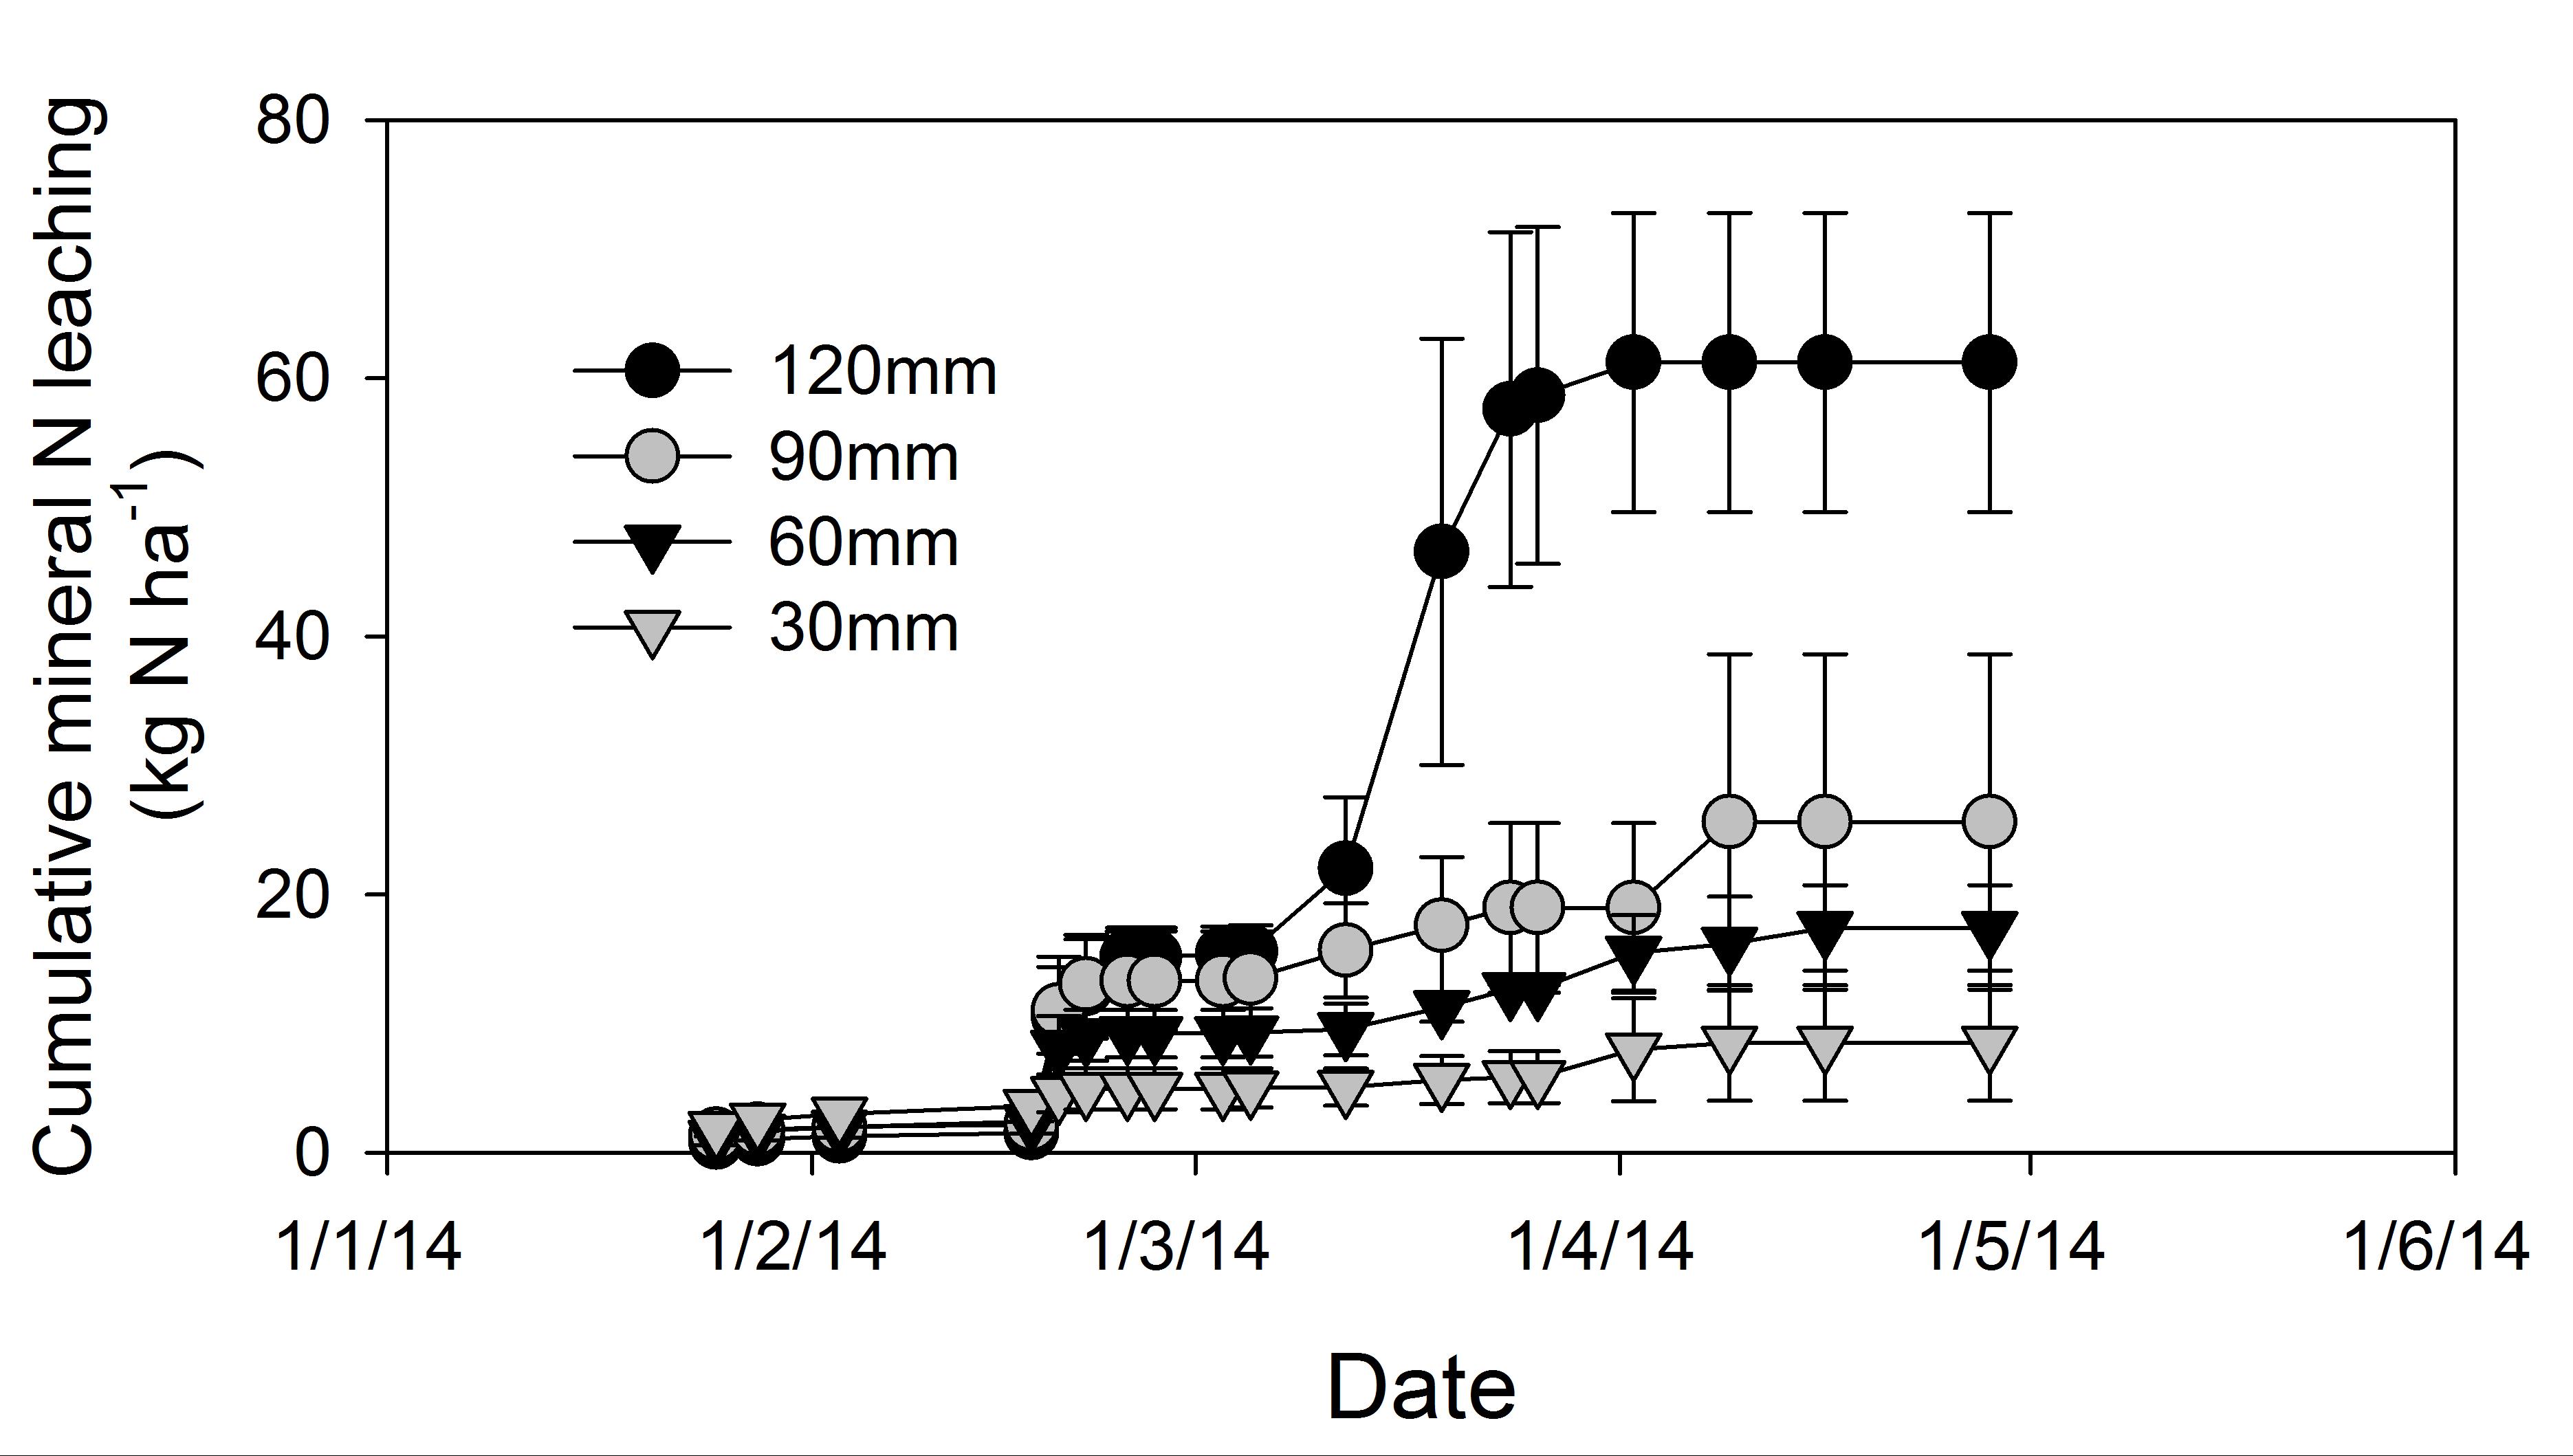
Figure 7. Cumulative losses of mineral nitrogen (NO3- + NH4+) through leaching (Jamali et al 2015b).
Impact of irrigation on total N2O fluxes – wheat
Data analysis is ongoing but preliminary results of the wheat experiment indicate that maximum N2O emissions constituted only ~ 0.3% of fertiliser-N applied. The most effective N2O mitigation was achieved using DMPP in combination with smaller and more frequent spring irrigations (Figure 8) rather than the typical two or three irrigations used in commercial crops. A more frequent irrigation schedule of lower application volume, was as effective at reducing N2O emissions as using the inhibitor product. No leaching losses of water occurred in the smaller volume irrigation application treatments.
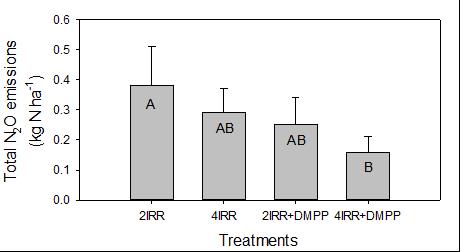
Figure 8. Total seasonal N2O emissions from wheat showing response to irrigation events in combination with DMPP. IRR = no. of irrigation applications with and without DMPP. AB denotes statistical significance.
Conclusions
Improvements in surface irrigation layout design that allow more precise water scheduling for broadacre crops and soils in the Murrumbidgee and Murray Valley can provide not only potential water use efficiencies through uniform application and potential reductions in waterlogging, but may also reduce system N losses to the atmosphere and through leaching. The study presented here provides proof of concept in a comparative experimental situation of significant reductions in N losses in both summer and winter irrigated crops if water applications can be reduced down to approximately 30-60 mm compared with 120 mm applications. Above ground biomass and N uptake were either maintained or even enhanced in wheat and sorghum plants. These findings add credence to farmer agronomic evidence on how high performance surface irrigation systems may be worth consideration for capital investment. The results indicate that rigorous full scale field testing is now required in both the Murray and Murrumbidgee Valleys, to account for system supply and soil differences. Thorough economic analysis, agronomic research trials and farmer field trials are required for better understanding of practical implementation.
Acknowledgements
Federal Department of Agriculture (Zaman Nuruzzaman), GRDC (Martin Blumenthal and Phil Price), and Queensland University Technology (QUT; Prof Peter Grace) are gratefully acknowledged for their support, administration and co-ordination of the National Agricultural Nitrous Oxide Reduction Progamme (NANORP). Charlie Walker, Incitec Pivot Fertilisers is thanked for providing the DMPP, Chris Fletcher, Pacific Seeds is thanked for providing the sorghum seeds and Dr Peter Chandler, CSIRO is thanked for providing the wheat seeds.
References
Isbell (2002) Australian Soil Classification.
Jamali et al (2015a) Plos One – submitted December, 2014.
Jamali et al. (2015b) Agriculture and Forest Meteorology – submitted December 2014
Smith, et al. (2013) Irrigation Australia, 2013 Irrigation Conference, Griffith, NSW.
Stott D. (2013). Modernising on- farm surface irrigation in the Murrumbidgee Irrigation Area - a farmer’s perspective. Irrigation Australia, 2013 Irrigation Conference, Griffith, NSW.
Contact details
Wendy Quayle and Hizbullah Jamali
CSIRO Agriculture Flagship, PMB 3 Griffith, NSW 2680
Wendy.Quayle@csiro.au, Hizbullah.Jamali@csiro.au
Was this page helpful?
YOUR FEEDBACK