Irrigation cropping - can we afford the water?
Author: Rob Rendell (RMCG) | Date: 30 Jul 2015
Take home messages:
- Using significant water on crops other than rice will only occur if they outperform rice. There will always be some opportunistic use of water to top up cereals but for the other crops to expand, rice is the benchmark.
- It appears that yields from wheat at 2t/ML, maize at 2t/ML and cotton at 1.2bale per ML all have double the income of rice per ML. It looks like these crops are going to expand? If they do expand this will put pressure on the rice industry.
Review of the 1990s
Rendell McGuckian undertook for GRDC in the ‘90s a review of the irrigation cropping options and identified that:
- There was plenty of water and it was relatively cheap so the more water that was able to be used the bigger the profit. Despite a relatively low income per ML (compared to cotton, dairy or horticulture) the rice industry was a large purchaser of the water traded.
- All the irrigated crops yields were similar and were achieving up to 1t/ML; i.e. rice, wheat, lucerne, pasture and maize were all roughly the same.
- The price paid for each crop was relatively linked, and thus there was nothing much between the crop options in terms of price.
- Labour was a key limiting resource in business profit – particularly owner’s labour.
- Labour required was relatively low, and
- the capital cost of irrigation systems was also relatively low compared to other crops.
- Large volumes of water are applied to a relatively small area.
- Therefore it was a case of growing as much rice as you possibly could, making it difficult for other crops to compete.
What has changed?
Since the turn of the century we have seen:
- The Murray Darling Basin (MDB) plan i.e. about 30 per cent of the water entitlements have gone out of the system; despite some people’s hopes, the environment is not trading back to the consumptive sector.
- A series of dry years; only two years in the last 14 have seen inflows to the Murray exceed the long term average (Eildon has had only one year). Is this just a long dry or is it a ‘step change’ in climate that we are seeing?
- Effectively the available water has halved. Professor Peter Cullen (Wentworth Group of Concerned Scientists) predicted at the start of the century that irrigators would have to produce twice as much crop with half the water. We have half the water; can we double production?
- The Murray Irrigation dairy industry has maintained its production compared with the ‘90s by a combination of utilising a greater percentage of the available water and by buying in feed produced on dryland. It has not yet made a substantial increase in production per ML, (i.e. still 1t/ML) though some of the yields from maize has dramatically increased (ie 3t/ML).
- The rice industry is now producing around 700,000 tonnes compared with the peak in 2001 of 1.8 million tonnes and the price for rice is relatively high as a result of a combination of high world markets, growing niche varieties and good marketing.
- The price of ‘market water’ or ‘allocation’ or ‘temporary water’ (whatever you call it) reflects the reduced supply. Water now has a significant value and can be bought, used or sold. Thus the price of water is driving the decisions on what crop to irrigate.
- The water in the Southern connected basin is effectively traded as one system and in practice the NSW general security allocations determine the price. There are three main scenarios, i.e:
- Drought i.e. Victoria does not get 100 per cent allocation for its high reliability water shares. This is a relatively rare event and it is predicted that in this situation, the price of water would be high >$200 per ML?
- Wet period where Victoria does get a low reliability water share allocation (and NSW has 100 per cent). This is infrequent and has not happened in recent times but with above average inflows it would and will happen again. It is predicted that in this situation the price of water will be relatively low < $50 per ML?
- Most ‘normal years’ where Victoria gets 100 per cent allocation for high but has no low allocation. The horticulture and dairy industries will use this water and the amount available for trade/used for irrigated cropping and rice will depend on the NSW general security allocation. When there was 100 per cent general allocation in MIL the price in 2013/14 was around $80 and in 2014/15 when the allocation was initially around 70 per cent (including carryover) the price was around $125.
- Despite the relatively high price for temporary water this year, Murray Irrigation has been a net importer of 93,000ML in 2014/15 (about 15% of total use) which suggests that the rice industry is probably still a buyer at $120/ML but perhaps not as much as the previous year? Rice still dominates the water used in southern NSW and is clearly profitable.
- Farmers collectively are being conservative with large volumes of carryover; particularly in Victoria where around 1000GL is being carried over from year to year. The environment is not carrying over much water.
- The farm efficiency grants (where farmers undertook improved capital irrigation works in return for giving back some of the water savings) have been a significant subsidy and catalyst for on farm works.
- Production efficiency: many irrigation crops (wheat/maize/canola) have improved their yields (almost double tonnes per ML) due to new irrigation systems which remove waterlogging i.e. fast flow combined with automation and irrigation scheduling; or linear move/centre pivots. In contrast rice is still struggling to reach 1t/ML with only relatively minor improvement in yield.
- Dryland crops have improved their yield, e.g. wheat is now around 2t/ML of growing season rainfall (GSR), which is double what it used to be and is very close to the maximum theoretically possible.
- Labour efficiency: automation and linear move/CP have reduced the labour requirements for irrigated crops, making them competitive with rice in terms of labour.
- Double cropping is now starting to be practised (or at least three crops in two years) in order to justify the extra expenditure on improved irrigation systems.
- Cotton, which is a higher return crop, has moved south to Berrigan due to new varieties, and cotton generally has seen productivity lifts due to Roundup Ready, insect control and better harvesting machines. The current and proposed ginning capacity is likely to drive increased production.
Some data on water that is useful
Table 1: Entitlements across the southern Murray Darling Basin.
| State | Entitlement Type | Reliability Class | GL held by irrigators and water authoritiesa | CEWH Entitlements (% of total GL on issue as of February 2015)b |
% of Long-term average Yieldc |
|---|---|---|---|---|---|
| Golburn System | |||||
| Victoria | High reliability water share | High | 647 | 245 (27%) | 95% |
| Victoria | Low reliability water share | Low | 374 | 22 (6%) | 42% |
| Broken System | |||||
| Victoria | High reliability water share | High | 17 | 1 (6%) | 95% |
| Victoria | Low reliability water share | Low | 3 | 0 (0%) | 75% |
| Campase System | |||||
| Victoria | High reliability water share | High | 16 | 7 (30%) | 95% |
| Victoria | Low reliability water share | Low | 18.6 | 0.4 (2%) | 49% |
| Loddon System | |||||
| Victoria | High reliability water share | High | 18 | 3 (14%) | 95% |
| Victoria | Low reliability water share | Low | 7.5 | 0.5 (6%) | 27% |
| Murrumbidgee System | |||||
| NSW | High Security water access licence | High | 358 | 7 (2%) | 95% |
| NSW | General Security water access licence | Medium | 1813 | 230 (11%) | 64% |
| Total (GL) | Total (GL) | ||||
| Total High Security (Vic + NSW + SA) | 2592 | 655 | - | ||
| Total Medium Security (NSW General Security) | 3156 | 557 | - | ||
| Total Low Security (Vic LRWS) | 670 | 45 | - | ||
aGL held by irrigators and water corporations sourced from multiple sources including water authority annual reports, websites and ‘A Guide to the Water Sharing Plan for the Murrumbidgee Regulated River Water Source September 2004’
bCommonwealth Environmental Water Holder entitlements as of 28th February 2015. Source:Environmental Water Holdings website.
cAverage yield is adapted from long term average annual yield information on the Commonwealth Environmental Water Office website.
Table 2: Water availability scenarios.
| Scenario | Allocation level | Probabilities – Number of years in 20 | Total Water Availability (GL) | ||
|---|---|---|---|---|---|
| LTCE | Based on inflows over the last 20 years | Based on inflows over the last 10 years | |||
| Wet | 100 % HRWS, 100% GS, Some allocation against LRWS | 7 | 3 | 1 | 6.5 |
| Medium – Wet | 100% HRWS 70–100% GS, 0% LRWS | 4 | 5 | 5 | 6.1 |
| Medium | 100% HRWS, 50–70% GS, 0% LRWS | 4 | 5 | 5 | 4.8 |
| Medium – Dry | 100% HRWS, 0–50% GS, 0 LRWS | 4 | 5 | 5 | 3.6 |
| Drought | <100 % HRWS, 0% GS, 0% LRWS | 1 | 2 | 4 | 1.8 |
Note: The probabilities are approximations and rounded to give orders of magnitude. Water availability is a guide based on the allocation against all the different entitlements in the southern-connected MDB for that scenario. Entitlements include Victoria Murray, Goulburn, NSW GS (including Murrumbidgee) and South Australia. Water availability does not include allocation against water entitlements owned by the Commonwealth as of May 2015. Water available includes approximately 0.5 GL of ground water. Scenario probabilities are derived from three inflow assumptions:
- based on a long-term cap equivalent (LTCE), which is based on inflows and irrigation-development modelling for 113 Years up to 2009
- looking at the probabilities based on inflow conditions in the last 20 years
- looking at the probabilities based on inflow conditions in the last 10 years
In the three levels of ‘normal’ years, the High Security allocation is always 100 per cent in all Valleys and States; the only variable is how much NSW General Security is available.
How often each scenario occurs depends upon whether you use LTCE, the last 20 years’ inflows or the last 10 years’ inflows. As demonstrated in Figure 1, Table 3 the last 20 years is worse than the LTCE and the last 10 years is worse again due to the millennium drought.
What this shows is that for most of the time (60-75%), we operate in the normal scenarios irrespective of the inflow assumptions (LTCE, last 20 years or last 10 years). What does change and what can have the biggest impact on irrigation enterprises is the number of dry years in any 20-year period.
If the last 20 years is more reflective of future inflows then the frequency of dry periods doubles compared to the longer term (two years in 20 compared to one year in 20). If the last 10 years are more reflective of the future then the frequency of the dry period increases four-fold (four years in 20 compared to one year in 20).
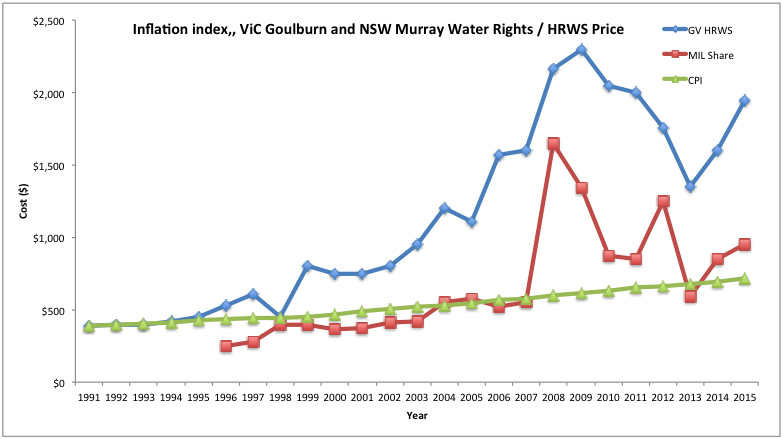
Figure 1: Goulburn Irrigation System HRWS and NSW General Security entitlement prices.
(Water prices are indicative only and data has been sourced from various sources including Dairy Australia Water Availability – Background Paper RMCG (August 2009), Henning Bjorland University SA, National Research Flagships – A Summary of Water Trade and Price Data for the Southern Murray-Darling Basin CSIRO (June 2011). NSW General Security entitlements value-based on Murray Irrigation entitlement trade information at September of each year).
Table 3: Allocation price aligned to the different seasonal scenarios
| Seasonal scenario | Irrigation season close to the seasonal scenario description |
Median allocation price/ML Goulburn systema |
|---|---|---|
| Wet | 2011-12 | $20 |
| Medium – Wet | 2012-13 (100% NSW GS) | $45 |
| Medium | 2014-15 (61 % NSW GS) | $120 |
| Medium – Dry | 2009-10b (34% NSW GS) | $165 |
| Drought | 2007-08 (0% NSW GS) HRWS <100% | $400 |
aMedian allocation prices is for the Goulburn system and sourced from the Victorian Water Register.
b2009-10 year had 100% HRWS for all valleys except the Goulburn system which had a 71% HRWS allocation. It is considered that this is a reasonably close to the Normal “dry” conditions.
Table 4: Start of season carryover volume (GL) held by irrigators and the environment on the major irrigation systems in the Murray Dairy Region.
| System | 2011-12 | 2012-13a | 2013-14 | 2014-15 | 2015-16b |
|---|---|---|---|---|---|
| Goulburn (GL) | 1046 (25)c | 970 (11) | 431 (15) | 396 (60) | 311 (217)d |
| Vic Murray (GL) | 1209 (175) | 1240 (163) | 755 (88) | 280 (144) | 290 (261) |
| NSW Murray General Securitye | Not available | 690 | 302 | 501 | 501 |
| Murrumbidgee General Securityf | 612 | 612 | 551 | 592 | 388 |
aCarryover volumes on the Victorian Murray system have been influenced by changing the ‘spill’ dam from Dartmouth to Hume on 1 July 2013. Having the spill dam as Dartmouth initially meant that less water was spilt in the Victorian Murray system prior to 2013-14 which has affected the volume of water carried over.
bEstimated based on unused water as of 15 May 2015.
cEnvironmental carryover volumes for 2011-12 season sourced from Australian Government Commonwealth Environmental Water Fact Sheet – Carryover of Commonwealth Environmental Water – Northern Victoria.
dCarryover volumes for the environment is based on actuals as of 15 May 2015. This figure may be reduced at 30 June depending on the volume of environmental water used from 15 May to the end of June.
eWater carried over against NSW Murray GS includes water carried over by the environment. The carryover split between the environment and irrigators is not readily available. Source – NSW Office of Water Media releases.
fWater carried over against Murrumbidgee GS includes water carried over by the environment. The carryover split between the environment and irrigators is not readily available. Source – NSW Office of Water Media releases.
It is important for irrigators to know the carryover volumes from one season to the next and who owns that water, as it does contribute to the total water available which in turn influences market behaviour. Irrigators can source this information at the NVRM website.
Table 5: Water allocations over the past 20 years.
| Season | Vic Murray HRWS |
Vic Murray LRWS |
Goulburn HRWS |
Goulburn LRWS |
Campaspe HRWS |
Campaspe LRWS |
Broken HRWS |
Broken LRWS |
Loddon HRWS |
Loddon LRWS |
NSW Murray High Security |
NSW Murray General Security |
NSW M'bidgee High Security |
NSW M'bidgee General Security |
SA Class 3A |
|---|---|---|---|---|---|---|---|---|---|---|---|---|---|---|---|
| 1995/96 | 100 | 100 | 100 | 50 | 100 | 100 | - | - | - | - | 100 | 100 | 100 | 100 | 100 |
| 1996/97 | 100 | 100 | 100 | 100 | 100 | 120 | 100 | 70 | 100 | 90 | 100 | 100 | 100 | 100 | 100 |
| 1997/98 | 100 | 30 | 100 | 20 | 100 | 90 | 100 | 70 | 100 | 10 | 100 | 84 | 100 | 90 | 100 |
| 1998/99 | 100 | 100 | 100 | 0 | 100 | 0 | 100 | 70 | 100 | 0 | 100 | 93 | 100 | 85 | 100 |
| 1999/2000 | 100 | 90 | 100 | 0 | 100 | 0 | 100 | 70 | 100 | 0 | 100 | 35 | 100 | 78 | 100 |
| 2000-01 | 100 | 100 | 100 | 0 | 100 | 120 | 100 | 70 | 100 | 0 | 100 | 95 | 100 | 90 | 100 |
| 2001/02 | 100 | 100 | 100 | 0 | 100 | 80 | 100 | 70 | 100 | 0 | 100 | 105 | 100 | 72 | 100 |
| 2002/03 | 100 | 29 | 57 | 0 | 100 | 0 | 100 | 0 | 57 | 0 | 100 | 10 | 100 | 38 | 100 |
| 2003/04 | 100 | 0 | 100 | 0 | 100 | 0 | 100 | 70 | 67 | 0 | 100 | 55 | 95 | 41 | 95 |
| 2004/05 | 100 | 0 | 100 | 0 | 39 | 0 | 100 | 70 | 100 | 0 | 97 | 49 | 95 | 40 | 95 |
| 2005/06 | 100 | 44 | 100 | 0 | 31 | 0 | 100 | 70 | 100 | 0 | 97 | 63 | 95 | 54 | 100 |
| 2006/07 | 95 | 0 | 29 | 0 | 0 | 0 | 77 | 0 | 0 | 0 | 69 | 0 | 90 | 10 | 60 |
| 2007/08 | 43 | 0 | 57 | 0 | 18 | 0 | 71 | 0 | 5 | 0 | 50 | 0 | 90 | 13 | 32 |
| 2008/09 | 35 | 0 | 33 | 0 | 0 | 0 | 0 | 0 | 0 | 0 | 95 | 9 | 95 | 31 | 18 |
| 2009/10 | 100 | 0 | 71 | 0 | 0 | 0 | 17 | 0 | 3 | 0 | 97 | 34 | 95 | 31 | 62 |
| 2010/11 | 100 | 0 | 100 | 0 | 100 | 100 | 100 | 100 | 100 | 0 | 100 | 100 | 100 | 105 | 67 |
| 2011/12 | 100 | 0 | 100 | 0 | 100 | 100 | 100 | 100 | 100 | 0 | 100 | 100 | 100 | 105 | 100 |
| 2012/13 | 100 | 0 | 100 | 0 | 100 | 100 | 100 | 100 | 100 | 0 | 100 | 100 | 100 | 105 | 100 |
| 2013/14 | 100 | 0 | 100 | 0 | 100 | 46 | 100 | 100 | 100 | 0 | 100 | 100 | 95 | 68 | 100 |
| 2014/15 | 100 | 0 | 100 | 0 | 100 | 0 | 100 | 100 | 100 | 0 | 97 | 61 | 95 | 51 | 100 |
| 20Y Average | 93% | 31% | 87% | 6% | 73% | 40% | 88% | 59% | 75% | 5% | 95% | 63% | 97% | 64% | 86% |
| 10Y Average | 87% | 4% | 79% | 0% | 55% | 35% | 77% | 57% | 61% | 0% | 91% | 57% | 96% | 57% | 74% |
Notes: Victorian water entitlements were unbundled and separated from land in July 2007. Allocations prior to 2007/08 listed under HRWS and LRWS refer to Water Right and Sales. Reflects the approximate final ‘equivalent’ final water allocations after 52% of water in allocation accounts was suspended in 2006/07 and reinstated in 2007/08. The allocations shown are effective end-of-season allocations available after a reduction of 5per cent due to severe drought in 2006/07. This allocation was repaid in 2007/08 and is in addition to the allocation shown above for that year. Average 20-year allocation line is actually 19-year average for Broken and Loddon systems. 2014/15 allocations are actual allocations as of 1 April 2015.
The changes mean that:
- The old adage of more irrigated crop when water is plentiful (i.e. season 2013/14) still holds but how often will that be?
- Rice finds it harder to compete when the general security allocations are less than 100 per cent and the water price goes up like this season, though those who own entitlement are still profitable.
- There is a swing to maize/wheat/canola/soya bean rotations but must get high yields per ML to out-compete rice and to justify use of water at current prices. This also requires investment in on-farm irrigations systems.
- Cotton is moving south and offers potentially better returns, particularly when in rotation with maize and is likely to expand.
- New irrigation systems are being installed that enable non-rice crops but there are question marks over whether it should be fast flow or pressurised systems.
- There is a downside to the pressurised systems; possibly a higher development cost and operating cost (energy) and so the water savings are needed to justify the switch (where is the data to confirm this?). Can this development be justified without the farm efficiency subsidies? It generally costs around $2000-3000/ha to install these systems compared to surface irrigation of $1000-2000/ha. The operating costs for overhead systems are $30-40/ML compared to surface irrigation of $10/ML.
- Switched from ML/labour unit to $/ML as the key driver determining the crop choice.
- If the price of market water gets high enough then selling water is the best option. This has significant impacts to on-farm workload, farm inputs, maintenance of irrigation systems and knock on impacts to local traders. Do you know your selling price?
Recent field data
John Lacy’s recent data on irrigated cropping provides very valuable insights (Finley GRDC Update, 2014). It is worth remembering that the gross margin data is very valuable indicative information but it is suggested there are three important factors to also consider:
- Whilst the gross margins have used some real data such as number of sprays, fertiliser application, etc; other costs such as sowing or harvesting, etc have been standardised. Thus Individual gross margins will still vary from these figures as some people do things more efficiently than others. Thus understanding your own data using profit loss accounting data is important to know where you stand, though John’s data is a good starting point.
- The cost of purchasing water or the cost of owning the water (interest on debt) has not been included. These gross margins are fine if you own the water or have no debt, however it is a key consideration in whether you buy more water to expand the crop, or whether the gross margin gets so low that it is better to sell the water.
- The capital depreciation of the irrigation system is not included; e.g. a centre pivot has a limited life. The easiest way to reduce this cost per ML is to maximise the ML/ha i.e. summer crop or double crop, rather than spreading over a larger area such as top up irrigations for wheat crops. This is why rice is so cost effective in terms of layout costs. This issue is not as critical to short-term decisions on a seasonal basis when water is short because the amount of irrigable area is fixed and you apply the limited water the best way over the layout you have. However for long term decision about whether to undertake irrigation development the ML/ha and hence the $capital/ML is a key factor. If you always make decisions based on the short term eventually there is a day of reckoning, which these gross margins ignore.
From John Lacy’s data we see that:
- There are still a number of irrigated wheat crops that yield only 1t/ML with a gross margin of around $150/ML. At this yield it would have been almost better to sell the water this year. Similarly for canola yields of 0.5t/ML for flood and 1.0 for spray it may have been better to sell the water this year.
- There are a number of irrigated wheat crops that yield 2t/ML which have much better gross margins than rice and provide a reasonable return even if you had to buy the water at current prices.
- Canola needs 1t/ML extra yield to justify using the water and making a reasonable return.
- Irrigated faba beans need at least 1t/ML for flood and 1.5t/ML for spray to justify growing them (based soley on value of grain yield).
- Maize yields can be up to 3t/ML of silage and 2t/ML of grain but we need either centre pivot/linear or fast flow (<2 hours per bay) or bed systems with automation and irrigation scheduling as a start. At these yields maize is profitable. However, maize grain yields of less than 1.5t/ML are very marginal at current water values.
- Cotton will give a gross income of 1.2bale/ML or $600/ML. This is similar to maize and twice the rice income. At these returns cotton appears very attractive.
- Buying water at $125/ML is difficult to justify for growing to grow rice unless you have already committed to the crop, ie you have gambled on higher allocations and a falling price.
From other individual farm data we suggest that:
Making decisions
Short-term decisions
Determining what crop to grow, whether to buy water or sell is a very different decision at the start of the season compared to a longer-term strategy for a landholder. Within a season the decision to buy water to finish a crop or top up a winter cereal is also very different to whether to plan the crop in the first place. Too often we make a series of short-term decisions that lead us to an unfortunate outcome.
In many ways short-term decisions depend upon the allocation for NSW general security, which sets the price of water.
If the allocation is high at 100 per cent and at 2013/14 prices, then generally the more water used the better, even if you have to buy it.
If the allocation is reduced as per this season then:
- It is difficult to justify buying water for rice unless you have already assumed a high allocation. However most existing rice growers will use the water they own or have carried over and will not sell, and will still make reasonable returns.
- Using water to produce 1t/ML of cereal is barely justified and the water may have been better sold.
- If you can produce 2t/ML of cereal, 1t/ML of canola, 2t/ML of maize grain, or 1.2 bale/ML of cotton, then buying water is a profitable option. These yields are over and above the production generated from dryland crops.
- It is important to keep your farm business ticking over so that layouts and machinery are maintained and in good order over the long term. This means that it can be worth using water even at these prices rather than selling.
Longer-term decisions
Some of the questions that appear to be relevant for the irrigated cropping industry:
- What is your expectation of available water, i.e. how many years of reduced NSW general security allocations will there be?
- What is the price of water? It looks like the price of water will generally depend upon the returns from rice, i.e. in times of plenty of water the price reflects what rice growers will pay for extra water and in times of reduced allocations the price reflects the tipping point for when rice stops buying and thinks about selling. If the rice price drops then the market price for water will probably drop also?
- Using significant water on other crops will only occur if they outperform rice. There will always be some opportunistic use of water to top up cereals but for other crops to expand, rice is the benchmark. It appears that yields from wheat at 2t/ML, maize at 2t/ML and cotton at 1.2bale per ML all have double the income of rice per ML. It looks like these crops are going to expand? If they do expand this will put pressure on the rice industry.
- What about rice? Rice has advantages in periods of plenty of water with low capital and low labour. It also has advantages for those growers with existing layouts and those that don’t plan to expand. For those who own the water entitlements and are set up for rice it is still profitable to grow rice year in year out. Those who have retirement in view, have sufficient machinery, their own water and have little debt are likely to continue with rice. Those properties relying on the purchase of temporary water may struggle if there are a series of years where the allocations are less than 100 per cent and the prices are around $120. However, if rice lifted its yield per ML, i.e. new shorter season varieties then this could be a game changer.
- New irrigation development? Is it affordable without the government efficiency grants? Are the water savings there? Centre pivot/linear, fast flow system or bed systems?
- Can you develop cropping rotations that use sufficient water per ha to maximise the returns of the new irrigation development? Can you double crop or grow three crops every two years?
Key decision times
There are a number of critical times and the information required is:
Early March
- Autumn irrigation? Or carryover?
- How much unused irrigators’ water (NSW & Vic), water in reserve for Victoria and dry/wet
Late April
- Carryover? Winter plantings
- How much unused irrigators’ water (NSW & Vic), water in reserve for Victoria, and dry/wet
July/Aug
- Spring watering crops and/or Rice/summer cropping?
- Carryover and seasonal allocation probabilities
Nov
- Purchases to finish summer crops
- Carryover and seasonal allocations
Acknowledgments
A number of people’s ideas contributed to this paper including: Daryl Poole and George Warne from RMCG, John Lacy, Geoff McLeod and several farmers who provided their financial information.
Contact details
Rob Rendell
RMCG
PO Box 2410, Bendigo
(03) 5441 4821, 0428 510 642
rm@rmcg.com.au
RMCG Website
Was this page helpful?
YOUR FEEDBACK