Northern Winter Pulse Agronomy (Walgett 2015)
Author: Andrew Verrell and Leigh Jenkins (NSW DPI) | Date: 25 Feb 2016
Take home message
- Sow faba beans at 20 plants/m2 in north-west regions
- Sow chickpea at 15 plants/m2 in north-west regions
- Older cropping country is showing responses to applied P as well as Zn
Introduction
The 2015 season was characterised by frost events, episodic cold weather during flowering and terminal drought during grain fill. These seasonal conditions impacted heavily, reducing the potential yield of pulses across most areas of the northern NSW cropping zone.
The Northern Winter Pulse Agronomy project had a range of experiments covering a number of agronomic themes in 2015. This paper reports on the outcomes of variety x density experiments for fabas and chickpeas and nutrition experiments in north-west NSW.
Faba bean – variety x plant density experiments
What did we do?
Faba bean, variety x density, experiments were conducted at three locations across northern NSW in 2015. Three varieties were sown; Doza, PBA Warda and the new line PBA Nasma. Four target plant densities were examined; 10, 20, 30 and 40 plants/m2. All five trials were grown under dryland cropping conditions.
The three lines selected represent the two preferred commercial lines (Doza and PBA Warda) and the new large seeded line PBA Nasma. The difference in seed size for these commercial lines is shown in Figure 1 where PBA Nasma, on average, has seed that is 40% larger than Doza.
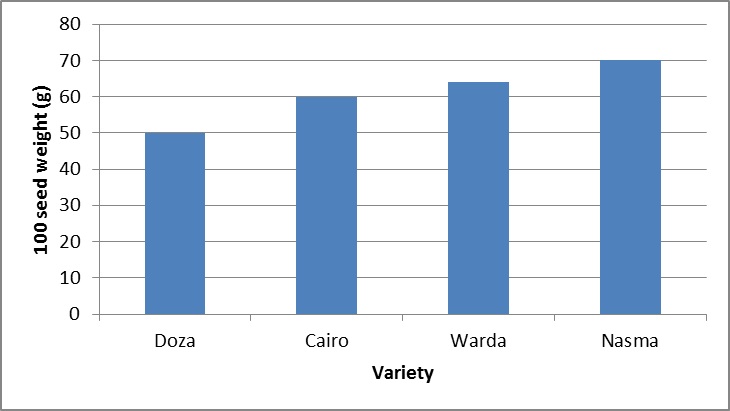
Figure 1. Average 100 seed weight (g) for selected faba bean varieties
(Varieties Doza, Cairo, Warda and Nasma shown in the graph above are protected under the Plant Breeders Rights Act 1994)
What did we find?
For grain yield, there were no significant interactions between variety and plant density, only main effects (see Table 1). PBA Warda and PBA Nasma out yielded Doza at Coonamble, with no significant difference in varieties at Bullarah or Cryon (Table 1). Grain yield had a significant response to plant density at Cryon, plateauing at 20 plants/m2.
Table 1. Faba bean grain yield (kg/ha) for the main effects, variety and plant density at three locations in 2015
|
Variety |
Grain yield (kg/ha) |
||
|
Bullarah |
Coonamble |
Cryon |
|
|
Doza |
1602 a |
2900 b |
1547 a |
|
Warda |
1687 a |
3280 a |
1700 a |
|
Nasma |
1685 a |
3452 a |
1686 a |
|
Plant density (plants/m2) |
Grain yield (kg/ha) |
||
|
Bullarah |
Coonamble |
Cryon |
|
|
10 |
1498 a |
3376 a |
1373 b |
|
20 |
1670 a |
3411 a |
1772 a |
|
30 |
1768 a |
3246 a |
1673 a |
|
40 |
1666 a |
3270 a |
1745 a |
Values with the same letter are not significantly different P=0.05
Chickpea – variety x plant density experiments
What did we do?
A series of chickpea variety x plant density factorial experiments have been conducted across north western northern NSW from 2011 to 2015.
Varieties examined were PBA HatTrick, PBA Boundary, Kyabra, CICA912 and CICA1007 at plant densities of 5, 10, 15, 20, 30 and 45 plants/m2. During 2011, 2012 and 2013 experiments were located at Coonamble and at Spring Plains in 2014 and Rowena in 2015.
Across all sites and years variety and plant density were significant as main effects but there were no significant interactions between variety and plant density except in 2015 at Rowena.
What did we find?
At Rowena in 2015 there was an interaction between variety and plant density (see Figure 2). Kyabra outperformed all cultivars at 5 plants/m2, plateaued between 10-15 plants/m2, then declined in yield as density increased. All varieties had similar trends, except PBA HatTrick which peaked in grain yield at 30 plants/m2. Kyabra has been a consistent performer in this region in terms of grain yield.
The plot of grain yield versus plant density for different locations over the last five years is shown in Figure 3. The response of yield to plant density was flat from 15 to 45 plants/m2 (see Figure 3) for most years. The high yielding response at Coonamble in 2011 was due to a high rainfall year (381mm) while the other years received less than 150mm.
Densities below 15 plants/m2 can expose crops to severe yield loss due to virus, and very low density crops have an increased tendency to lodge with branches breaking and pods on the ground.
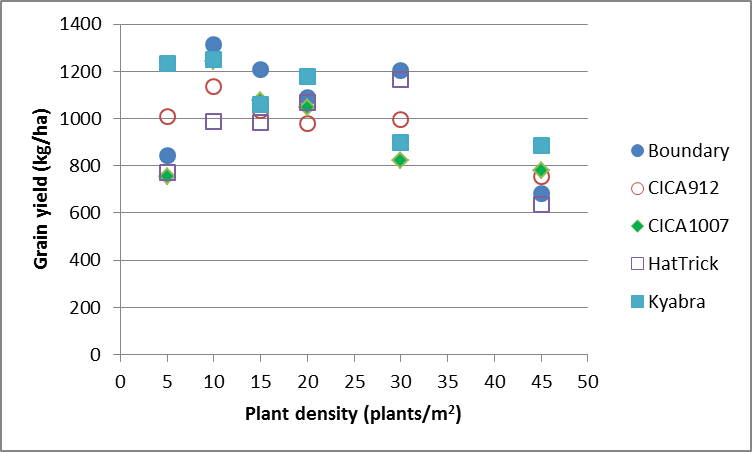
Figure 2. Effect of Chickpea variety x density on grain yield (kg/ha) at Rowena for 2015
(Varieties PBA Boundary, Kyabra and PBA HatTrick shown in the graph above are protected under the Plant Breeders Rights Act 1994)
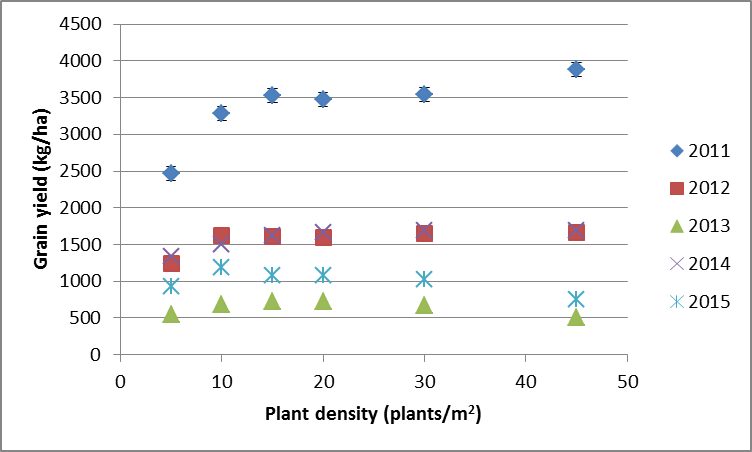
Figure 3. Effect of plant density on grain yield (kg/ha) at Coonamble (2011, 2012, 2013), Spring Plains (2014) and Rowena (2015)
Chickpea nutrition
What we did?
Nutrients were applied in a nutrient omission format at four locations over the last two years. In nutrient omission trials, one nutrient is deliberately omitted in each treatment, while all other nutrients are applied at rates considered as non-limiting. It is therefore not possible to determine optimum nutrient application rates directly from the results of these experiments.
The 12 treatments were; Zero nutrients, All nutrients, - N, - P, - K, - Ca, - B, - Cu, - Zn, - Mn, - Mg, - Fe.
Application method varied between nutrients. Both P and N were applied at sowing, at 10 kg P/ha as Trifos and 10 kg N/ha as urea, respectively. Ca, Mg, Zn, Mn, Cu and Fe were applied as chelates in a foliar spray. K was applied as Potassium citrate and B as Boron ethanolamine as foliar sprays. Besides N and P (applied at sowing), all other nutrients were sprayed on the crop at mid vegetative period.
PBA HatTrick was sown at all sites at 30 plants/m2.
What we found?
Grain yield data for the four experimental locations is contained in Table 2.
In 2014 responses were inconclusive with a negative yield response at Coonamble from applying a full set of nutrients. In 2015, Rowena showed no significant responses to applied nutrients. However, at Coonamble in 2015 there were responses. The 2015 Coonamble site showed grain yield responses to applied Zn (by 7%), applied P (by 4%) and Fe (by 8%). The Coonamble site, a grey-brown vertosol lies east of the town and has been cropped since the early 1960’s.
Table 2. Effect of selected nutrient omission treatments on grain yield (kg/ha) in chickpea at northern NSW sites
|
Treatment |
Coonamble 2015 |
Rowena 2015 |
Spring Plains 2014 |
Coonamble 2014 |
|
Minus-Zn |
1816 b |
788 a |
1427 b |
770 a |
|
Minus-P |
1864 b |
986 a |
1553 a |
787 a |
|
Minus-Fe |
1804 b |
|||
|
All |
1947 a |
1019 a |
1479 ab |
654 b |
Values with the same letter are not significantly different P=0.05
Conclusion
Limited data from the first year of trial results in 2015 suggests that for northern and western sites 20 plants/m2 is a preferred target plant density for faba beans.
Large seed in faba beans does not necessarily confer higher yield.
For chickpeas, when sowing within the optimum sowing window mid May – mid June, sow at 15 plants/m2.
Older cropping country is showing responses to applied P as well as Zn and Fe.
Acknowledgements
The research undertaken as part of project DAN00171 is made possible by the significant contributions of growers through both trial cooperation and the support of the GRDC, the author would like to thank them for their continued support. Thanks to Michael Nowland, Mat Grinter, Jayne Jenkins and Gerard Lonegran (NSW DPI) for their assistance in the trial program.
Contact details
Dr Andrew Verrell
NSW Department Primary Industries
Mb: 0429 422 150
Email: andrew.verrell@dpi.nsw.gov.au
GRDC Project Code: DAN00171,
Was this page helpful?
YOUR FEEDBACK