Ranking cereal varieties for frost susceptibility using frost values southern
Author: Tim March, Michael Laws and Paul Eckermann (School of Agriculture, Food & Wine, The University of Adelaide) Brenton Leske, Ben Biddulph and Jason Eglinton (Department of Agriculture and Food Western Australia) | Date: 09 Feb 2016
Background
Frost has been estimated to cost Australian growers around $360 million in direct and indirect yield losses every year.
Breeding new cereal varieties with improved frost tolerance is one solution to minimise financial losses due to frost. Historically, little has been known about variation for frost tolerance in Australian varieties, leading to the assumption that little variation exists. The limited knowledge about frost tolerance is also due to the practical difficulties in measuring frost damage under field conditions due to the sporadic and dynamic nature of frost events. However, successive GRDC-funded projects have enabled dedicated frost screening nurseries to be developed in SA, WA and NSW to measure susceptibility to reproductive frost under minor frosts with greater accuracy and repeatability.
Methodology
The frost susceptibility data is generated from research trials grown in Loxton (SA), Merredin and Wickepin (WA) and Narrabri (NSW) in 2012, 2013 and 2014. To improve the predictions for these environments, similar trials grown in Loxton SA in 2010 and 2011 were also included in the analysis.
At each site, between six and 11 times of sowing (TOS) are planted as separate blocks at approximate equidistant thermal time from around April 15 to June 15 at each site to increase the probability that the test lines are at the flowering stage when a natural frost event occurs. On-site weather stations monitor the temperature at the crop canopy. Following a frost event, 30 flowering heads are tagged per plot and then assessed for frost induced sterility (FIS) of the outside grains during grain fill four to six weeks later. This approach minimises confounding effects due to maturity and enables repeatable results over successive seasons and sites. Different research agencies conducted the trials in each state, although the same protocols were used. Table 1 gives a summary of each trial.
The varieties that were grown included a selection of the most commonly grown wheat and barley varieties in the three states, varieties which had been well characterised previously for frost tolerance and other varieties/breeding lines of particular interest to breeding companies.
| State Location |
Location | Year | Number of
sowing dates |
Number of varieties |
|---|---|---|---|---|
| SA | Loxton | 2010 | 6 | 35 |
| 2011 | 6 | 36 | ||
| 2012 | 11 | 65 | ||
| 2013 | 10 | 65 | ||
| 2014 | 10 | 72 | ||
| WA | Merredin | 2012 | 7 | 48 |
| Wickepin | 2013 | 6 | 54 | |
| Wickepin | 2014 | 8 | 72 | |
| NSW | Narrabri | 2012 | 7 | 30 |
| 2013 | 7 | 32 | ||
| 2014 | 7 | 32 |
Results and discussion
When cereal varieties are flowering on the same day and a frost occurs there is a wide range in frost susceptibility within commercial varieties under mild reproductive frost conditions (minimum temperature -1° to -3°C) (Figure 1). Under very severe frost (for example -8°C) or multiple minor frosts (several nights of -2° to -4°C) all varieties are equally susceptible, resulting in 100 per cent sterility. It should be noted that the relationship between canopy temperature and FIS is complex and can be confounded by TOS, variety and environmental factors. Understanding this relationship will be the focus of ongoing research.
Frost values
The relative ranking of the frost susceptibility has been expressed as a frost value (FV) for each variety in each environment. FV's are presented as positive or negative differences relative to the average FIS of all varieties in the current data-set for a given year and site; lower values are better. The units of measurement for FV's relate to the transformed FIS but are not important in terms of variety selection because selection decisions are based on comparative performance of varieties.
Therefore, it is the difference between FV's that is critical. When using FV's for selection decisions it is recommended that growers and advisers consider not just a single environment or year, but a number of relevant environments. This allows examination of stability of variety performance over a range of environments which are prone to frosts.
FV's can be displayed graphically for a set of either wheat or barley varieties of interest using the interactive tool that is available from NVT Online an example of this is shown in Figure 2.
The rankings are currently based on the variation in wheat and barley varieties to maintain grain number under minor reproductive frosts. Under reproductive/floret or head frosts this is the main component of yield affected when yield is a function of grain size and grain number. However, this may not be the case if there is variation in the length of season and the ability of varieties to compensate due to late tillers, synchronisation of flowering time, and plasticity of grain number.
Therefore, is it critical that varieties are first selected on local adaptation and yield first, and FV's are only used to identify and manage frost risk.
Further research is ongoing to validate the yield relationship with FIS (DAW00234) and also compensation ability (CSP00180) as part of the GRDCs multidisciplinary National Frost Initiative.
In addition, it is important to note that the research to date has not conclusively assessed if the variation in reproductive frost susceptibility is related to susceptibility to frost during stem elongation and grain filling.
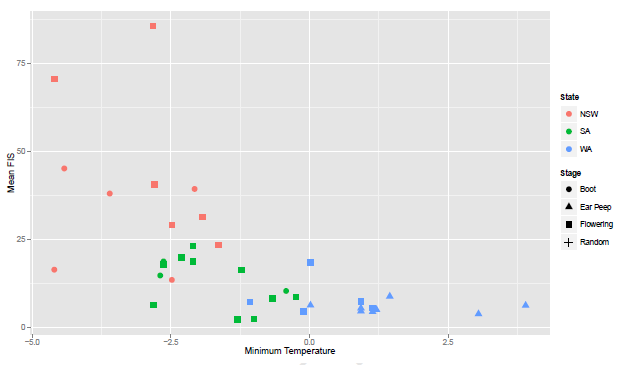
Figure 1: Relationship between minimum canopy temperature in three environments and raw FIS data for each wheat tagging event, at different development stages in 2012-2013.
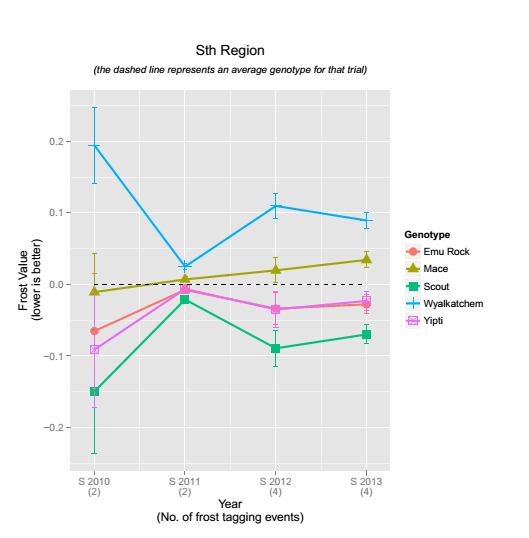
Figure 2: Frost value graph for five wheat varieties tested at Loxton (SA). Each FV for each variety is presented along with prediction standard error bars. The number of tagging events is indicated in brackets for each site/year. Lower FV's are better.
Conclusion
As frost exerts a complex production constraint in cropping systems it requires a package of risk management strategies. These strategies should include pre-season, in-crop and post-frost event management tactics. They should be regularly reviewed and updated as part of annual farm management planning. Variation in cereal varieties for reproductive frost susceptibility is just one component of a management strategy and may be used to fine-tune variety selection to manage the risk of frost.
Acknowledgements
The authors acknowledge Prof Brian Cullis, Dr Simon Diffey, and Mr Paul McGowan from Statistics for the Australian Grains Industry (SAGI) for statistical analysis of the data and the development of the FV system. This research was funded by the GRDC and is part of the National Frost Initiative.
Contact details
Tim March
University of Adelaide
08 8313 6700
tim.march@adelaide.edu.au
Jason Eglinton
University of Adelaide
08 8303 6553
jason.eglinton@adelaide.edu.au
Ben Biddulph
DAFWA, South Perth
08 9368 3431
ben.biddulph@agric.wa.gov.au
Was this page helpful?
YOUR FEEDBACK