Pulse market update factors likely to impact supply demand and pricing in the next six to twelve months
Author: Peter Semmler (Agrisemm Global Brokerage) | Date: 02 Aug 2016
Introduction
My objective for this paper/presentation is to cover off on the season that was, bring you all up to speed for the current season and then work through our prediction for this year’s harvest and some ideas to consider before you do it all again in 2017.
I am sure many of you are aware that 2016 has been designated by the United Nations as the International Year of Pulses. Driven mainly by our colleagues in Canada and the United States there have been a plethora of events, conventions, farmer days and competitions all with the objective of increasing awareness of the extensive benefits of pulses from a nutritional, agronomic and sustainable point of view. In 2050 which for many of us doesn’t seem that far away there will be another two billion people on the earth. It is therefore expected that the market for pulses will continue to grow as the world demand for protein inexorably continues to rise.
Figure 1 neatly illustrates both the problem and the solution. The long term nature of the pulse industry is very sound and global consumption can only increase.
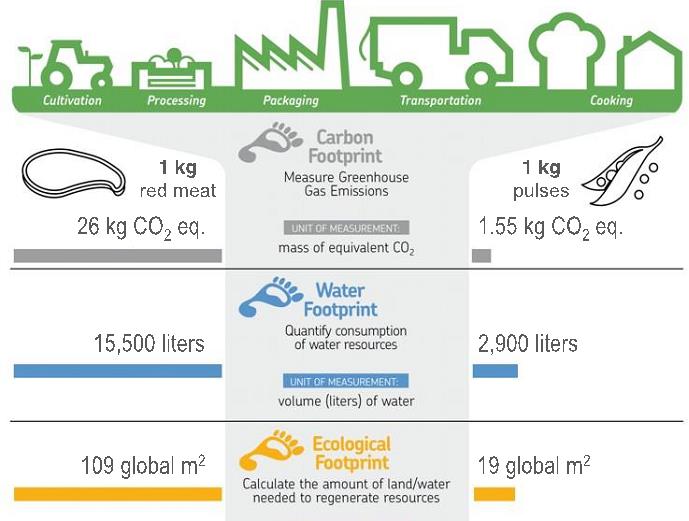
Figure 1: Comparison of the impact of 1kg of red meat and 1kg of pulses on carbon, water and ecological levels (Source: IYP 2016 material).
The year that was
Field peas
Australian peas have a bitter taste compared to yellow peas from Canada, Ukraine and Russia. Australia has lost market share in recent years to Pakistan and Bangladesh where price has been more influential than flavour. Historically there have been strong markets for value added yellow split peas. However markets such as Colombo and Malaysia are now buying more peas farmer dressed (FD) bulk and splitting them at destination.
Export prices for peas have been too high for inclusion by stockfeed compounders. To make economic sense for this sector, prices need to be low to mid A$300. We expect prices to stay in a similar range as that experienced during July 15 to March 16 as the magnitude of the large Canadian crop will impact from August 2016 onwards. The new crop of Ukraine/Russian yellow peas are trading into India at US$365 or equivalent to A$370 delivered to packer. Figure 2 indicates prices for field peas during the 2015/16 season and predicted 2016/17 season (the latter is for shipment in November- December 2016).
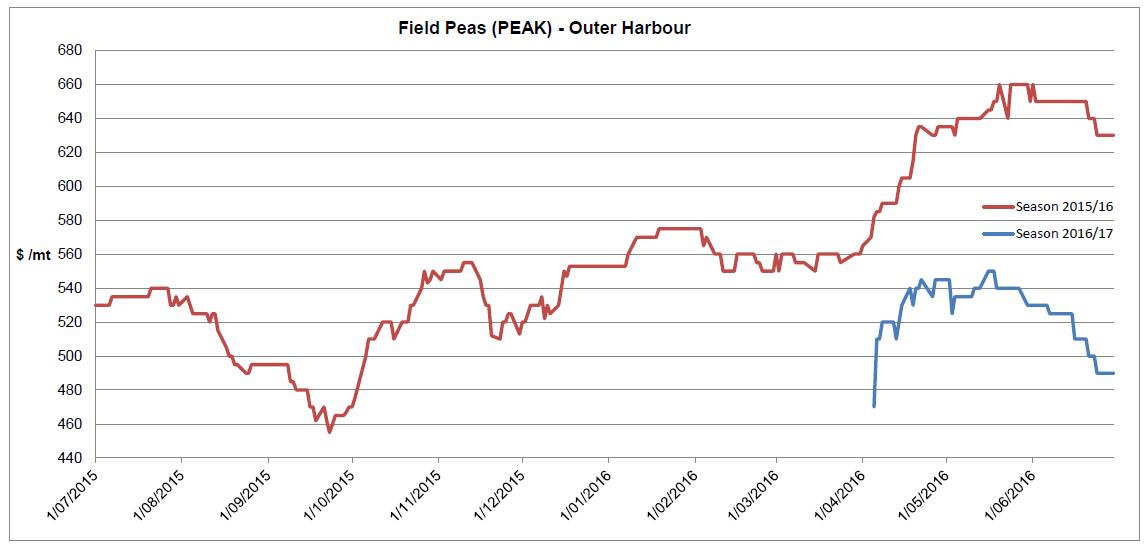
Figure 2: Prices for field peas during the 2015/16 season and predicted 2016/17 season.
In summary, the message for field peas is ‘steady as she goes’. Supply will be from areas where higher values pulses are not viable.
Faba beans
A picture is worth 1000 words and the price graph for faba beans is no exception (Figure 3). Many Yorke Peninsula growers have dropped fabas from their rotation this year, which appears to be a very prudent decision. The product has dropped A$200/mt in three months! Egypt buys 70 per cent of the Australian faba bean crop each year. This year has been a difficult year for the Egyptians. Tourism numbers are drastically down, there has been a high degree of political instability, hard currency has been rationed and controlled by the Central Bank and their exchange rate has dropped from 6.5 to over 11 Egyptian pounds to the US dollar. Most Australian companies who exported faba beans to Egypt in the last 15 months have experienced a loss of some magnitude, as well as delayed payments and other frustrations.
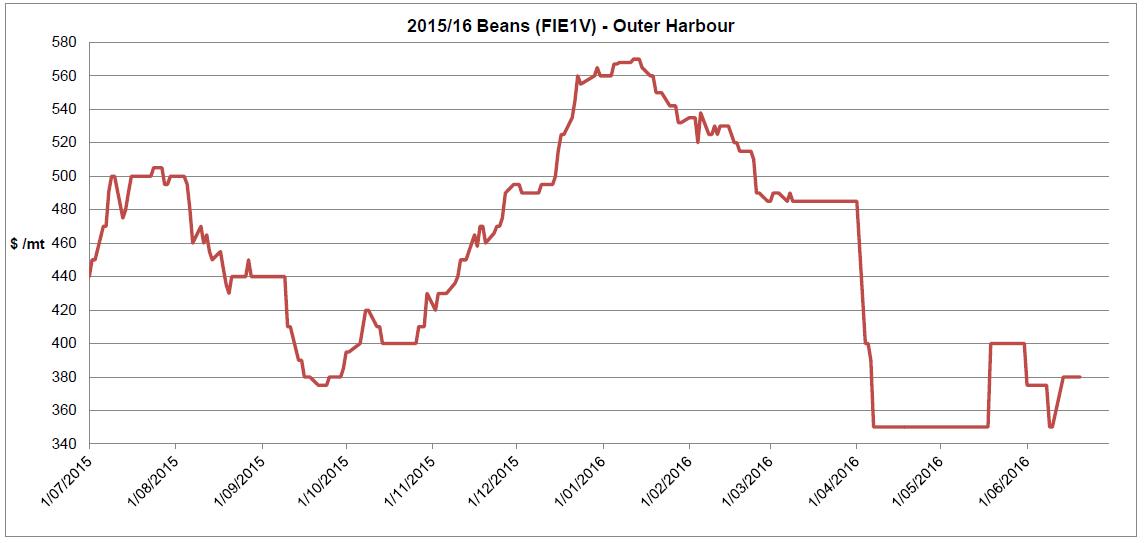
Figure 3: 2015/16 prices for Fiesta type (FIE1V) faba beans.
There has been minimal new crop business from any origin which supports the view there is still a lot of stock at destination.
At the moment trades are expecting a new crop price of around A$350-380 delivered to packer. There could however be some upside if our dollar comes off the current highs.
In the longer term, in addition to competition from the traditional sellers such as the UK and France, a number of Baltic countries such as Latvia, Lithuania and Sweden all have greater than 15 per cent of their average areas planted to faba beans and the Ukraine and Russia will be actively competing for market share.
New crop offers for these origins are around US$300-320 which equates to A$305 delivered to the packer. In previous years Egyptians were prepared to pay premiums of between US$70-100 for beans sourced from Australia. However, with the parlous state of the economy and the weak Egyptian pound, price is now everything for the majority of the population and the cheaper origins are just as popular.
In summary, faba beans are showing up as the least attractive pulse option for 2017.
Lentils
Australian lentils are well adapted to cover the needs of buyers in the major consumption markets (Figure 4).
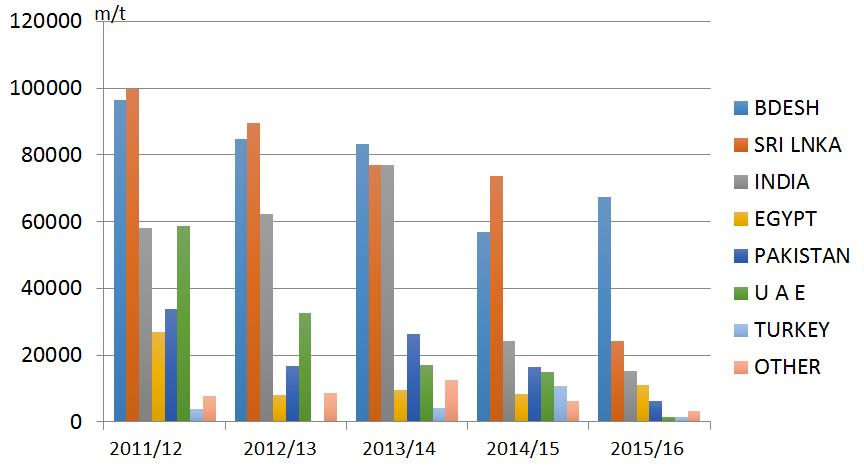
Figure 4: Destination export markets for Australian lentils from 2011/12 to 2015/16.
In my opinion, we are fortunate in Australia to have access to the best two lentil breeders in the world; Dr Michael Materne and Dr Bert Vandenberg.
Figure 5 reinforces the old adage ‘timing is not the only thing it’s everything’. While famers were all luxuriating in the amazingly high prices around Christmas, albeit on reduced production and some quality issues, the scene was being set for an amazing next season.
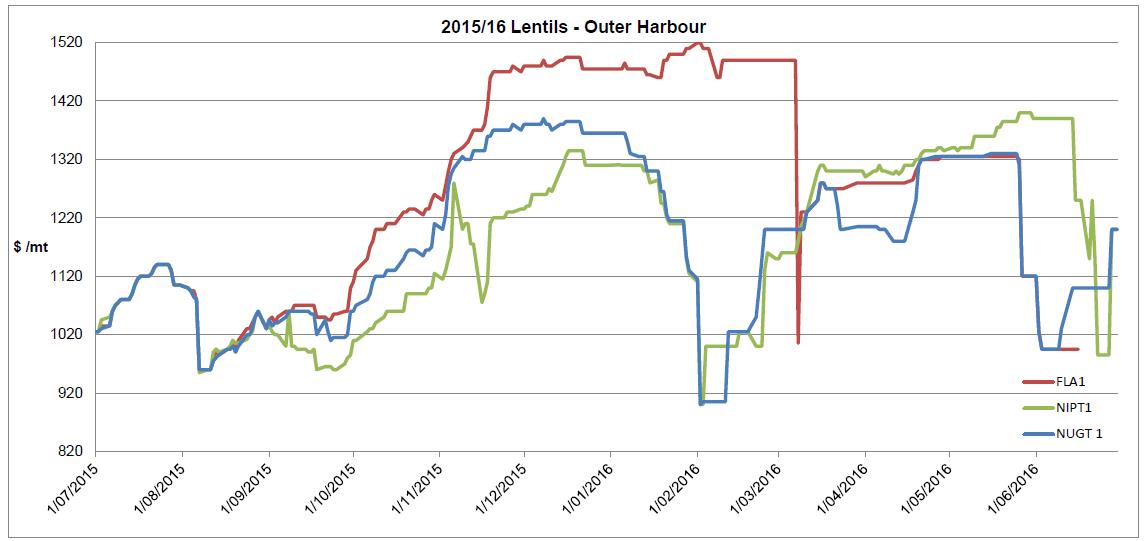
Figure 5: 2015/16 prices for Flash type Grade 1 (FLA1), Nipper type Grade 1 (NIPT1) and Nugget type Grade 1 (NUGT1) lentils.
Figure 6 demonstrates global lentil production for a number of countries. The bottom segment is Australian production and the segment directly above is Canadian production. Figure 6 illustrates how quickly Canadian farmers were to respond to the high prices and low stock levels in late 2015 planting a record 5.84 million acres of lentils as estimated by Stat Canada.
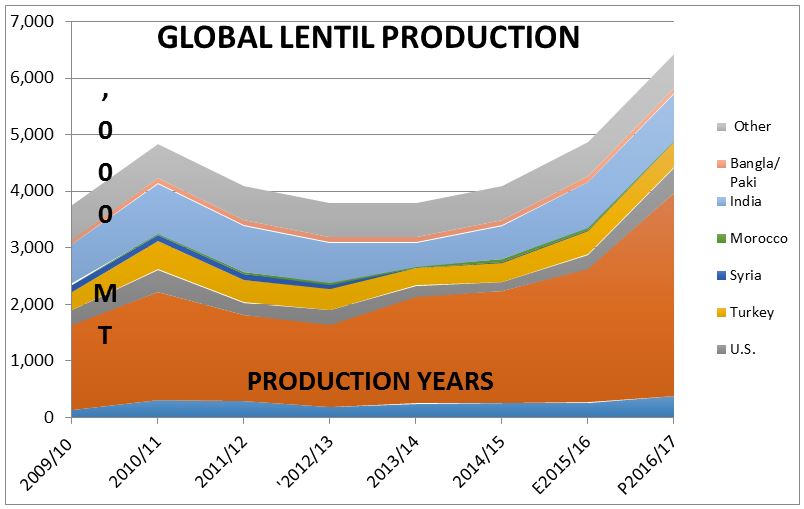
Figure 6: Global lentil production (‘000 mt) for a number of countries.
Current (2016/17) yield expectations for Canada are between 3.85 and 4.2 million tons of which 2.95 to 3.2 million tons will be red lentils (Figure 7). Globally lentil production this year is forecast at 6.416 million tons which is up over 30 per cent compared to last year. Australian production is forecast to increase around 45 per cent to 380,000 mt (Table 1).
The harvest in Canada will start in 30 days. While the predictions are daunting (Figure 7) recent weather events will impact on the final production number.
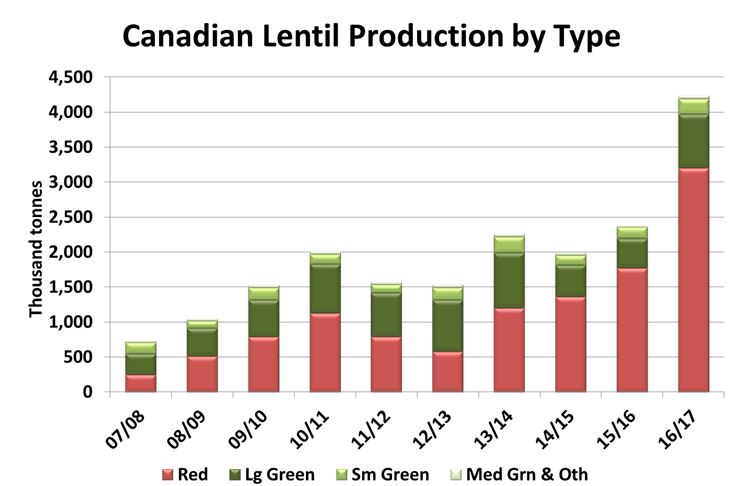
Figure 7: Canadian lentil production by type from 2007/08 to 2016/17.
Table 1: Lentil production (‘000 mt) for selected major producers.
| Crop Year/Country | 2013/14 | 2014/15 | E2015/16 | P2016/17 |
|---|---|---|---|---|
| Australia | 246 | 250 | 260 | 380 |
| Canada | 1,886 | 1,987 | 2,373 | 3,581 |
| United States | 198 | 153 | 240 | 450 |
| Turkey | 305 | 345 | 425 | 450 |
| Syria | 10 | 10 | 10 | 5 |
| Morocco | 30 | 60 | 55 | 35 |
| India | 425 | 585 | 800 | 825 |
| Bangladesh/Pakistan | 85 | 90 | 90 | 90 |
| Other | 600 | 600 | 600 | 600 |
| Total | 3,785.3 | 4,080.0 | 4,853.0 | 6,416 |
The years ahead
While I am an advocate of delaying paddock planning to enable collection of as much marketing information as possible, in 2016 the time line was very tight and lentil prices were very strong. Hence the market has reacted by:
- Substantially increasing production, and;
- significantly lowering prices.
Growers will have to navigate a marketing year where the whip has changed hands and the buyer is calling the shots.
On the facts we know today the old strategy of ‘hold and hope’ may not be the best solution . Some Canadian forecasters are already predicting a carryover of 700,000 mt of mainly red lentils into the 2017/18 crop year.
When planning for the 2017-18 season the following points are worthy of consideration:
- Does the premium between Flash and Imi types adequately cover the extra costs of chemical?
- Are kabuli chickpeas a more profitable option than lentils?
- Are desi chickpeas a more profitable option than lentils?
- Will green lentils be a more profitable option than red lentils? Today the estimated premium for green lentils would be A$250 +
Useful resources
Contact details
Peter SemmlerPrincipal Agrisemm Global Brokerage
U 4 262 Melbourne Street, North Adelaide SA 5006
0412 271 732
peter@agrisemm.com
Was this page helpful?
YOUR FEEDBACK