South Australian farmland values 2015 report
Author: Ag Answers (Rural Finance) | Date: 22 Aug 2016
Introduction
The value of land underpins farming businesses and rural communities. Understanding farmland values is important to everyone in agribusiness, especially Australia’s farmers.The Ag Answers Australian Farmland Values 2015 report is based on actual farm sales since 1995 using data collected by the official government agency in each state and territory, which is then compiled by APM PriceFinder.
The analysis draws on more than 220,000 transactions over 20 years, accounting for 264 million hectares of land with a combined value of $124 billion.
The national median* farmland price increased by 5.3 per cent in 2015. This follows a 6.8 per cent increase in 2014 and a 2.2 per cent decrease in 2013.
The performance of farmland prices in different states was mixed in 2015. The median farmland price increased in Tasmania (+12.8%), Queensland (+3.3%), New South Wales (+10.2%) and Western Australia (+10.6%), but fell in Victoria (-2.3%), South Australia (-1.9%) and the Northern Territory (-6.4%) compared to the previous year.
In all states, the median price has trended higher over the past decade with average annual growth exceeding three per cent in most states. As inflation has run at 2.8 per cent over the same period, this indicates real growth in farmland values. Although the median price has remained high over the past decade, the number of transactions** has trended lower.
Extend the investment horizon to 20 years and the farmland value growth picture becomes better still, with the median price in most states recording average annual growth above 5.5 per cent (Figure 1).
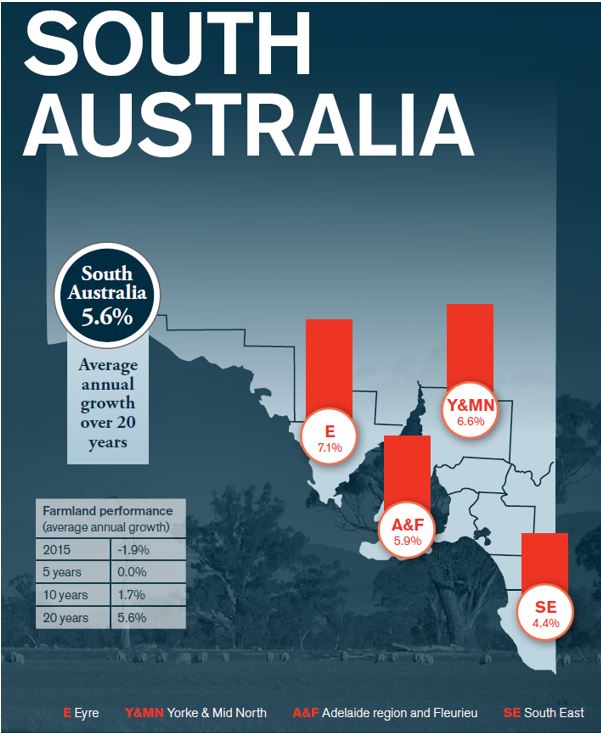
Figure 1: Farmland performance measured as growth in farmland prices for the different regions in South Australia..
About the research
Farmland prices are a function of many variables including, but not limited to rainfall, location, agricultural industry, productivity, land quality, sentiment, interest rates, commodity prices and the performance of the wider economy. To isolate the reason for a particular movement in the median price for a region is complex. Therefore, the focus of the report is to describe regional and state trends more so than the drivers behind the observed trends.
The report is a guide to the market value trends of commercial farming property and is not intended for use as a valuation tool. A qualified professional is required to assess the value of a property.
This analysis tracks the median price of commercial farmland in dollars per hectare by eliminating, where possible, metropolitan and small block sales, as well as sales where one party has compulsory powers. Further, small farms are excluded to limit the impact of ‘lifestyle farming’ on the results.
As property settlement periods vary, some 2015 sales will not be captured in this report at the time of publication. The median price for the most recent year is a preliminary one and will be revised at least annually.
The prices used in the report are based on the total sale price and therefore include the value of capital improvements. Growth in values may reflect an element of capital improvement on properties. Similarly, if water entitlements are attached to a land title and sold with the property the value of the water will be included in the sale price. If water entitlements are sold separately from the land, this value will not be captured in the sale price.
*The report uses medians to provide a measure of the mid-point of farmland prices as a guide to market activity. Compared with an average, the median is not as readily distorted by unusually high or low prices. Even so, in areas where there have been very few sales, the results should be viewed with caution as the year-on-year change in median price may not be indicative of an actual change in farmland value. A higher proportion of lower-priced sales can result in a lower median and vice-versa.
**Farmland sales volume is reported as the estimated number of transactions. Farms are sold as single or multiple lots, which obscures the view of the number of farms sold, particularly in cases where one farm is sold as multiple lots to multiple buyers. Accordingly, the ‘number of transactions’ should not be interpreted as the number of farms sold and should only be used as a guide to market activity.
State performance
The median value of South Australian farmland decreased by 1.9 per cent in 2015. This follows an increase of 5.2 per cent in 2014.There have been three distinct periods of growth in the median farmland price (Figure 2 and 3):
- Values grew steadily between 1995 and 2002, with average annual growth of 4.5 per cent.
- Rapid annual growth of 13.7 per cent occurred between 2003 and 2008.
- Since 2008 the median price has been stagnant with annual growth of 0.2 per cent.
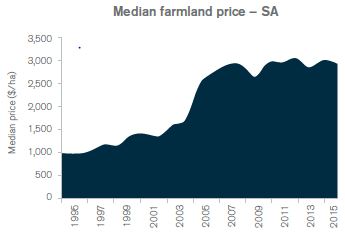
Figure 2: Median farmland price ($/ha) growth for SA farmland from 1995 to 2015.
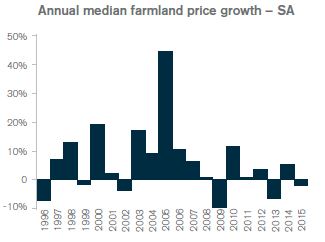
Figure 3: Annual median farmland price growth (%) for SA farmland from 1995 to 2015.
The number of farmland transactions increased by 5.1 per cent in 2015. The number of transactions has increased in the last two years from a low of 555 in 2013 to 678 in 2015 (Figure 4).
A rise in the number of transactions drove an increase in the total area of farmland traded, up to 210,000 hectares. This is the largest area traded since 2003 and represents approximately 1.7 per cent of improved farmland in South Australia.
The total value of farmland traded in South Australia reached a new high of $414 million in 2015.
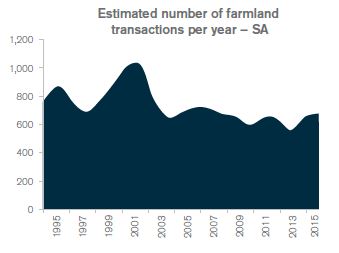
Figure 4: Estimated number of farmland transactions for SA farmland from 1995 to 2015.
Improvement in median values was strongest on the Eyre Peninsula (+24.4%), followed by the Adelaide region and Fleurieu Peninsula (+8.5%). Median values on the Yorke Peninsula, in the Mid North and the South East declined in 2015 (Figure 5, Table 1). Nevertheless, the long-term trend across the state has been one of growth.
Farmland values are based on all farmland (including improvements), not just arable land. Due to the structure of land ownership and a lack of data, the arid areas of South Australia are not covered in this report.
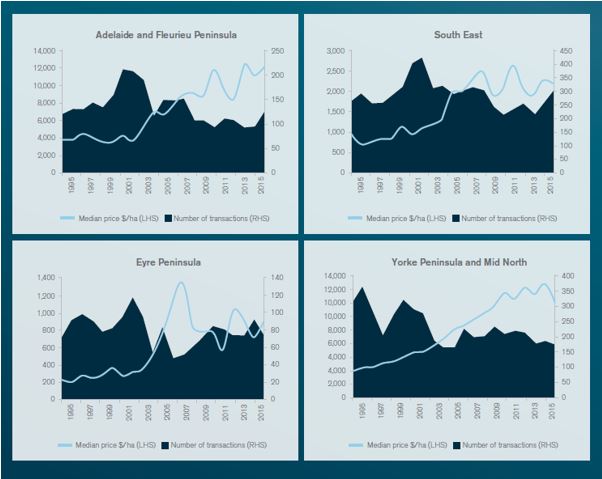
Figure 5: Farmland performance values for regions within South Australia.
Table 1: Farmland sales by municipality – South Australia.
| Municipality | Region | Median $/ha | Est. # of transactions 2015b | ||
|---|---|---|---|---|---|
| 2015a | 3yr average | ||||
| Adelaide Hills | Adelaide and Fleurieu Peninsula | 20,945 | 19,432 | 14 | |
| Alexandrina | Adelaide and Fleurieu Peninsula | 11,504 | 12,088 | 42 | |
| Barossa | Adelaide and Fleurieu Peninsula | 13,296 | 14,890 | 13 | |
| Barunga West | Yorke Peninsula and Mid North | 3,954 | 4,441 | 7 | |
| Berri Barmera | South East | 1,948 | 0 | ||
| Ceduna | Eyre Peninsula | 298 | 265 | 5 | |
| Clare and Gilbert Valleys | Yorke Peninsula and Mid North | 9,628 | 8,689 | 10 | |
| Cleve | Eyre Peninsula | 985 | 880 | 6 | |
| Coorong | South East | 1,712 | 1,598 | 35 | |
| Copper Coast | Yorke Peninsula and Mid North | 2,947 | 3,749 | 8 | |
| Elliston | Eyre Peninsula | 640 | 494 | 6 | |
| Flinders Ranges | Yorke Peninsula and Mid North | 2,109 | 2,032 | 23 | |
| Grant | South East | 7,325 | 7,655 | 19 | |
| Kangaroo Island | Adelaide and Fleurieu Peninsula | 2,483 | 2,150 | 19 | |
| Karoonda East Murray | South East | 547 | 542 | 8 | |
| Kimba | Eyre Peninsula | 735 | 779 | 19 | |
| Kingston | South East | 3,185 | 2,836 | 7 | |
| Light | Yorke Peninsula and Mid North | 8,663 | 9,701 | 16 | |
| Lower Eyre Peninsula | Eyre Peninsula | 2,743 | 3,349 | 14 | |
| Loxton Waikerie | South East | 591 | 601 | 23 | |
| Mallala | Yorke Peninsula and Mid North | 10,004 | 8,439 | 14 | |
| Mid Murray | South East | 1,264 | 1,210 | 56 | |
| Mount Barker | Adelaide and Fleurieu Peninsula | 18,214 | 18,260 | 16 | |
| Mount Remarkable | Yorke Peninsula and Mid North | 1,869 | 1,950 | 20 | |
| Murray Bridge | South East | 1,547 | 1,498 | 19 | |
| Naracoorte | South East | 4,134 | 4,366 | 42 | |
| Northern Areas | Yorke Peninsula and Mid North | 2,725 | 3,325 | 23 | |
| Onkaparinga | Adelaide and Fleurieu Peninsula | 13,865 | 4 | ||
| Orrorro Carrieton | Yorke Peninsula and Mid North | 818 | 4 | ||
| Peterborough | Yorke Peninsula and Mid North | 546 | 1 | ||
| Port Pirie | Yorke Peninsula and Mid North | 2,939 | 3,334 | 13 | |
| Renmark Paringa | South East | 1,003 | 1,420 | 9 | |
| Robe | South East | 4,720 | 4 | ||
| Southern Mallee | South East | 1,166 | 985 | 15 | |
| Streaky Bay | Eyre Peninsula | 240 | 311 | 6 | |
| Tatiara | South East | 2,238 | 2,447 | 40 | |
| Tumby Bay | Eyre Peninsula | 2,445 | 2,383 | 12 | |
| Victor Harbor | Adelaide and Fleurieu Peninsula | 17,586 | 12,246 | 5 | |
| Wakefield | Yorke Peninsula and Mid North | 2,160 | 3,158 | 20 | |
| Wattle Range | South East | 5,454 | 5,446 | 24 | |
| Wudinna | Eyre Peninsula | 823 | 3 | ||
| Yankalilla | Adelaide and Fleurieu Peninsula | 11,230 | 10,189 | 13 | |
| Yorke Peninsula | Yorke Peninsula and Mid North | 4,721 | 4,667 | 13 | |
| Adelaide and Fleurieu Peninsula | 12,061 | 11,828 | 126 | ||
| South East | 2,164 | 2,083 | 301 | ||
| Eyre Peninsula | 886 | 841 | 74 | ||
| Yorke Peninsula and Mid North | 3,521 | 3,836 | 177 | ||
aUse price information with a small volume of transactions with caution. The median price for municipalities with less than fiver sales in 2015 is not reported. bRefer ‘About the research’ section.
Conclusion
With the value of farmland linked to its productive capacity, it is no surprise that farmland values have been increasing over the same time period where significant gains have been made in yields. New cropping techniques and machinery have led to increased yields in the cropping districts, particularly the Mid North, Yorke Peninsula and Lower Eyre Peninsula. Bluegum investment schemes in the South East during the early 2000s saw prices spike and people less willing to sell land below prices received at that time. Values have been stagnant in the past few years and farmers have been reducing debt at the same time.
Contact details
Will Rayner
https://www.ruralbank.com.au/
Was this page helpful?
YOUR FEEDBACK