Is scale a profit driver in farming businesses?
It is often said that farmers need to increase their farm size to become more efficient and profitable. While this may be true for small farms, once the farm is big enough to productively utilise one labour unit and a reasonable size tractor, farm size or area cropped ceases to be an important factor in profitability. This threshold will depend upon location, but is likely to be around 600 hectares of grain cropping in the high rainfall areas of the Northern Region and 1,200 hectares in the mid-western grain areas of northern NSW and Southern Queensland.
Long term Agripath Farm performance benchmarking data collected across the various regions of Eastern Australia consistently reveal that there is a poor correlation between the physical size of a farm business (area) and the relative return on the farm assets (in percentage terms) (Figure 1). The top, average and lower performing businesses are consistently represented by a large range in their physical scale. In other words, there are highly profitable small farms and poorly performing small farms, just as there are highly profitable large farms as well as poorly performing large farms. Scale, per se, will not make a farm more profitable.
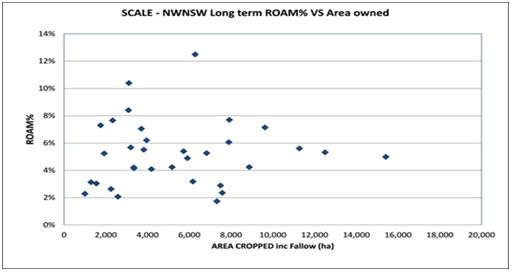
Figure 1: Farm scale versus profitability, Long Term Return On Assets Managed (ROAM)% versus Area cropped (hectares including fallow). (Source: Agripath Benchmarking data)
In theory increasing scale should see economies achieved as many of the overhead costs will not increase at the same proportion as the scale has been increased. In practise however, one of two things happen:
- The overheads do increase at the same proportion per ha.
- Whilst overheads do not increase proportionately on a per ha basis, the gross margin achieved declines due to the difficulties of operating at larger scale (more staff to manage, logistics and this trade off erodes the benefit achieved in overhead costs).
In both cases the increase in scale does not translate to higher relative returns (i.e. percentage return on assets managed).
This suggests that the key to profitability in each business is governed by the efficiency of converting costs back into income, irrespective of their scale.
The reality is that the efficiency at which costs are converted back into income is influenced by the overall management and decision making process applied to the operations occurring within the business. Top performers are focussed on achieving high yields and this leads to cost efficiency.
Achieving a ‘sweet spot’ in your business
Given that scale is not a key driver of performance each manager has the opportunity to fine tune the business performance to be profitable and achieve their own ‘sweet spot’. The big levers here are:
-
Crop yield – high yields are essential for high margin (Figure 2).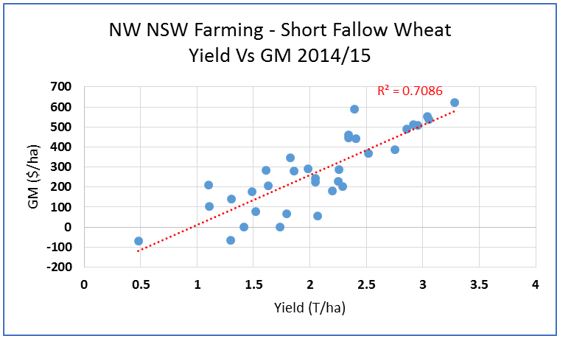
Figure 2: Wheat gross margin and yield North West NSW.
- Crop choice and sequence – some crops are more profitable than others, some crop sequences set each successive crop up for a good yield and margin, some don’t. Using crop sequences can lower horsepower and machinery capacity to get the job done in a timely manner. Crops such as
faba beans, barley and/or canola are early planted and harvested, spreading workload. Summer crops have the same impact.
-
Cropping frequency- double cropping, long fallow are all tools that influence revenue and margin.
-
Expansion - acquisition, leasing and sharefarming to improve cost efficiencies.
-
Machinery and labour utilisation – efficient use of machinery and labour is critical and substituting inefficient uses with contractors is achievable. Typically, the costs of getting things done can vary by as much as $100/ha. For example, a farm targeting average crop gross margins of greater than $300/ha this represents 30 per cent of the margin.
Efficient machinery utilisation
There are three basic models adopted on farms to execute cropping operations via:
-
A machinery ownership model,
-
a contract model, or;
-
a combination of both machinery ownership and contracting.
This is often a point of contention in most farm businesses where the common question is; “What is the most effective way to get the job done?”
Agripath measures the people and plant related costs (contracting + wages +repairs and maintenance + depreciation), as a measure called Total Plant Machinery and Labour (TPML).
The advantage of measuring TPML costs is that it provides a cost measure for the machinery and people operating within the business regardless of the model in use. Typically, these direct costs in a dry land cropping scenario can vary from as little as $100/ha to as high as $300/ha (Figure 3).
Combinations of ownership and use of contractors vary between farms but when measured on a cost per hectare basis TPML varies by as much as $100/ha between farms based on the decisions they have made. Well managed contractor based models have been able to compete with ownership models in terms of both TPML cost and Gross margin.
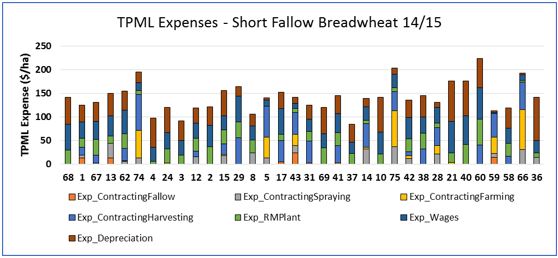
Figure 3: Total plant, machinery and labour costs, wheat 2014 North West NSW.
Agripath long term data indicates that there is little correlation between TPML costs and profitability or scale. In other words, having a low TPML per ha may not result in a high income per ha if timeliness is being sacrificed.
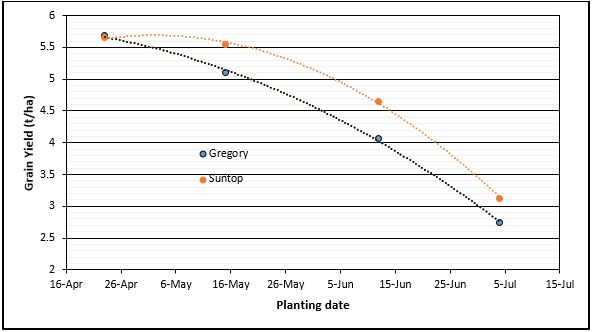
Timeliness of operation is the most important consideration because it has an impact on yield and gross margin. Data in Figure 4 shows the decline in yield is similar for two of the main wheat varieties. For EGA Gregory the gross return from a 15 May planting was $1,442/ha, some $292/ha or a 25 per cent increase on the return from wheat planted on 12 June and 85 per cent above the gross return of wheat planted on 4 July (Graham et al 2015).
Figure 4: Yield of two different varieties of wheat at four different sowing times, Narrabri 2014. (Source: Redrawn from Graham et al 2015)
For TPML costs, the key is matching the costs of the operating model selected to the size of the business, while maintaining the ability to maximise the practical opportunities that influence gross margin (yield, quality, crop choice.).
Acknowledgements
Participants in Agripath’s Benchmarking without their support this would not be possible.
References
Rick Graham, Peter Martin, Greg Brooke, Peter Matthews and Guy McMullen (2015)
Wheat Variety Response to sowing time, 2015.
Contact details
Simon Fritsch
Agripath Pty Ltd
1/21 Bourke st Tamworth
0428638501