Agronomic drivers of yield in rain fed wheat production systems of the Northern Grains Region
Author: Rick Graham(1), Greg Brooke(2), Guy McMullen(1), Steven Simpfendorfer(1) and Neroli Graham(1) | Date: 27 Feb 2017
1NSW DPI, Tamworth, 2NSW DPI, Trangie
Take home messages
- Time of sowing (TOS) was found to be a key determinant of yield, in all three targeted geographic regions/environments, demonstrating significant declines in yield with delayed sowing vs. early-main season sowings. Higher yielding environments were impacted less by delays in TOS than lower yielding environments, with yield losses of 13% for the Liverpool Plains (LPP) vs. 34% and 46% for Trangie and Nyngan respectively. Variety and/or maturity type did not have a significant effect on yield with timely sowing in the early-main season window indicating that varieties were generally ‘plastic’ in their responses and broadly adapted to environments.
- Variety and maturity type did however influence yield potential with a delayed TOS at Nyngan and Trangie. The faster maturing varieties LRPB Crusader and LRPB Spitfire out yielded the main season variety EGA Gregory, with increasing plant population further enhancing yield potential. This demonstrates the scope for genotype (G) x management (M) options with delayed TOS in lower yielding environments.
- Altering variety and maturity type, and increasing targeted plant populations in response to delays in TOS could not fully compensate for the yield losses associated with delayed sowings.
- Yield responses to Nitrogen (N) and Phosphorus (P) fertiliser application rates, were variable and influenced by starting soil nutrition and seasonal conditions.
- Crown rot (CR) was a significant factor affecting yield potential at both Nyngan and LPP sites, decreasing yields by 25% and 12% respectively. This highlights the potential impact of CR on yield and the underlying need to ensure that yield potential is not constrained by biotic factors such soil-borne pathogens.
Background
It is currently estimated that growers in the Northern Grains Region (NGR) are achieving around 49% of water limited yield potential, translating to a yield gap of approximately 1.9 t/ha (www.yieldgapaustralia.com.au). Water limited yield potential is defined as the potential yield achieved under non-limiting nutrition and biotic stresses using best management practices, but subject to environmental constraints namely plant available water and temperature (Hochman et al., 2012). To put this into perspective, leading growers in Australia using best management practices and available technology are estimated to be achieving around 80% of water-limited yield potential (van Rees et al., 2014), thus indicating that yield is being limited by factors other than available water. Based on these observations, there is an ‘exploitable yield gap’ between actual and attainable yields (i.e. 80% of water limited yield potential) considered the approximation of where grower’s yields plateau within most major cropping systems, as a result of economic constraints and climatic variability (van Ittersum et al., 2013).
Identifying the key drivers of yield in water-limited, rain fed environments is clearly an important strategy for reducing the exploitable yield gap and for increasing dryland wheat production. The aim of this research was to benchmark yield potential across a range of growing environments in the NGR of NSW, over two consecutive seasons, and to quantify the impact of genotype (G), management (M) and environment (E) on yield. Possible yield limiting factors investigated included variety selection (maturity type), time of sowing (TOS), plant population and fertiliser inputs (nitrogen and phosphorus). In addition to these factors, crown rot a major disease of wheat and barley crops in the NGR was also incorporated into this study.
Experimental program
Experiments were conducted at 4 sites in both 2014 and 2015, across three different environments within the NGR of NSW. Sites were located on the Liverpool Plains (LPP), Trangie on the edge of the Western Plains and Nyngan in the Central West. Sites were soil cored to ~ 1.2 m prior to sowing to determine plant available water capacities (PAWC) along with starting soil nutrition and other soil properties. Site descriptions including site and year, in-crop rainfall (May – October) are shown in Table 1, with soil type and starting soil nitrate nitrogen and Colwell P outlined in Table 2.
Table 1. Time of sowing, growing season rainfall and plant available water holding capacity
|
Site and year |
TOS 1 |
TOS 2 |
Growing season |
PAWC (mm) |
|
Nowley 2014 |
14 May |
1 July |
174 |
~120 |
|
Mullaley 2015 |
20 May |
8 July |
185 |
~140 |
|
Tamarang 2014 |
9 May |
30 June |
170 |
~210 |
|
Tamarang 2015 |
19 May |
9 July |
252 |
~150 |
|
Nyngan 2014 |
12 May |
5 June |
212 |
~90 |
|
Nyngan 2015 |
8 May |
28 May |
166 |
~75 |
|
Trangie 2014 |
15 May |
11 June |
144 |
~671 |
|
Trangie 2015 |
7May |
25 May |
200 |
~76 |
*May to October. 1Estimation based on 25% of Effective rainfall – November to March (Gobbett et al., 2016).
A series of 36 treatment combinations (2 times of sowing x 18 treatments) were examined in a partially factorial split-plot design, with three replicates at all sites (Table 3). Treatments were designed similar to an exclusion experiment, with the high input treatment aimed at providing the perceived optimum combination of factors and a low input treatment comprising a base set of agronomic factors (Table 4), so as to benchmark agronomic or management variables.
Four commercial spring wheat (Triticum aestivum) varieties widely grown and well adapted to targeted growing environments were selected and sown at each location. Varieties were from two different maturity groupings, two main season-moderate maturing varieties EGA Gregory and Sunvale, and two fast-moderate maturing varieties LRPB Crusader and LRPB Spitfire. At each location, varieties were sown at two times of sowing (TOS) an early-main season and a delayed TOS (Table 1). Targeted plant populations were grouped as low, moderate (district practice) or high, with the lower yielding environments of Nyngan and Trangie targeting a lower plant population of 40, 80 or 160 plants/m2 compared to 60, 120 and 180 plants/m2 for the higher yield potential LPP sites.
Table 2. Soil type, starting soil N (nitrate N) and Colwell P
|
Site and year |
Soil Type |
P (Cowell) (mg/kg) 0-10 cm |
Soil N03 (kg N/ha) 0-120 cm |
|
Nowley 2014 |
Black Vertosol |
25 |
123 |
|
Mullaley 2015 |
Grey Vertosol |
46 |
178 |
|
Tamarang 2014 |
Brown Vertosol |
77 |
167 |
|
Tamarang 2015 |
Brown Vertosol |
60 |
213 |
|
Nyngan 2014 |
Red Chromosol |
39 |
147 |
|
Nyngan 2015 |
Red-Brown Chromosol |
39 |
105 |
|
Trangie 2014 |
Grey Vertosol |
76 |
94 |
|
Trangie 2015 |
Red-Brown Chromosol |
23 |
127 |
Fertiliser treatments looked at both Nitrogen (N) and Phosphorus (P) with rates, products and application methods outlined in Table 3. Crown rot treatments were applied at sowing using sterilised durum grain colonised by at least five isolates of Fusarium pseudograminearum (Fp) as described by Dodman and Wildermuth (1987), with inoculum rates as per Table 3.
Table 3. Summary of treatments: time of sowing, variety, plant population, nitrogen and phosphorous rates and crown rot inoculum levels
|
Treatment |
Details |
|
Two times of sowing (TOS) |
TOS 1 - early/main season TOS 2 - delayed |
|
4 Varieties |
EGA Gregory (TOS 1 & 2), LRPB Spitfire (TOS 2), Sunvale (TOS 1), LRPB Crusader (TOS 1 & 2) |
|
3 Plant populations |
60, 120 or 180 plants/m2(LPP sites) 40, 80 or 160 plants/m2 (Central West sites) |
|
5 Nitrogen rates |
0, 50, 100, 150 or a 50 + 50 kg N/ha split application all applied as urea (46% N). Treatments were side banded at sowing, apart from the split application which was applied at sowing and broadcast at stem elongation (GS31). |
|
4 Phosphorus rates |
0, 10, 20 or 30 kg/ha P applied as triple super at sowing |
|
4 Crown rot (CR) inoculum rates |
0, 0.5, 1.0 or 2.0 g/m row sterilised durum grain colonised by at least 5 different isolates of Fp +/- added at sowing i.e.; 0, CR+, CR++ or CR+++ |
Small plot sowing equipment based on 33 cm row spacing’s x 5 rows, with two metre centres was used to sow experimental plots of ~10 metres length. Grain yield was obtained using small-plot harvesters.
Table 4. List of experimental treatments
|
Treatment |
TOS |
Variety |
Applied Nitrogen (kg/ha) |
Population (plant/m2)* |
Applied Phosphorus (kg/ha) |
Disease |
|
1 |
Early/Main |
EGA Gregory |
0 |
120 |
20 |
Nil |
|
2 |
Early/Main |
EGA Gregory |
50 |
120 |
20 |
Nil |
|
3 |
Early/Main |
EGA Gregory** |
100 |
120 |
20 |
Nil |
|
4 |
Early/Main |
EGA Gregory |
50+50 |
120 |
20 |
Nil |
|
5 |
Early/Main |
Sunvale |
100 |
120 |
20 |
Nil |
|
6 |
Early/Main |
LRPB Crusader |
100 |
120 |
20 |
Nil |
|
7 |
Early/Main |
EGA Gregory |
100 |
60 |
20 |
Nil |
|
8 |
Early/Main |
EGA Gregory |
100 |
180 |
20 |
Nil |
|
9 |
Early/Main |
EGA Gregory |
100 |
120 |
0 |
Nil |
|
10 |
Early/Main |
EGA Gregory |
100 |
120 |
10 |
Nil |
|
11 |
Early/Main |
EGA Gregory |
100 |
120 |
20 |
CR+ |
|
12 |
Early/Main |
EGA Gregory |
100 |
120 |
20 |
CR++ |
|
13 |
Early/Main |
EGA Gregory |
100 |
120 |
20 |
CR+++ |
|
14 |
Early/Main |
EGA Gregory |
0 |
120 |
0 |
Nil |
|
15 |
Early/Main |
Sunvale |
0 |
120 |
0 |
Nil |
|
16 |
Early/Main |
LRPB Crusader |
0 |
120 |
0 |
Nil |
|
17 |
Early/Main |
EGA Gregory |
150 |
120 |
20 |
Nil |
|
18 |
Early/Main |
EGA Gregory |
100 |
120 |
30 |
Nil |
|
19 |
Delayed |
LRPB Spitfire |
0 |
120 |
20 |
Nil |
|
20 |
Delayed |
LRPB Spitfire |
50 |
120 |
20 |
Nil |
|
21 |
Delayed |
LRPB Spitfire** |
100 |
120 |
20 |
Nil |
|
22 |
Delayed |
LRPB Spitfire |
50+50 |
120 |
20 |
Nil |
|
23 |
Delayed |
LRPB Crusader |
100 |
120 |
20 |
Nil |
|
24 |
Delayed |
EGA Gregory |
100 |
120 |
20 |
Nil |
|
25 |
Delayed |
LRPB Spitfire |
100 |
60 |
20 |
Nil |
|
26 |
Delayed |
LRPB Spitfire |
100 |
180 |
20 |
Nil |
|
27 |
Delayed |
LRPB Spitfire |
100 |
120 |
0 |
Nil |
|
28 |
Delayed |
LRPB Spitfire |
100 |
120 |
10 |
Nil |
|
29 |
Delayed |
LRPB Spitfire |
100 |
120 |
20 |
CR+ |
|
30 |
Delayed |
LRPB Spitfire |
100 |
120 |
20 |
CR++ |
|
31 |
Delayed |
LRPB Spitfire |
100 |
120 |
20 |
CR+++ |
|
32 |
Delayed |
LRPB Spitfire |
0 |
120 |
0 |
Nil |
|
33 |
Delayed |
LRPB Crusader |
0 |
120 |
0 |
Nil |
|
34 |
Delayed |
EGA Gregory |
0 |
120 |
0 |
Nil |
|
35 |
Delayed |
LRPB Spitfire |
150 |
120 |
20 |
Nil |
|
36 |
Delayed |
LRPB Spitfire |
100 |
120 |
30 |
Nil |
*Nyngan and Trangie targeting 40, 80 or 160 plants/m2. **High input combinations EGA Gregory TOS 1 and LRPB Spitfire TOS 2.
Results
Yields varied considerably between sites, TOS and year and ranged from 5.91 t/ha at Tamarang for TOS 1 in 2014, to 0.79 t/ha at Nyngan for TOS 2 in 2015 (Table 5). Experiments were grouped into ‘three environments’ based on Statistical Local Areas (SLA), actual yield and estimated water limited yield potential using the ‘Yield Gap Australia Map’ (www.yieldgapaustralia.com.au).
Table 5. Mean site yield (t/ha) and corresponding yield range (t/ha) for two times of sowing averaged across varieties
|
Site and year |
TOS 1 Mean |
Range |
TOS 2 Mean |
Range |
|
Nowley 2014 |
3.80 |
3.97 – 3.77 |
2.62 |
2.83 – 2.44 |
|
Mullaley 2015 |
4.34 |
4.38 – 4.21 |
3.56 |
4.00 – 3.06 |
|
Tamarang 2014 |
5.91 |
5.94 – 5.50 |
4.40 |
4.52 – 4.01 |
|
Tamarang 2015 |
4.23* |
4.25 – 4.06 |
4.67* |
4.93 – 4.29 |
|
Nyngan 2014 |
3.61 |
3.72 – 3.57 |
2.33 |
2.72 – 2.08 |
|
Nyngan 2015 |
2.65 |
2.70 – 2.63 |
0.79 |
0.85 – 0.65 |
|
Trangie 2014 |
3.07 |
3.07 – 2.74 |
1.82 |
1.92 – 1.72 |
|
Trangie 2015 |
4.24 |
4.49 – 3.59 |
3.04 |
3.35 – 2.74 |
* All TOS contrasts significant (P<0.05) except Tamarang 2015.
Liverpool Plains (LPP)
The LPP included the site locations of Tamarang, Mullaley and Nowley, with all experiments conducted on Vertosol soils (Table 2). Yield results varied between site and year, and ranged from 5.91 t/ha at Tamarang in 2014 for TOS 1, to 2.62 t/ha at Nowley TOS 2 in 2014, averaged across treatments (Table 5).
When looking at the across site analysis, timeliness of sowing was found to be a significant driver of yield, delays in TOS reducing yields by 0.60 t/ha or 13.1 % when comparing high input (100 kg N/ha, 120 plants/m2 , 20 kg P/ha) EGA Gregorytreatments (Table 6). On an individual site basis, when comparing EGA Gregory for TOS, delays in sowing date resulted in yield declines of 6.0 kg/day up to 28.8 kg/day. The only site not to show a yield response due to an earlier TOS was Tamarang in 2015. This was most likely due to the impact of frost induced sterility, with minimum temperatures of < 0°C occurring during the period from the 28th August to the 1st September, coinciding with head emergence/anthesis, with a 14.5% decrease in the yield of EGA Gregory between TOS 1 and TOS 2.
Table 6. Effect of management and crown rot (Fp) on grain yield potential – LPP across site analysis
|
Variety |
Population (plants/m2) |
Applied N (kg/ha) |
Applied P (kg/ha) |
Fp (CR+++) |
Yield (t/ha) |
Yield Gap (t/ha) |
|
TOS 1 |
||||||
|
EGA Gregory |
120 |
100 |
20 |
0 |
4.571 |
|
|
EGA Gregory |
120 |
100 |
20 |
+++ |
4.26 |
-0.31* |
|
TOS 2 |
||||||
|
EGA Gregory |
120 |
100 |
20 |
0 |
3.971 |
-0.60* |
|
LRPB Crusader |
120 |
100 |
20 |
0 |
3.65 |
-0.32* |
|
LRPB Spitfire |
120 |
100 |
20 |
0 |
3.55 |
-0.42* |
|
LRPB Spitfire |
120 |
100 |
20 |
+++ |
3.13 |
-0.84* |
*Contrast are significant (P<0.05). 1EGA Gregory TOS 1 vs. TOS 2 contrast.
Maturity type was not a significant factor in TOS 1, with no difference (P<0.05) in yield between varieties. Variety choice did however, impact yield in TOS 2, with EGA Gregory significantly (P<0.001) out yielding both the quicker maturing varieties LRPB Crusader and LRPB Spitfire by 0.32 and 0.42 t/ha respectively. The yield contrast between EGA Gregory in TOS 1 and LRPB Crusader in TOS 2 equated to 0.92 t/ha or 20%, compared to 0.60 t/ha or 13.1% for EGA Gregory in TOS 2.
Increasing crown rot (CR) disease pressure (± Fp applied at sowing) resulted in a decrease in yield in TOS 1 of 0.31 t/ha equating to a 7% decrease in yield (Table 6). Similarly in TOS 2, yield was also impacted by CR, with LRPB Spitfireexperiencing a 0.42 t/ha or 12% decrease in yield due to CR, when all other variables were held constant. Importantly, when contrasting the combined effects of TOS, CR disease pressure and genotype, potential yield decreased by 1.44 t/ha or ~31.5%.
Varying N and P application rates had a limited effect on yield potential, most likely due to the relatively high starting soil N and Colwell P values (Table 2). There was a small but significant (P<.001) response to P application rates (Nil vs 30 units of P) of 0.17 t/ha (3.44 vs. 3.61 t/ha) in TOS 2 (data not shown). Interestingly, when looking at high input (100 kg N/ha + 20 kg P/ha) versus the low input treatments (Nil N and P), there was a 0.31 t/ha or ~7% difference in yield in TOS 1 (data not shown). The only site to show a significant yield response to N application was Tamarang TOS 1 in 2014, with a 9% increase in yield with the application of 100 kg N compared with the Nil treatment.
Other agronomic factors to adversely impact yield potential included plant population at Tamarang in 2014 with the delayed TOS 2 treatment. The low target population of 60 plants/m2 was significantly (P<0.05) lower yielding than the 120 and 180 plants/m2 treatments, at 3.67 t/ha vs. 4.01 t/ha and 4.04 t/ha respectively, supporting the accepted principal of increasing targeted plant population with delayed sowing times.
Trangie
Experiments were conducted over two consecutive years at Trangie Agricultural Research Centre. In 2014 the experiment was conducted on a Grey Vertosol and in 2015 on a Red/Brown Chromosol. Yield results varied between site and year, ranging from 4.24 t/ha for TOS 1 in 2015, to 1.82 t/ha for TOS 2 in 2014 (Table 5). Timeliness of sowing was again shown to be a key driver of yield, with delayed sowing resulting in a 1.20 t/ha decrease in yield in the across sites analysis, equating to a 34% decline for EGA Gregory, TOS 1 vs TOS 2 (Table 7). When comparing individual site years, delays in sowing time equated to yield declines of 42.5 kg/day in 2014 and 69.1 kg/day in 2015.
Variety selection was found to be a contributing factor to yield potential in TOS 1 with the quicker maturing variety LRPB Crusader out yielding the longer main season variety Sunvale by 0.61 t/ha, with no significant difference between LRPB Crusader and EGA Gregory(Table 7). TOS 2 results for Trangie in 2015, showed that the faster maturing variety LRPB Crusader was higher yielding than EGA Gregory, 3.35 t/ha vs. 2.74 t/ha respectively (data not shown).
Plant populations (40, 80 or 160 plants/ m2) had no effect on yield in TOS 1 at Trangie. In contrast, population had a significant (P<0.001) effect on yield when sowing time was delayed, with yield improving with increasing plant population (Figure 1). The low population treatment (40 plants/m2) being 0.44 t/ha or 17% lower yielding and the 80 plants/m2 approximately 8% or 0.20 t/ha lower yielding than the high population (160 plants/ m2), with significant differences between all treatments (Table 7).
Table 7. Effect of main agronomic factors on grain yield potential – Trangie across site analysis
|
Variety |
Population (plants/m2) |
Applied N (kg/ha) |
Applied P (kg/ha) |
Fp (CR+++) |
Yield (t/ha) |
Yield Gap (t/ha) |
|
TOS 1 |
||||||
|
LRPB Crusader |
80 |
100 |
20 |
0 |
3.78 |
|
|
Sunvale |
80 |
100 |
20 |
0 |
3.17 |
-0.61* |
|
EGA Gregory |
80 |
100 |
20 |
0 |
3.531 |
ns |
|
TOS 2 |
||||||
|
EGA Gregory |
80 |
100 |
20 |
0 |
2.331 |
-1.20* |
|
LRPB Spitfire |
160 |
100 |
20 |
0 |
2.58# |
|
|
LRPB Spitfire |
80 |
100 |
20 |
0 |
2.38# |
-0.20* |
|
LRPB Spitfire |
40 |
100 |
20 |
0 |
2.14# |
-0.44* |
*>Contrast are significant (P<0.05). ns = Not Significant. 1EGA Gregory TOS 1 vs. TOS 2 contrast. #TOS 2 contrasts relate to LRPB Spitfire.
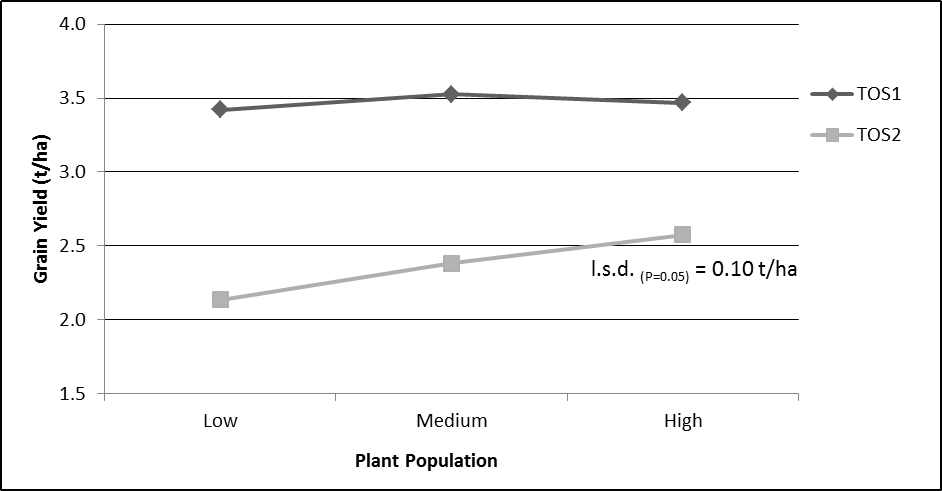
Figure 1. Yield response of wheat to plant population and time of sowing - Trangie across site analysis
Nyngan
(Table 8). When comparing individual site years, delays in sowing time for EGA Gregory, resulted in yield declines of 59.5 kg/day in 2014 and 95 kg/day in 2015.Crown rot (CR) disease pressure (± Fp applied at sowing) was also an important factor influencing yield potential at Nyngan, and resulted in a decrease in yield in TOS 1 of 0.79 t/ha or ~ 25% (Table 8).
Maturity type was not a significant factor in TOS 1, with no significant difference between varieties. Maturity type/variety selection did however, impact yield potential in TOS 2, with the faster maturing varieties LRPB Spitfire and LRPB Crusaderout yielding the main season variety EGA Gregory by 0.27 to 0.30 t/ha respectively (Table 8). Low plant population negatively impacted yield potential in TOS 2, with a low target population of 40 plants/m2 resulting in a decrease in yield of 0.32 t/ha or 19% over the target population of 80 plants/m2.
There was a yield response to increasing rates of P in TOS 2 at Nyngan in both 2014 and 2015. The across sites analysis demonstrated a yield response of 0.30 t/ha with the application of 20 kg P/ha over the Nil treatment (Table 8), increasing up to 0.37 t/ha for the 30 kg P/ha application rate (data not shown).
Table 8. Effect of main agronomic factors on grain yield potential – Nyngan across site analysis
|
Variety |
Population (plants/m2) |
Applied N (kg/ha) |
Applied P (kg/ha) |
Fp (CR+++) |
Yield (t/ha) |
Yield Gap (t/ha) |
|
TOS 1 |
||||||
|
EGA Gregory |
80 |
100 |
20 |
0 |
3.07 |
|
|
EGA Gregory |
80 |
100 |
20 |
+++ |
2.28 |
-0.79* |
|
TOS 2 |
||||||
|
LRPB Crusader |
80 |
100 |
20 |
0 |
1.71 |
|
|
LRPB Spitfire |
80 |
100 |
20 |
0 |
1.68# |
ns |
|
EGA Gregory |
80 |
100 |
20 |
0 |
1.41 |
-0.27* |
|
LRPB Spitfire |
40 |
100 |
20 |
0 |
1.36 |
-0.32* |
|
LRPB Spitfire |
80 |
100 |
0 |
0 |
1.38 |
-0.30* |
*Contrast are significant (P<0.05). ns = Not Significant. #TOS 2 contrasts relate to LRPB Spitfire.
Summary and conclusions
Timely sowing of varieties was found to be a key determinant of yield in all three environments. With the exception of Tamarang in 2015, all sites demonstrated significant increases in yield with an early-main season sowing; TOS 1 vs. TOS 2 contrasts (Table 5). When sowing time is delayed the growing environment is in effect being altered which reduces the length of the growing season and the timing and extent of stresses, such as terminal drought. It was also observed that environment as defined by geographic location, did influence yield potential, although this was to some extent impacted by season. With the higher yield potential environments on the LPP less impacted by delays in sowing times. The LPP with a mean predicted yield of 4.57 t/ha for EGA Gregory in TOS 1, experienced a 0.60 t/ha or 13.1% decrease in yield, TOS 1 vs. TOS 2 averaged across sites and years. In contrast Trangie, with a mean predicted yield of 3.53 t/ha for EGA Gregory in TOS 1, experienced a 1.20 t/ha or 34% decrease in yield TOS 1 vs. TOS 2. Whilst Nyngan a lower yielding environment, with a mean predicted yield of 3.07 t/ha for EGA Gregory in TOS 1, suffered a 1.66 t/ha decrease a 46% decline in yield for TOS 1 vs TOS 2.
It is also important to note, that apart from the declines in yield being greater in the lower yielding environments, the differences between sowing dates (TOS 1 vs TOS 2) were also considerably less, at 18 - 27 days and 20 - 24 days for Trangie and Nyngan respectively, compared to 48 - 52 days for the LPP sites. This further highlights how much more critical delays in TOS are in lower yielding environments.
When looking at variety selection and maturity type in the TOS 1 across sites analysis, it was observed that apart from Trangie where the mid-late maturing variety Sunvalewas lower yielding than LRPB Crusader, that variety selection did not have a significant effect on yield. Indicating that the varieties LRPB Crusader and EGA Gregory were well adapted to these environments, supporting the findings of Lawes et al., (2016) that commercially released varieties of wheat in Australia tend to be ‘plastic’ and broadly adapted to a wide range of environments.
In contrast with TOS 2 when sowing time was delayed, variety selection and maturity type were found to influence yield potential in the lower yielding environments at Nyngan and Trangie. At Nyngan, the quicker maturing varieties LRPB Crusader and LRPB Spitfire out yielded the mid-season variety EGA Gregory by 0.28 to 0.31 t/ha or ~ 18%. As a consequence, quicker maturing varieties could be considered as a management option in these lower yielding environments, when TOS is delayed, indicating a potential G x M option. It should however, be noted that in a higher yielding environment on the LPP, that the main season variety EGA Gregory significantly (P<0.001) out yielded the faster maturing varieties LRPB Crusader and LRPB Spitfire by 8% and ~11% respectively in TOS 2, emphasising the adaptability of commercial main season varieties in this environment.
Increasing targeted plant populations was also found to increase yield potential with a delayed sowing time at both Trangie and Nyngan, supporting the accepted principle of increasing targeted plant populations with later plantings. At Trangie for example, yield increased with higher plant populations, with the high targeted population of 160 plants/m2, out yielding the low (40 plants/m2) and the district practice rate (80 plants/m2) by 17% (0.44 t/ha) and ~8% (0.20 t/ha) respectively. Importantly however, changing variety selection in response to delays in TOS and increasing targeted plant populations, could not fully compensate for the yield losses associated with delayed sowing. These findings further highlight the advantage of sowing well adapted varieties, in the early part of the optimum sowing window, underscoring a wheat crops ability to compensate for lower plant populations under adequate growing conditions.
Yield responses to N and P fertiliser application rates, were found to be variable and influenced by starting soil nutrition values (relatively high starting soil N and Colwell P at some sites) and to some extent, seasonal conditions. This highlights the value in determining starting soil nutrition levels through testing and considering critical nutrient response values (e.g. Colwell P) in fertiliser decisions. N and P nutrition, based around predicted yield and critical soil values were crucial in ensuring that optimum yield potentials were achieved.
Finally, crown rot caused by the fungus Fusarium pseudograminearum, was found to impact yield potential, decreasing yields by 25% at Nyngan and by up to 12% in the LPP sites. These results emphasis the potential negative impact of CR on yield, and highlight the need for awareness of risk levels from soil-borne pathogens prior to sowing to guide management decisions.
References
Dodman RL, Wildermuth GB (1987). Inoculation methods for assessing resistance in wheat to crown rot caused by Fusarium graminearum group 1. Australian Journal of Agricultural Research 38, 473- 486.
Gobbett DL, Hochman Z, Horan H, Navarro Garcia J, Grassini P, Cassman KG (2016). Yield gap analysis of rainfed wheat demonstrates local to global relevance. The Journal of Agricultural Science, published online 18 August, 2016 pp 1-18 (DOI: https://doi.org/10.1017/S0021859616000381)
Field Crops Research 136, 85-96.Lawes RA, Huth ND, Hochman Z (2016). Commercially available wheat cultivars are broadly adapted to location and time of sowing in Australia’s grain zone. European Journal of Agronomy 77, 38-46.
van Ittersum MK, Cassman KG, Grassini P, Wolf J, Tittonell P, Hochman Z (2013). Yield gap analysis with local to global relevance – a review. Field Crops Research 143, 4-17.
van Rees H, McClelland T, Hochman Z, Carberry P, Hunt J, Huth N, Holzworth D (2014). Leading farmers in South East Australia have closed the exploitable wheat yield gap: Prospects for further improvement. Field Crops Research 164, 1-11.
Acknowledgements
This research was co-funded by NSW DPI and GRDC under the Northern Region High Yielding Cereal Project (DAN 00181). Technical assistance provided by Stephen Morphett, Jim Perfrement, Bruce Haigh, Peter Formann, Michael Dal Santo, Rod Bambach, Jan Hosking, Paddy Steele, Lizzie Smith, Sally Wright and Ray Platt (all NSW DPI) for the sowing, maintaining and harvesting of experiments is greatly appreciated. The research undertaken as part of this project was made possible by the significant contributions of growers through both trial site cooperation and support of the GRDC, we would like to thank them for their continued support and in particularly David Ronald, David Carter, Jack Carter, James Vince and Richard Heath.
Contact details
Rick Graham
NSW DPI, Tamworth
Ph: 0428 264 971
Email: rick.graham@dpi.nsw.gov.au
Greg Brooke
NSW DPI, Trangie
Ph: 0437 140 577
Email: greg.brooke@dpi.nsw.gov.au
Reviewed by
Dr Steven Simpfendorfer
Varieties displaying this symbol beside them are protected under the Plant Breeders Rights Act 1994.
GRDC Project Code: DAN00181,
Was this page helpful?
YOUR FEEDBACK