Riverine Plains Inc research update
Author: Cassandra Schefe (Riverine Plains Inc). | Date: 16 Feb 2017
Take home messages
- Riverine Plains Inc conducts a range of research activities to provide local information to members.
- Large farm scale trials provide grower-relevant information.
- Decisions on stubble management require consideration of the whole system across a range of seasonal conditions.
Background
Riverine Plains Inc is a progressive grower group dedicated to improving the productivity of broadacre farming systems in north-east Victoria and southern NSW. The group provides relevant and unbiased research and information to its members and acts as a conduit for information flow from credible research sources to its membership.During 2016, Riverine Plains Inc contributed to a range of research projects, however this report will focus on the ‘Maintaining profitable farming systems with retained stubble in the Riverine Plains region’ project. A subset of work within this project focused on frost risk in stubble retained systems.
Results and discussion
The Stubble Project
The Stubble Project, ‘Maintaining profitable farming systems with retained stubble in the Riverine Plains region’ is funded by GRDC as part of a National Initiative (RPI0009) and conducted in partnership with the Foundation for Arable Research (FAR) Australia. It is looking at ways to improve and maintain profit and sustainability in stubble retention cropping systems across the region. Four large, commercial scale field trials (‘Focus Farms’) have been established across the region, which are comparing different stubble management practices and plant establishment, growth and yield (Table 1). Smaller trials are also evaluating the importance of timing of nitrogen (N) application, plant growth regulators, row spacing and cultivar selection in optimising production in stubble retained systems.
Table 1. Different stubble management strategies for focus farms as part of the ‘Maintaining profitable farming systems with retained stubble in the Riverine Plains region’ project.
Henty
|
Dookie
|
Yarrawonga
|
Coreen/Corowa
|
Comparative yields across seasons
The large plot field trials are always placed into a cereal stubble. Therefore, the sites do not continue in the same location every year, but are placed in different paddocks every year to maintain the same rotation position, with the trial crop being sown into as wheat stubble. While the trial results cannot be directly compared across seasons (2014-2016), the effect of different stubble management techniques can be reviewed across years to determine if any single approach appears to consistently yield better (Tables 2-5).
Table 2. Comparative yields and protein contents for large plot field trials located at Coreen/Corowa over the 2014-2016 seasons.
| Treatment | 2014 | 2015 | 2016 | |||
|---|---|---|---|---|---|---|
| Wheat yield | Protein | Wheat yield | Protein | Barley yield | Protein | |
| (t/ha) | (%) | (t/ha) | (%) | (t/ha) | (%) | |
| NTSR | 3.17 a | 8.1 a | 4.33 a | 10.9 a | 5.24 a | 9.5 a |
| Cultivated | 3.18 a | 8.8 a | 4.18 a | 11.4 a | 5.10 a | 8.5 b |
| Cultivated + 40kg N/ha | 3.31 a | 8.4 a | 4.69 a | 11.5 a | 5.54 a | 9.9 a |
| Burnt | 3.10 a | 8.1 a | 3.95 a | 11.4 a | 4.81 a | 9.5 a |
| Grand Mean | 3.19 | 8.4 | 4.286 | 11.29 | 5.17 | 9.4 |
| LSD | 0.53 | 1.22 | 0.808 | 1.23 | 1.01 | 0.6 |
NTSR = long stubble/no till stubble retained system
Table 3. Comparative yields and protein contents for large plot field trials located at Yarrawonga over the 2014-2016 seasons.
| Treatment | 2014 | 2015 | 2016 | |||
|---|---|---|---|---|---|---|
| Wheat yield | Protein | Wheat yield | Protein | Wheat yield | Protein | |
| (t/ha) | (%) | (t/ha) | (%) | (t/ha) | (%) | |
| Long stubble | 4.43 a | 10.5 bc | 3.13 a | 15.6 a | 5.86 bc | 8.5 c |
| Long stubble + 40kg N/ha | 4.18 a | 12.0 a | 3.20 a | 15.6 a | 6.19 ab | 9.7 ab |
| Short stubble | 3.35 a | 14.8 a | 5.81 bc | 8.9 c | ||
| Straw removed |
4.53 a | 9.6 c | 3.03 a | 14.9 a | 5.60 c | 8.6 c |
| Cultivated | 4.54 a | 9.9 bc | 3.10 a | 14.8 a | 5.90 bc | 9.1 bc |
| Cultivated + 40kg N/ha | 4.30 a | 11.1 ab | 3.05 a | 15.7 a | 6.69 a | 10.0 a |
| Burnt | 4.43 a | 9.9 bc | 2.93 a | 15.1 a | 6.12 abc | 8.9 c |
| Grand Mean | 4.36 | 10.5 | 3.11 | 15.2 | 6.03 | 9.1 |
| LSD | 0.46 | 1.2 | 0.3 | 0.7 | 0.58 | 0.7 |
Table 4. Comparative yields and protein contents for large plot field trials located at Dookie over the 2014-2016 seasons.
| Treatment | 2014 | 2015 | 2016 | |||
|---|---|---|---|---|---|---|
| Wheat yield | Protein | Wheat yield | Protein | Wheat yield | Protein | |
| (t/ha) | (%) | (t/ha) | (%) | (t/ha) | (%) | |
| Long stubble | 4.98 b | 11.6 a | 2.41 a | 15.0 a | 5.80 a | 10.7 a |
| Short stubble | 5.66 a | 10.6 ab | 2.52 a | 13.6 b | 5.37 a | 10.7 a |
| Cultivated | 5.56 a | 10.3 b | 2.39 a | 12.9 c | 5.60 a | 11.3 a |
| Straw removed | 5.66 a | 10.9 ab | 2.32 a | 13.5 bc | 6.00 a | 10.5 a |
| Burnt | 5.85 a | 10.4 b | 2.49 a | 13.3 bc | 6.23 a | 11.1 a |
| Grand Mean | 5.54 | 10.7 | 2.42 | 13.6 | 5.80 | 10.9 |
| LSD | 0.45 | 1.05 | 0.22 | 0.6 | 1.02 | 1.6 |
Table 5. Comparative yields and protein contents for large plot field trials located at Henty over the 2014-2016 seasons.
| Treatment | 2014 | 2015 | 2016 | |||
|---|---|---|---|---|---|---|
| Canola yield | Oil | Canola yield | Oil | Canola yield | Oil | |
| (t/ha) | (%) | (t/ha) | (%) | (t/ha) | (%)* | |
| NTSR | 1.96 c | 43.2 a | 1.24 a | 44.5 a | 2.40 a | |
| NTSR + 40kg N/ha | 2.35 ab | 42.7 a | 1.32 a | 41 b | 2.26 a | |
| Mulched | 2.23 abc | 43.8 a | 1.44 a | 43.6 a | 2.48 a | |
| Mulched + 40kg N/ha | 2.14 bc | 42.7 a | 1.39 a | 43.6 a | 2.53 a | |
| Cultivate | 2.41 ab | 43.7 a | 1.43 a | 44.3 a | 2.80 a | |
| Cultivate + 40kg N/ha | 2.54 a | 44.2 a | 1.35 a | 43.7 a | 2.72 a | |
| Grand Mean | 2.27 | 43.4 | 1.36 | 43.4 | 2.53 | |
| LSD | 0.35 | 0.45 | 0.62 | 1.59 | 0.72 | |
*Oil quality not yet available at time of printing
Summary of yields under different stubble management techniques from 2014-2016
Coreen/Corowa
There have not been any differences in cereal yields due to stubble management techniques.
Yarrawonga
The only difference seen at Yarrawonga was in 2016, where the addition of 40kg N/ha at sowing resulted in yield increases in both the stubble retained and cultivated treatments.
Dookie
The only difference in yield was seen in 2014 when the long standing stubble incurred a yield penalty compared to all other treatments.
Henty
The mulched treatment with the addition of N at sowing had a higher canola yield in 2014.
Generally, across the past three seasons (2014-2016), stubble management has not been a key driver of yield, except for stubble height at Dookie, and addition of N at sowing at Yarrawonga and Henty in 2014. This general lack of effect may be largely due to extreme weather through the growing season (heat stress in October 2015, waterlogging in winter/spring 2016), which would have overridden any effects of stubble management on yield.
Biomass lag with retained stubble
Over the 2014–2015 seasons, it was observed that the stubble retained treatments had lower dry matter contents during the earlier growth stages, however by flowering there was little difference between plants grown in no till stubble retained (NTSR) systems or where the stubble had been burnt or cultivated. The impact of this delay in biomass on the physiological development of the plant was unknown.
Were the plants growing in NTSR systems at the same growth stage, with less biomass, or was there a difference in growth stage? If there was a difference in physiological development of plants in NTSR and burnt/cultivated systems, this could relate to differences in how the crops handle frost (due to a difference in vulnerability) and heat stress.
In order to understand if this biomass lag was simply a difference in the rate of dry matter accumulation or if it related to differences in growth stage, a series of growth stage assessments were done at the Coreen, Yarrawonga and Dookie sites in the 2016 season to understand what was happening.
At the Yarrawonga site (Figure 1), stubble management did not influence plant growth and development until stem elongation (11 July 2016) at which point all treatments except the tall stubble treatment began stem elongation. The tall stubble treatment took an extra three weeks to move into stem elongation.
The Dookie site (Figure 2) showed differences in growth stage from seedling stage, with treatments separating from 27 June 2016. Plants in the burnt treatment were slightly more developed than the other treatment, with this increase largely maintained over the next four weeks. In comparison, while plants in the tall stubble treatment lagged in development from 27 June 2016, and showed minimal development at the next reading on 4 July 2016, by 18 July they had caught up to the short stubble and disced treatments, while the burnt treatment was still slightly ahead.
In comparison, there were no significant differences in growth stage development at the Coreen site (Figure 3), with plants in the stubble standing, disced and burnt treatments all developing at the same rate.
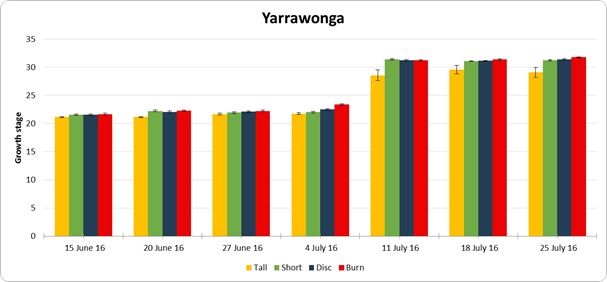
Figure 1. Growth stage assessments at the Yarrawonga stubble management trial. Growth stage relates to Zadok’s growth scale; 0-9 Germination, 10-19 Seedling growth, 20-29 Tillering, 30-39 Stem elongation, 40-49 Booting. Bars are measures of standard error (Order of columns from left to right: tall, short, disc and burn).
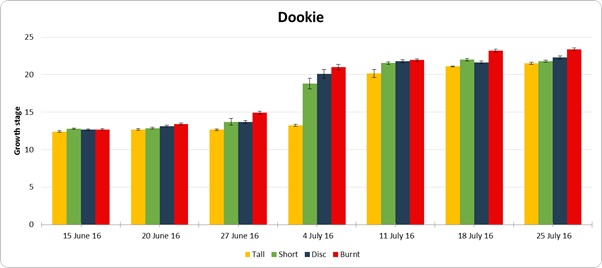
Figure 2. Growth stage assessments at the Dookie stubble management trial. Growth stage relates to Zadok’s growth scale; 0-9 Germination, 10-19 Seedling growth, 20-29 Tillering, 30-39 Stem elongation, 40-49 Booting. Bars are measures of standard error (Order of columns from left to right: tall, short, disc and burn).
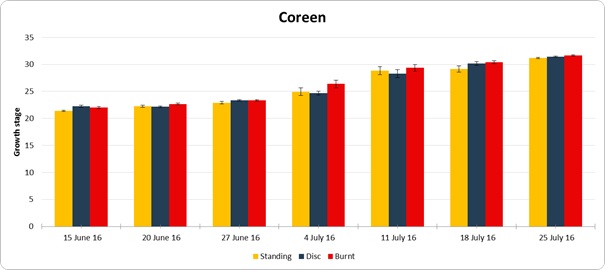
Figure 3. Growth stage assessments at the Coreen stubble management trial. Growth stage relates to Zadok’s growth scale; 0-9 Germination, 10-19 Seedling growth, 20-29 Tillering, 30-39 Stem elongation, 40-49 Booting. Bars are measures of standard error (Order of columns from left to right: tall, short, disc and burn).
The impact of stubble on canopy temperature
From the start of the Stubble Project, there was a lot of interest from growers about the interaction between retaining stubble and frost risk — were crops more likely to suffer frost damage under retained stubble?
As the large field trial plots used within the Stubble Project are ideal for measuring temperature due to minimal ‘edge effects’, extra investment from the GRDC enabled three of the field sites to be instrumented for temperature monitoring (in-crop temperature loggers and a weather station next to the field site).
In-crop monitoring of canopy temperatures began in 2015, with field sites again instrumented in 2016.
The three sites which were instrumented in 2016 were:Yarrawonga (loggers installed 27/5/16):
- Treatments monitored: Long Stubble, Short Stubble, Cultivate, Burn.
- In-canopy data loggers at 300mm height, moved to 600mm height in September.
- In-canopy data loggers at 50mm height above the soil.
- Treatments monitored: Long Stubble, Short Stubble, Cultivate, Burn.
- In-canopy data loggers at 300mm height, moved to 600mm height in September.
- In-canopy data loggers at 50mm height above the soil.
- Data loggers buried 50mm under the soil surface.
- Treatments monitored: NTSR, Cultivate, Burn.
- In-canopy data loggers at 300mm height, moved to 600mm height in September
- In-canopy data loggers at 50mm height above the soil.
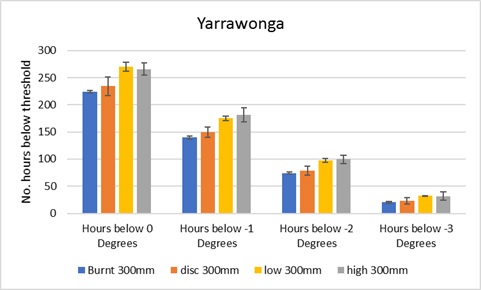
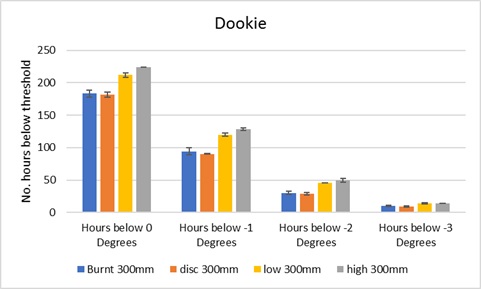
Figure 5. The number of hours that each stubble treatment spent below each temperature threshold at the Dookie site, as monitored at the loggers placed 300mm above the soil surface, which were moved to 600mm height in September 2016 (Order of columns from left to right: burnt 300mm, disc 300mm, low 300mm and high 300mm).
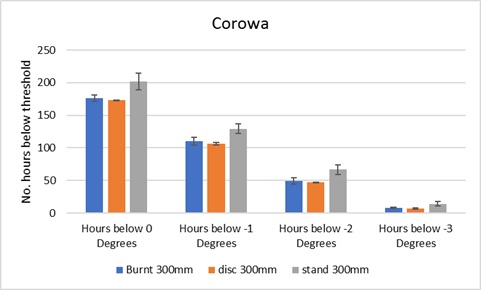
Figure 6. The number of hours that each stubble treatment spent below each temperature threshold at the Coreen/Corowa site, as monitored at the loggers placed 300mm above the soil surface, which were moved to 600mm height in September 2016 (Order of columns from left to right: burnt 300mm, disc 300mm, low 300mm and high 300mm).
While frost damage was not detected at any site, the burnt treatment at the Yarrawonga site (Figure 4) spent significantly less time below 0oC, -1oC and -2oC than the low and high standing stubble treatments.
At the Dookie site (Figure 5), both the burnt and disc treatments experienced less time below 0oC, -1oC and -2oC than the low and high standing stubble treatments. A similar response was seen at the Corowa site (Figure 6), however the differences were not statistically significant.
A key point to remember with the data logger readings is that the temperatures recorded within the crop canopy may be up to 5C less than that recorded at a weather station. Therefore, while these loggers recorded temperatures less than zero, the adjacent weather station may still read above zero.
As frost damage tends to occur when the weather station reports temperatures less than zero, it is possible that the crop can withstand slightly negative temperatures (as measured in the crop canopy) without damage.
It is also possible that the high moisture/waterlogged conditions present for the winter and the first half of spring may have reduced the risk of frost damage due to higher humidity around the crop canopy.
The in-crop temperature monitoring will continue in the 2017 season, with loggers installed immediately after sowing. This will allow a full season of temperature monitoring, and will continue to address the questions around the impacts of stubble on soil temperatures at plant establishment.
Conclusion
The impact of stubble management has differed according to site and season over the past three years. It is important to view these results within the context of the seasonal conditions. Therefore, the most productive and profitable approach to stubble management may change according to the season (wet start — dry finish, dry start — wet finish, etc).
Riverine Plains Inc continues to conduct research on behalf of its members into 2017. To broaden the delivery of research to members, Riverine Plains Inc also collaborates with other organisations on a range of research projects, from weed-seed management to soil constraints. This supports the ongoing establishment of on-farm trials within the region, ensuring that the results obtained are immediately relevant to local growers.
Acknowledgement
The research undertaken as part of this project is made possible by the significant contributions of growers through both trial cooperation and the support of the GRDC — the author would like to thank them for their continued support.
Contact details
Cassandra Schefe
Riverine Plains Inc, PO Box 214 Mulwala NSW 2647
(03) 5744 1713
extension@riverineplains.com.au
GRDC Project Code: RP10009,
Was this page helpful?
YOUR FEEDBACK