A summary of the economics of deep P nutrition trials in the northern grains region: where have current trials provided economic benefits?
Author: James Hagan, Dr David Lester, Dr Andrew Zull, Queensland Department of Agriculture and Fisheries | Date: 07 Mar 2017
Take home messages
- Yield increases of 10% or more in 21/43 site observations, whilst 30/43 observations had responses of 5% or more to 20P.
- There does not appear to be a significant difference in response to P rate, with the average yield increase across 20P, 30 and 40P (combined), and 60 and 80P (combined) rates all being approximately 10%.
- The majority of treatments did not create a positive return in the first two years, with 7 of 21 sites having currently returned a net benefit.
Background
Phosphorus (P) requirements for early crop development are well known in the Northern Grains Region, (QLD and Northern NSW) with critical limits defined and the use of starter P fertilisers well adopted. However, sub-soil P requirements are not so readily understood.
Later season P has traditionally come from native subsoil P reserves, but as we deplete this P in harvested grain the need to introduce fertiliser sources to replenish these reserves is becoming more urgent, as stratification occurs.
Nutrient stratification occurs when there is a redistribution of non-mobile nutrients such as P from the lower parts of the profile (10-30cm) and then being released through stubble breakdown into the top 10cm of the profile, is an increasing issue across the Northern Region.
Table 1. Critical P values and their relationship to P fertiliser decisions in northern vertosols
|
|
Colwell P |
BSES P |
Fertiliser decision |
|
Do I need to apply deep P? (10-30cm depth) |
>10 mg/kg |
NA |
No |
|
<10 mg/kg |
30-100 mg/kg |
Possibly |
|
|
<10 mg/kg |
<30 mg/kg |
Highly Likely |
The values shown in Table 1 are the estimated Subsoil P critical limits required for vertosols in the northern grains region prior to trials and case studies being commenced. (Bell, 2014)
As P is an immobile nutrient replacing it in this subsoil layer requires it to be either placed there or moved there mechanically after being placed on the surface. In order to fit in with current no-till farming system it was decided placing the nutrients at depth via less intensive tillage would be preferable to inversion for the aims of this project and more likely to be adopted across the northern grains region.
Treatments
Trial sites were setup across the Northern Grains Region from summer 2011 onwards (Figure 1), with the first crops harvested in 2013. All sites were initially treated with background levels of 80 units nitrogen (N), 50 units potassium (K), 20 units sulphur (S) and 0.1kg of zinc (Zn) in order to ensure that the sites were unconstrained by other nutrients, these treatments are outlined in Table 2.
Each of the sites selected had a 10-30cm Colwell-P of less than 10, and were chosen with the expectation that they would be responsive. Only 3 of the sites had a 10-30cm Colwell-P of greater than 6.
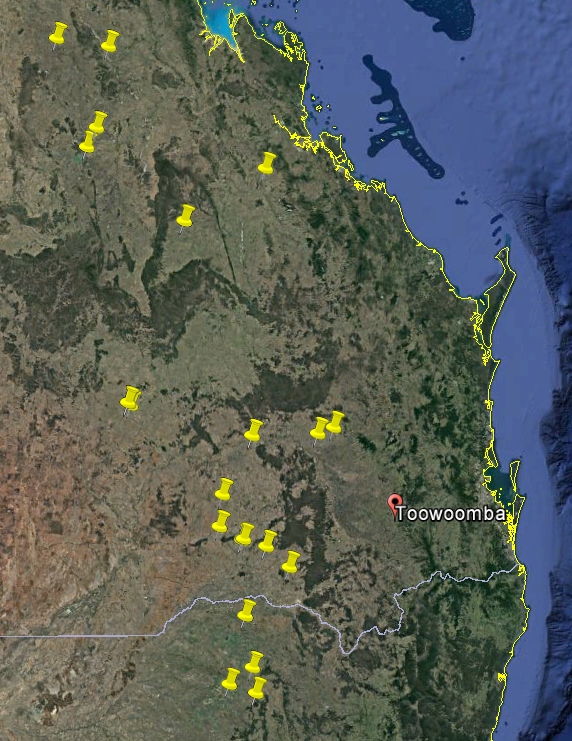
Figure 1. Trial site distribution across northern region
Rates of P ranged from 0 – 80kg, every site had a 0 and 20kg P rate, whilst the upper end luxury rates were either 40 and 80kg, or 30 and 60kg. The analysis in this paper merges the results from 30 and 40kg, and 60 and 80kg, whilst keeping costs separate. The sites also had a farmer reference treatment, which was the farmer’s normal fertiliser treatment of that paddock without any tillage as a baseline.
The fertiliser makeup varied across trial sites as would be expected for farm based implementation, with choices driven by nutrients required and the price of different fertiliser mixes to achieve these nutrients eg MAP vs DAP, NPK mixes etc. The analysis in this paper will use the examples of Urea for N, Monoammonium Phosphate (MAP) for P and Sulphate of Potash (SOP) for K and S, with Zn applied as Trace Zn.
Table 2. Trial nutrient makeup and cost ($/t)
|
Nutrient |
Treatment (kg/ha) |
Applied as |
Price ($/t) |
|
Nitrogen (N) |
80 |
Urea (46N) |
$400 |
|
Phosphorus (P) |
Variable |
MAP (22P, 11N) |
$800 |
|
Potassium (K) |
50 |
SOP (41.5K, 18S) |
$800 |
|
Sulfur (S) |
20 |
SOP (41.5K, 18S) |
$800 |
|
Zinc (Zn) |
0.1 |
Trace Zn (93Zn) |
$2000 |
Note i: 80N background rate was total N applied to site pre seeding, as MAP rate increased Urea application was lowered by ~25%, Likewise SOP applied for 50 units of K would also supply ~20 units of S.
Costs for the application of deep- P when applied with current commercial farm equipment has ranged from $15 - $40 /ha, the analysis in this paper will use a flat rate of $30 /ha.
Table 3. Estimated trial treatment costs by P rate ($/ha)
|
|
Application ($/ha) |
Urea ($/ha) |
MAP ($/ha) |
SOP ($/ha) |
Elemental Zinc ($/ha) |
Total treatment cost ($/ha) |
|
0P |
$30 |
$69 |
$0.00 |
$96 |
$0.22 |
$196 |
|
20P |
$30 |
$61 |
$73 |
$96 |
$0.22 |
$260 |
|
30P |
$30 |
$57 |
$109 |
$96 |
$0.22 |
$292 |
|
40P |
$30 |
$52 |
$145 |
$96 |
$0.22 |
$324 |
|
60P |
$30 |
$43 |
$218 |
$96 |
$0.22 |
$388 |
|
80P |
$30 |
$35 |
$291 |
$96 |
$0.22 |
$452 |
Note ii: K and S were applied as backgrounding to ensure unconstrained soil for scientific results, Grower implementation may be able to remove this cost depending on soil test status.
As noted above K and S were applied to ensure measured responses were to P and that the size of the responses would not be constrained by lack of some other element. In practice if a paddocks K and S levels were not deficient then it would be reasonable to remove this treatment and its $96/ha cost.
Average crop prices (Table 4) are used in order to avoid the large fluctuations in chickpea and mungbean prices that occurred during trial period, to ensure that a percentage change in crop production in 2013 is equivalent to the same change in 2015. The use of average prices also gives a more realistic indication of the long term economics of deep P.
Table 4. Average crop prices used in deep P analysis
|
Crop |
Price ($/t) |
|
Barley |
230 |
|
Chickpea |
500 |
|
Mungbean |
750 |
|
Sorghum |
250 |
|
Wheat |
250 |
|
Durum |
300 |
Results
Positive yield responses greater than 5% to the 20P rate were witnessed in 30 of 43 observations, whilst 21 of 43 observations had responses of 10% or more. There does not appear to be a rate response between the rates of P used with rates from 20 – 80P providing a very similar range of responses across the 16 sites.
A number of sites appear to have had a positive response to the background K, N, S and Z treatments, with the 0P treatment having an average yield response of 4%, and 9/46 responses being greater than 10%. The data (not shown) suggests that the sites with highest 0P responses were heavily influenced by K.
Three crop types dominate the dataset, with 42/43 observations being one of chickpea (15), sorghum (14) or wheat (13). Chickpea yield responses were lower than both wheat and sorghum on average, however had a similar distribution as shown in Figure 2.
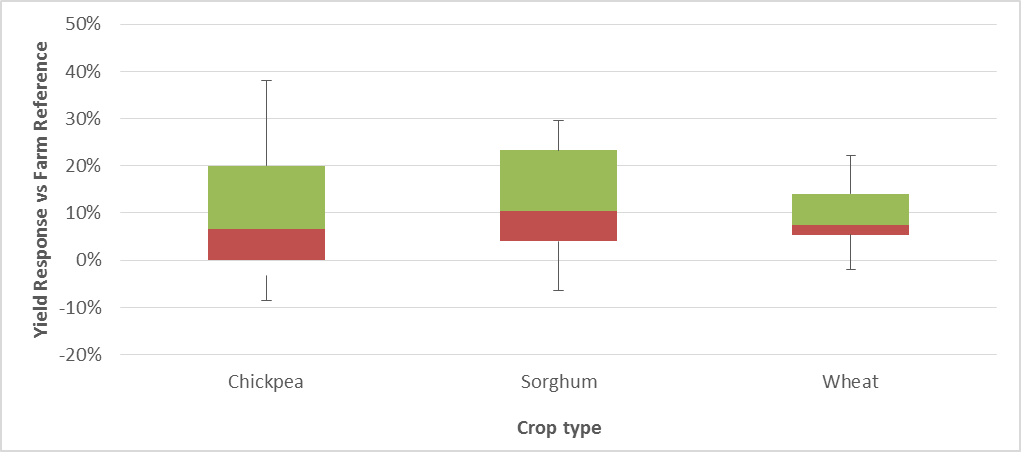
Figure 2. 20P yield distribution vs farm reference by crop type
There is a strong similarity in the responses between the different P rates as illustrated in Figure 2, because of this further analysis in this paper will focus on the 20P rate, which is most likely to have provided net positive returns over a shorter time period given its lower upfront costs.
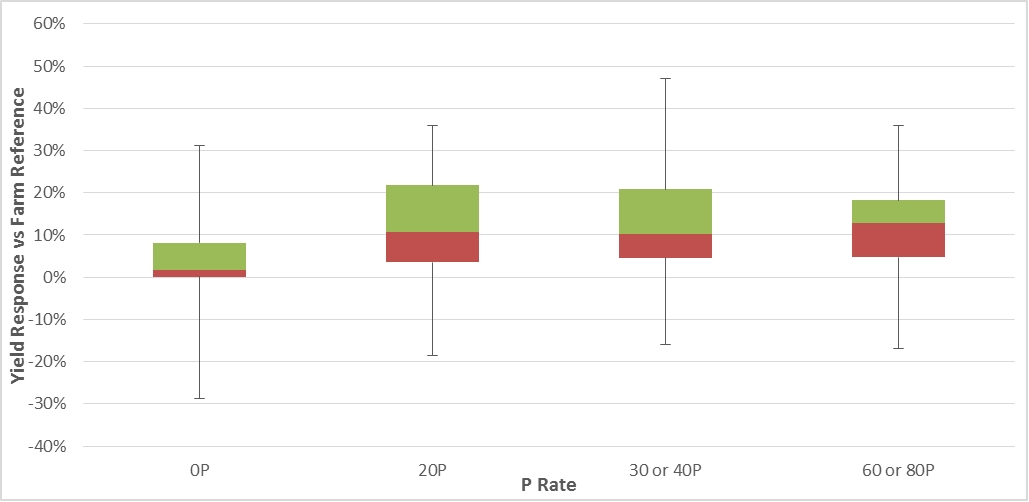
Figure 3. Distribution of yield responses across 46 observations per treatment vs farm reference
It should also be noted that despite the background treatment of N in year 1 in all trials, some extremely low sorghum proteins have been recorded in following years, suggesting that a number of sites may have been N constrained, which would mask any P response.
Only one of the 21 sites achieved a positive return in the first year as shown in Table 5. This is typical of longer term decisions with large upfront costs and returns expected over a number of following years. If the K and S treatments were assumed to not take place then the 20P treatment would have generated a benefit at 5 of the 21 sites in the first year.
Table 5. Cumulative net benefit generated over time by 20P treatment
|
|
Year 1 |
Year 2 |
Year 3 |
|
Number of sites |
21 |
15 |
7 |
|
Average cumulative net benefit |
-$160 /ha |
-$77 /ha |
-$67 /ha |
|
Max net benefit |
$10 /ha |
$126 /ha |
$235 /ha |
|
Number of positive sites |
1 |
5 |
3 |
The average first year result for the 20P treatment generated an income of $100/ha more than the farm reference treatment, however this was not enough to offset the $260/ha upfront cost. Five of the 15 sites generated profits in the second year, with the average income increase being approximately $80/ha.
If it was assumed that these sites had sufficient K and S thus did not require additional treatment, then 9 of 15 sites that we have 2 or more years of data for would have returned a positive net benefit in the second year.
Table 6. Cumulative net benefit to 20P assuming no additional K or S required
|
|
Year 1 |
Year 2 |
Year 3 |
|
Number of sites |
21 |
15 |
7 |
|
Average net benefit |
-$73 |
-$5 |
-$11 |
|
Max net benefit |
$106 |
$222 |
$331 |
|
Number of positive sites |
5 |
9 |
3 |
Unfortunately 4/7 sites for which three or more years of data exist were largely unresponsive and removing the K and S cost is not sufficient for these sites to generate a profit. There was no correlation between the sites that were unresponsive and their starting Colwell-P test results.
The data from these trials has been used to assist in the development of a deep-P calculator which will be available soon.
Conclusion
The majority of sites achieved positive yield responses to deep-P application, however the majority of sites have not generated additional profits in the first two years. Additional monitoring will be required to determine what the difference in duration of response is between the rates used and whether the higher rates can prove economical over time.
Responses to P have varied by year, with season type being an important factor, it is believed that in-season rainfall will allow plant access to P in the 0-10cm layer, reducing the reliance on sub-soil P, thus reducing the potential benefits. Seasons where there is minimal in-season rainfall are expected to obtain greater benefit from deep-P.
Acknowledgements
The research undertaken as part of this project is made possible by the significant contributions of growers through both trial cooperation and the support of the GRDC across a number of projects, UQ00063 / DAQ00194 / CSA00036 the author would like to thank them for their continued support.
References
Update paper - Bell Mike, Lester David, Zull Andrew, Cox Howard - (2014), The economics of deep Phosphorus use in marginal environments
Contact details
James HaganDAF
PO Box 102
Toowoomba QLD 4350
Ph: 07 4529 4273
Mb: 0476828018
Email: james.hagan@daf.qld.gov.au
Was this page helpful?
YOUR FEEDBACK