Agronomic drivers of yield in rainfed wheat production systems of the Northern Grains Region (Northern NSW)
Author: Rick Graham, Steven Simpfendorfer, Guy McMullen and Neroli Graham, NSW DPI Tamworth | Date: 07 Mar 2017
Take home message
- Timely sowing of broadly adapted varieties in the early part of their optimum sowing window was found to be a key determinant of yield across all environments. Delays in sowing resulted in significant declines in yield potential, which was also influenced by environment and season.
- Commercially available mid-late maturing spring wheat varieties (e.g. EGA Gregory, Suntop, LRPB Lancer) were observed to be broadly adapted and plastic in their yield responses, performing consistently across sowing windows.
- Altering variety and/or maturity type, and increasing target plant populations in response to delays in time of sowing (TOS) could not fully compensate for yield losses associated with delayed sowings.
- Yield responses to Nitrogen (N) and Phosphorus (P) fertiliser application rates, were variable and influenced by starting soil nutrition and seasonal conditions.
- Crown rot (CR) was shown to be a significant factor influencing yield potential in inoculated vs. uninoculated experiments. Results highlight the compounding negative impact of delayed sowing and CR infection on yield potential and underline the need for awareness of risk levels from soil-borne pathogens prior to sowing, in order to guide management decisions.
Background
It is currently estimated that growers in the GRDC Northern Grains Region (NGR) are achieving on average 49% of water limited yield potential (www.yieldgapaustralia.com.au). Water-limited yield potential being defined as the potential yield achieved under non-limiting nutrition and biotic stresses using best management practices, including timely sowing of well adapted commercial varieties, but subject to environmental constraints namely plant available water and temperature (Hochman et al., 2012). To put this into perspective, leading growers using best management practices and available technology are estimated to be achieving around 80% of water-limited yield potential (van Rees et al., 2014). Based on these observations, there is an ‘exploitable yield gap’ between actual and attainable yields (i.e. 80% of water limited yield potential) considered the approximation of where grower’s yields plateau within most major cropping systems, as a result of economic constraints and climatic variability (van Ittersum et al., 2013).
Identifying the key drivers of yield in water-limited, rain fed environments and quantifying their impact, is clearly an important strategy for reducing the exploitable yield gap and for improving dryland wheat production. The following paper reports on research conducted by NSW DPI with GRDC funding across the north-west slopes and plains of NSW from 2014 to 2015 that looked at possible factors affecting yield potential. The drivers of yield and/or yield limiting factors investigated included variety selection (maturity type), time of sowing (TOS), plant population and fertiliser inputs (e.g. nitrogen and phosphorus). In addition to this, crown rot caused predominantly by the fungus Fusarium pseudograminearum (Fp), a major disease of wheat and barley crops in the NGR, was also a component of this research.
What did we investigate?
In 2014 and 2015, a series of partially factorial experiments were conducted to benchmark yield potential and the impact of agronomic variables (variety choice, maturity grouping, TOS, target plant population, N rate, P rate and ± Fp infection) on yield potential, on the Liverpool Plains (LPP) of NNSW, these experiments form part of a larger study outlined in Graham et al. (2017). In addition to this yield gap study, we also looked at a range of experiments conducted across NNSW, from 2014 to 2015 that considered agronomic variables (e.g. variety/maturity grouping by TOS, variety by population by TOS, variety by ± Fp by TOS) in isolation and/or in combination, enabling us to compare findings with the conclusions drawn from the yield gap experiments conducted on the LPP.
Liverpool Plains (LPP)
Experiments were conducted at two sites in both 2014 and 2015. Site descriptions including location and year, and in-crop rainfall are shown in Table 1, with soil type and starting soil nitrate N and Colwell P values listed in Table 2.
Table 1. Time of sowing, growing season rainfall and plant available water capacity (PAWC)
|
Site and year |
TOS 1 |
TOS 2 |
Growing Season rain*(mm) |
PAWC (mm) |
|
Spring Ridge 2014 |
14 May |
1 July |
174 |
~120 |
|
Mullaley 2015 |
20 May |
8 July |
185 |
~140 |
|
Tamarang 2014 |
9 May |
30 June |
170 |
~210 |
|
Tamarang 2015 |
19 May |
9 July |
252 |
~150 |
A series of 36 treatment combinations (2 times of sowing x 18 treatments) were examined in a partially factorial split-plot design, with three replicates at all sites (Table 3). Treatments were designed similar to an exclusion experiment, with a high input treatment aimed at providing the perceived optimum combination of factors and a low input treatment comprising a base set of agronomic factors, so as to benchmark treatment variables (Table 4).
Four commercial spring wheat (Triticum aestivum) varieties widely grown and well adapted to targeted growing environments were selected and sown at each site. Varieties were from two different maturity groupings, two main season-moderate maturing varieties EGA Gregory and Sunvale, and two fast-moderate maturing varieties LRPB Crusader and LRPB Spitfire. At each location, varieties were sown at two times of sowing (TOS) an early-main season and a delayed TOS (Table 1). Targeted plant populations were grouped as low, moderate (district practice) or high, targeting 60, 120 and 180 plants/m2 respectively (Table 3).
Table 2. Soil type, starting soil N (nitrate N) and Colwell P
|
Site and year |
Soil type |
P (Cowell) (mg/kg) |
Soil N03 (kg N/ha) |
|
Spring Ridge 2014 |
Black Vertosol |
25 |
123 |
|
Mullaley 2015 |
Grey Vertosol |
46 |
178 |
|
Tamarang 2014 |
Brown Vertosol |
77 |
167 |
|
Tamarang 2015 |
Brown Vertosol |
60 |
213 |
Fertiliser treatments looked at both Nitrogen (N) and Phosphorus (P) with rates, products and application methods outlined in Table 3. Crown rot treatments were applied at sowing using sterilised durum grain colonised by at least five isolates of Fusarium pseudograminearum (Fp) as described by Dodman and Wildermuth (1987), with inoculum rates as per Table 3.
Table 3. Summary of treatments: time of sowing, variety, plant population, nitrogen and phosphorous rates and crown rot inoculum levels.
|
Treatment |
Details |
|
Two times of sowing (TOS) |
TOS 1 - early/main season TOS 2 - delayed |
|
4 Varieties |
EGA Gregory (TOS 1 & 2), LRPB Spitfire (TOS 2), Sunvale (TOS 1), LRPB Crusader (TOS 1 & 2) |
|
3 Plant populations |
60, 120 or 180 plants/m2 |
|
5 Nitrogen rates |
0, 50, 100, 150 or a 50 + 50 kg N/ha split application all applied as urea (46% N). Treatments were side banded at sowing, apart from the split application which was applied at sowing and broadcast at stem elongation (GS31). |
|
4 Phosphorus rates |
0, 10, 20 or 30 kg/ha P applied as triple super at sowing |
|
4 Crown rot (CR) inoculum rates |
0, 0.5, 1.0 or 2.0 g/m row sterilised durum grain colonised by at least 5 different isolates of Fp +/- added at sowing i.e.; 0, CR+, CR++ or CR+++ |
Small plot sowing equipment based on 33 cm row spacing’s x 5 rows, with two metre centres was used to sow experimental plots of ~10 metres length, with grain yield obtained using small-plot harvesters.
Table 4. List of experimental treatments.
|
Treatment |
TOS |
Variety |
Applied Nitrogen (kg/ha) |
Population (plant/m2) |
Applied Phosphorus (kg/ha) |
Disease |
|
1 |
Early/Main |
EGA Gregory |
0 |
120 |
20 |
Nil |
|
2 |
Early/Main |
EGA Gregory |
50 |
120 |
20 |
Nil |
|
3 |
Early/Main |
EGA Gregory* |
100 |
120 |
20 |
Nil |
|
4 |
Early/Main |
EGA Gregory |
50+50 |
120 |
20 |
Nil |
|
5 |
Early/Main |
Sunvale |
100 |
120 |
20 |
Nil |
|
6 |
Early/Main |
LRPB Crusader |
100 |
120 |
20 |
Nil |
|
7 |
Early/Main |
EGA Gregory |
100 |
60 |
20 |
Nil |
|
8 |
Early/Main |
EGA Gregory |
100 |
180 |
20 |
Nil |
|
9 |
Early/Main |
EGA Gregory |
100 |
120 |
0 |
Nil |
|
10 |
Early/Main |
EGA Gregory |
100 |
120 |
10 |
Nil |
|
11 |
Early/Main |
EGA Gregory |
100 |
120 |
20 |
CR+ |
|
12 |
Early/Main |
EGA Gregory |
100 |
120 |
20 |
CR++ |
|
13 |
Early/Main |
EGA Gregory |
100 |
120 |
20 |
CR+++ |
|
14 |
Early/Main |
EGA Gregory |
0 |
none120 |
0 |
Nil |
|
15 |
Early/Main |
Sunvale |
0 |
120 |
0 |
Nil |
|
16 |
Early/Main |
LRPB Crusader |
0 |
120 |
0 |
Nil |
|
17 |
Early/Main |
EGA Gregory |
150 |
120 |
20 |
Nil |
|
18 |
Early/Main |
EGA Gregory |
100 |
120 |
30 |
Nil |
|
19 |
Delayed |
LRPB Spitfire |
0 |
120 |
20 |
Nil |
|
20 |
Delayed |
LRPB Spitfire |
50 |
120 |
20 |
Nil |
|
21 |
Delayed |
LRPB Spitfire* |
100 |
120 |
20 |
Nil |
|
22 |
Delayed |
LRPB Spitfire |
50+50 |
120 |
20 |
Nil |
|
23 |
Delayed |
LRPB Crusader |
100 |
120 |
20 |
Nil |
|
24 |
Delayed |
EGA Gregory |
100 |
120 |
20 |
Nil |
|
25 |
Delayed |
LRPB Spitfire |
100 |
60 |
20 |
Nil |
|
26 |
Delayed |
LRPB Spitfire |
100 |
180 |
20 |
Nil |
|
27 |
Delayed |
LRPB Spitfire |
100 |
120 |
0 |
Nil |
|
28 |
Delayed |
LRPB Spitfire |
100 |
120 |
10 |
Nil |
|
29 |
Delayed |
LRPB Spitfire |
100 |
120 |
20 |
CR+ |
|
30 |
Delayed |
LRPB Spitfire |
100 |
120 |
20 |
CR++ |
|
31 |
Delayed |
LRPB Spitfire |
100 |
120 |
20 |
CR+++ |
|
32 |
Delayed |
LRPB Spitfire |
0 |
120 |
0 |
Nil |
|
33 |
Delayed |
LRPB Crusader |
0 |
120 |
0 |
Nil |
|
34 |
Delayed |
EGA Gregory |
0 |
120 |
0 |
Nil |
|
35 |
Delayed |
LRPB Spitfire |
150 |
120 |
20 |
Nil |
|
36 |
Delayed |
LRPB Spitfire |
100 |
120 |
30 |
Nil |
*High input combinations EGA Gregory TOS 1 and LRPB Spitfire TOS 2.
Results LPP
Yield results varied between site and year, and ranged from 5.91 t/ha at Tamarang in 2014 for TOS 1, to 2.62 t/ha at Spring Ridge for TOS 2 in 2014, averaged across treatments (data not shown). When looking at the across site analysis, timeliness of sowing was found to be a significant driver of yield, delays in TOS reducing yields by 0.60 t/ha or 13% when comparing high input (100 kg N/ha, 120 plants/m2 , 20 kg P/ha) EGA Gregory treatments (Table 5). On an individual site basis, when comparing EGA Gregory for TOS, delays in sowing date resulted in yield declines of 6.0 kg/day up to 28.8 kg/day. The only site not to show a yield response due to an earlier TOS was Tamarang in 2015. This was most likely due to the impact of frost induced sterility, with minimum temperatures of < 0°C occurring during the period from the 28th August to the 1st September, coinciding with head emergence/anthesis, resulting in a 14.5% decrease in the yield of EGA Gregory between TOS 1 and TOS 2 (data not shown).
Table 5. Effect of management and crown rot (Fp) on grain yield potential – LPP across site analysis
|
Variety |
Population (plants/m2) |
Applied N (kg/ha) |
Applied P (kg/ha) |
Fp (CR+++) |
Yield (t/ha) |
Yield Gap (t/ha) |
|
TOS 1 |
||||||
|
EGA Gregory |
120 |
100 |
20 |
0 |
4.571 |
|
|
EGA Gregory |
120 |
100 |
20 |
+++ |
4.26 |
-0.31* |
|
TOS 2 |
||||||
|
EGA Gregory |
120 |
100 |
20 |
0 |
3.971 |
-0.60* |
|
LRPB Crusader |
120 |
100 |
20 |
0 |
3.65 |
-0.32* |
|
LRPB Spitfire |
120 |
100 |
20 |
0 |
3.55 |
-0.42* |
|
LRPB Spitfire |
120 |
100 |
20 |
+++ |
3.13 |
-0.84* |
*Contrast are significant (P<0.05). 1EGA Gregory TOS 1 vs. TOS 2 contrast.
Maturity type was not a significant factor in TOS 1, with no difference (P>0.05) in yield between varieties. Variety choice did however, impact yield in TOS 2, with EGA Gregory significantly (P<0.001) out yielding both the quicker maturing varieties LRPB Crusader and LRPB Spitfire by 0.32 and 0.42 t/ha respectively (Table 5). The yield contrast between EGA Gregory in TOS 1 and LRPB Crusader in TOS 2 equated to 0.92 t/ha or 20%, compared to 0.60 t/ha or 13% for EGA Gregory in TOS 2 (Table 5).
Increasing crown rot (CR) disease pressure (+ Fp applied at sowing) resulted in a decrease in yield in TOS 1 of 0.31 t/ha equating to a 7% decrease in yield (Table 5). Similarly in TOS 2, yield was also impacted by CR, with LRPB Spitfire experiencing a 0.42 t/ha or 12% decrease in yield due to CR, when all other variables were held constant (Table 5). Importantly, when contrasting the combined effects of TOS, CR disease pressure and genotype, potential yield decreased by 1.44 t/ha or ~31.5%.
Varying N and P application rates had a limited effect on yield potential, most likely due to the relatively high starting soil N and Colwell P values (Table 2). There was a small but significant (P<.001) response to P application rates (Nil vs. 30 units of P) of 0.17 t/ha (3.44 vs. 3.61 t/ha) in TOS 2 (data not shown). Interestingly, when looking at high input (100 kg N/ha + 20 kg P/ha) versus the low input treatments (Nil N and P), there was a 0.31 t/ha or ~7% difference in yield in TOS 1 (data not shown). The only site to show a significant yield response to N application was Tamarang TOS 1 in 2014, with a 9% increase in yield with the application of 100 kg N compared with the Nil treatment.
Other agronomic factors to adversely impact yield potential included plant population at Tamarang in 2014 with the delayed TOS 2 treatment. The low target population of 60 plants/m2 was significantly (P<0.05) lower yielding than the 120 and 180 plants/m2 treatments, at 3.67 t/ha vs. 4.01 t/ha and 4.04 t/ha respectively, supporting the accepted principal of increasing targeted plant populations with delayed sowing times (data not shown).
Effect of variety and TOS on yield
Variety selection and maturity type are important factors when considering TOS opportunities, with the combination of sowing date and variety, determining the probable timing of environmental stresses (frost and heat/moisture stress). In the NGR, the grain-filling period is commonly characterised by increasing temperatures and water deficits. In these environments, there is a clear advantage to ensuring that anthesis and grain filling occur soon after the period of heightened frost risk, but before late season water deficits and increasing temperatures reduce yield potential (Robertson et al., 2016)
Timeliness of sowing was shown to be an important driver of yield on the LPP, with significant declines in yield due to delays in TOS. Averaged across sites and years, there was a 13% to 20% decline in yield for early vs. late sowing options, depending on variety selection (Table 5). The main season variety EGA Gregory performed well across sowing times, out yielding faster maturing varieties (LRPB Crusader and LRPB Spitfire) even when TOS was delayed. The implications from this study and other research, being that some commercially released Australian spring wheat varieties tend to be broadly adapted to a wide range of environments, with early sowing options, more advantageous than delayed sowing (Sharma et al., 2008) implying that growers could possibly select the best performing/ranked variety for their region and sow it as early as possible (Lawes et al., 2016). Importantly, these finding relate only to spring wheat types and the sowing windows investigated.
Narrabri 2014 and 2015
To further investigate TOS responses and possible G x E x M interactions, we also looked at water-limited TOS experiments conducted at Narrabri in 2014 and 2015.
Timeliness of sowing was again shown to be a significant driver of yield at Narrabri in 2014, with yield declines of 0.96 t/ha or 23% (23 April vs. 12 June) for the best performing main season variety Suntop. When comparing EGA Gregory with the two faster maturing varieties, LRPB Crusader and LRPB Spitfire over a wide sowing window (23 April to 4 July) varietal yields differed significantly with TOS. Sowing LRPB Crusader and LRPB Spitfire, earlier than recommended resulted in yield reductions of ~29% or 1.45 t/ha and 1.49 t/ha respectively. These declines in yield were due most likely to frost induced sterility, with a -3.3°C frost on August 12, corresponding with head emergence/anthesis. In comparison, mid-late maturing varieties (e.g. EGA Gregory, LRPB Lancer, Suntop and Sunvale) showed no significant difference between sowing dates (April 23 vs. May 15) indicating that these varieties are quite adaptable across sowing times. However, when comparing varieties, with a delayed TOS (June 12), the faster maturing varieties LRPB Crusader and LRPB Spitfire, out yielded both EGA Gregory and Sunvale. On this basis, when comparing these varieties (i.e. as per the LPP study) it could be argued that variety selection (G x E x M) could be used as a management strategy to improve yield potential.
We have however, seen the release of a number of broadly adapted main season varieties (e.g. Suntop and LRPB Lancer) as well as some EGA Gregory type replacements, which have shown improved yield stability over a range of sowing times and environments. As a consequence, when looking at variety response to TOS for yield at Narrabri in 2014, you see varieties such as Suntop performing consistently across the sowing window, achieving comparable yields to the shorter season varieties LRPB Crusader and LRPB Spitfire with delayed sowings (Figure 1).
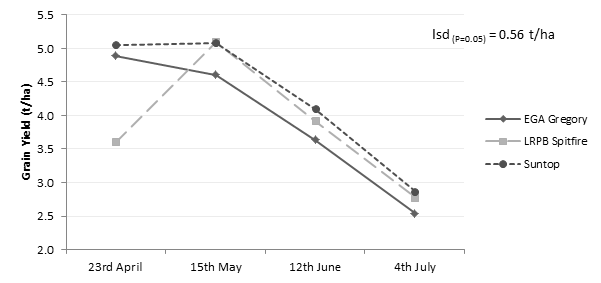
Figure 1. Grain yield response for an early (LRPB Spitfire), main season (Suntop) and a mid-late season wheat variety (EGA Gregory) across four sow times – Narrabri 2014
Narrabri 2015 TOS findings, also established timeliness of sowing as a significant driver of yield, with yields declining by 1.57 t/ha or 30%, for Suntop for an early vs. delayed sowing (29 April vs. 15 June). Results again emphasised the yield stability of main season varieties such as Suntop, which achieved comparable yields to mid-late maturing varieties (e.g. LRPB Lancer) from an early TOS, showing improved yield potential compared to short season varieties (e.g. LRPB Spitfire) with delayed sowings (Figure 2).
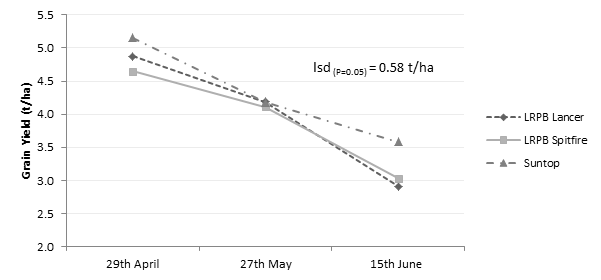
Figure 2. Grain yield response for an early (LRPB Spitfire), main (Suntop) mid-late season wheat variety (LRPB Lancer) across three sow times – Narrabri 2015
Effect of variety, plant population and TOS on yield
Results from the LPP, showed that apart from Tamarang in 2014, where there was a yield response to increased plant population with delayed sowing, altering targeted plant population (Table 4) did not have a significant effect on yield, underscoring wheat’s ability to compensate for lower plant populations, under good growing conditions. Increasing plant populations in response to delays in TOS was however, shown to increase yield potential in lower yielding environments in yield gap studies conducted at Nyngan and Trangie in 2014 and 2015 (Graham et al., 2017). Importantly these results showed that altering variety and maturity type, and increasing targeted plant populations in response to delays in TOS, could not fully compensate for the yield losses associated with delayed sowings, highlighting the importance of timely sowing.
Terry Hie Hie 2015
To further investigate the effect of variety, population and TOS responses on yield in the NGR, six commercial spring wheat varieties from a range of maturities namely, LRPB Dart, EGA Eaglehawk, EGA Gregory, LRPB Lancer, LRPB Spitfire and Suntop, were sown at three targeted populations (50, 100 and 200 plants/m2) and two separate sowing dates (8 May and 7 June) at Terry Hie Hie on the North West Plains of NSW, in 2015.
We observed a grain yield response for plant population, in TOS 1 (8 May) but no population by variety interaction. Yield was optimised at a target plant population of 100 plants/m2 in TOS 1, with no significant difference (P<0.05) between 100 and 200 plants/m2. In TOS 2 with a delayed sowing, plant population also had a significant effect on yield, increasing up to the 200 plants/m2 treatment, with no population by variety interaction. Increasing plant population, had a greater effect on grain yield with a delayed sowing (TOS 2 vs. TOS 1), supporting the principal of increasing targeted population with delayed sowings.
The results from this study highlighted the importance of timeliness of sowing, particularly mid-late varieties, with a yield reduction of ~26% or 1.32 t/ha averaged across population treatments for EGA Gregory (5.09 t/ha vs. 3.77 t/ha) and Suntop suffering a 14% or 0.71 t/ha (5.18 t/ha vs. 4.47 t/ha) yield decline. The mid-late maturing varieties EGA Gregory, LRPB Lancer, and Suntop were the highest yielding varieties in TOS 1, whilst the early maturing varieties (e.g. LRPB Dart) did not exhibit any yield advantage over Suntop and LRPB Lancer in TOS 2, and were significantly lower yielding than these varieties in TOS 1.
Apart from yield, grain quality parameters, screenings in particular, were also influenced by variety selection and TOS, with screenings (%) increasing with delayed sowings. The main point to note from this research was that increasing the target plant population in response to delays in TOS, could not fully compensate for yield losses associated with delayed sowings (Figure 3).
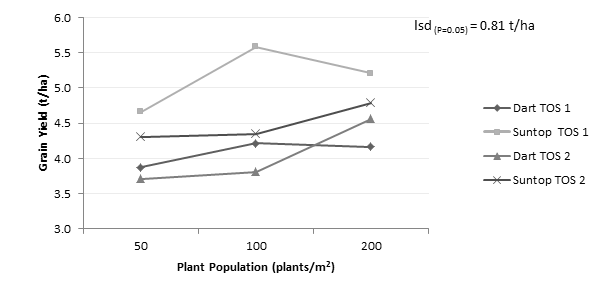
Figure 3. Grain yield response for two varieties (LRPB Dart and Suntop) sown at three target plant populations across two sowing dates (TOS 1; 6 May, TOS 2; 7 June)- Terry Hie Hie 2015
Effect of crown rot, variety and TOS on yield
Apart from agronomic t factors (i.e. Variety/Maturity, TOS, Population) we also looked at the effect of crown rot (caused predominantly by the fungus Fusarium pseudograminearum) a major disease of wheat in the NGR on yield. Results from the LPP study, found that additional CR disease pressure (+ Fp applied at sowing) resulted in decreases in yield of 7% (0.31 t/ha) from an early TOS, and 12% (0.42 t/ha) with a delayed TOS, when all other variable were held constant (Table 5).
Tulloona 2015
To further gauge the effect of CR, TOS and variety selection on yield, results from a replicated CR yield loss experiment, conducted near Tulloona in 2015, that included 19 wheat varieties is presented and is outlined in Graham et al. (2016). The experiment used an inoculated vs. uninoculated design, to evaluate the relative yield response of varieties to ± Fp infection across two TOS (6 May and 4 June). The site was soil cored prior to sowing (separate bulk samples across each range) to determine background pathogen levels using the DNA based soil test PreDicta B®. CR inoculum levels were at a medium risk level (2.0 log Fusarium DNA/g soil) and populations of the root lesion nematode (RLN) Pratylenchus thornei (Pt) were medium (2.5 Pt/g soil) with P. neglectus below detection limit across the Tulloona trial site at sowing in 2015.
Yields were reduced from 5.29 t/ha down to 4.20 t/ha (TOS 1 vs TOS 2) averaged across varieties for nil added CR (-Fp) treatments. This represented a 20% (1.09 t/ha) reduction in yield potential with a delayed sowing of four weeks. However, in the presence of high levels of crown rot infection (+Fp) average yield across entries was reduced from 4.78 t/ha down to 3.24 t/ha (TOS 1 vs TOS 2) which represented a larger 32% (1.54 t/ha) reduction in yield potential associated with delayed sowing. This was due to a considerabley higher average level of yield loss associated with increased CR infection of 23% (0.96 t/ha) for TOS 2 compared to an average of 10% (0.51 t/ha) in TOS 1.
In the nil CR treatment, yields ranged from 6.13 t/ha for the advanced breeding line QT15046R down to 3.28 t/ha for LRPB Dart, which was impacted by frost. Eleven of the 19 wheat entries evaluated (including Sunguard, Beckom, Elmore CL, Suntop, QT15046R, LRPB Flanker, and EGA Gregory) suffered signficant levels of yield loss with added CR infection in TOS 1 ranging from 9% (0.50 t/ha) in Sunguard up to 23% (1.27 t/ha) for EGA Gregory (Figure 4).In TOS 2, 16 of the 19 bread wheat entries (all except for Sunguard, LRPB Lancer and Elmore CL) suffered signficant levels of yield loss with added CR infection (+Fp), losses ranging from 14% (0.60 t/ha) in LRPB Dart up to 36% (1.62 t/ha) with LRPB Flanker (Figure 4).
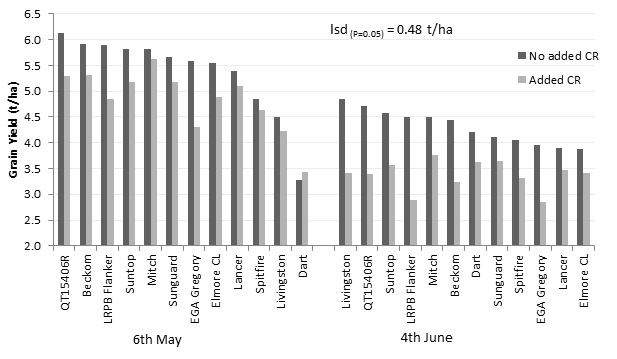
Figure 4. Impact of crown rot on yield of selected wheat varieties for two sowing dates – Tulloona 2015
Importantly, these results highlighted the compounding effects of delayed TOS and CR infection. Suntop for example in TOS 1, achieved a yield of 5.82 t/ha (nil CR) and experienced a yield penalty of 11% (0.64 t/ha) in the presence of CR (+Fp) with yield declining to 5.18 t/ha. However, when TOS was delayed apart from yield declining due to delayed sowing to 4.58 t/ha, the effect of CR (+Fp) on yield increased to 22% or 1.0 t/ha, yield ultimately declining to 3.57 t/ha. As a consequence, you can see that with delayed sowing in the presence of CR, yield was decreased by ~39% (2.25 t/ha) in Suntop compared to a yield decline due to delayed sowing alone (nil CR) of ~21% , a 1.24 t/ha yield penalty.
Summary and conclusions
Timely sowing of broadly adapted varieties in the early part of their optimum sowing window was found to be a key determinant of yield potential in all environments (the exception Tamarang in 2015 with no significant difference in yields with TOS 1 vs. TOS 2). All other experiments demonstrated significant (P<0.05) increases in yield, for early-main season vs. delayed sowing options, with yield declines ranging from 8% to 28% for EGA Gregory on LPP, 32% at Tulloona, and 35% to 43% at Narrabri. Importantly, the TOS results also highlighted the risk associated with sowing early maturing varieties (e.g. LRPB Crusader) outside of their recommended sowing window, with 29% yield reductions experienced at Narrabri in 2014 due to frost.
The adaptability or plasticity of mid-late maturing spring wheat varieties and yield stability across the sowing window was also demonstrated. On the LPP, the main season variety EGA Gregory performed well across sowing times, out yielding faster maturing varieties (LRPB Crusader and LRPB Spitfire) even with delayed sowings. Similarly, at Narrabri, Suntop performed consistently across sowing times achieving comparable yields, to the shorter season varieties (e.g. LRPB Crusader and LRPB Spitfire) with delayed sowings. In all instances the mid-late maturing varieties were the highest yielding entries with an early sowing window.
These findings support the observations of Sharma et al. (2008) and Lawes et al. (2016) that commercially released Australian spring wheat varieties tend to be broadly adapted to a wide range of environments, with the best performing mid-season spring wheat variety for a region, often performing consistently across the main sowing window. An indication, that breeding companies are releasing more broadly adapted varieties that display good yield stability/plasticity across a range of growing environments.
Increasing the target plant population in response to delays in TOS were observed to improve yield potential at Terry Hie Hie in 2015. It was however shown, that by increasing the target plant population, you could not fully compensate for yield losses associated with delayed sowings. Furthermore, it was observed that the faster maturing varieties (e.g. LRPB Dart) did not exhibit a yield advantage over the mid-late maturing varieties Suntop and LRPB Lancer with a delayed sowing. These results are a further indication of the adaptability of some of the newer mid-late maturing varieties (e.g. LRPB Lancer and Suntop). Importantly, apart from yield, grain quality parameters, screenings in particular, were influenced by variety selection and TOS, with screenings (%) increasing with delayed sowings, an important consideration in terms of variety selection.
Yield responses to N and P fertiliser application rates, were found to be variable and influenced by starting soil nutrition values (relatively high starting soil N and Colwell P at some sites) and to some extent, seasonal conditions. This highlights the value in determining starting soil nutrition levels through testing and considering critical nutrient response values (e.g. Colwell P) in fertiliser decisions. N and P nutrition, based around predicted yield and critical soil values, were however crucial in ensuring that optimum yield potentials were achieved.
Crown rot caused by the fungus Fusarium pseudograminearum, was found to impact yield potential, decreasing yields by up to 12% on the LPP with delayed sowings. Whilst at Tulloona, yield losses from CR infection averaged across varieties was 23% (0.96 t/ha) for TOS 2 as opposed to 10% (0.51 t/ha) for TOS 1, highlighting the compounding effects of delayed TOS and CR infection on yield potential. Timely sowing of varieties in the early part of their sowing window can increase yield potential and reduce the extent of yield loss from crown rot, compared to a delayed TOS. It was also shown that varieties did differ in the extent of their yield loss from crown rot infection, with the production of more susceptible varieties (e.g. EGA Gregory) ideally targeted at low CR risk paddocks, based on either stubble or DNA testing such as PreDicta B®. It is however important to note, that variety choice is not the sole solution to crown rot. These findings emphasise the potential negative impact of CR on yield highlighting the need for awareness of risk levels from soil-borne pathogens prior to sowing, in order to guide management decisions.
Apart from yield, growers and advisors need to also consider grain quality parameters (e.g. screenings, grain protein concentration etc.) in any risk management strategy. They should also consider a wide range of information, such as long term NVT analysis results, market demand and disease implications, when making any variety selection. Finally although yield potential can be maximised by sowing the best performing variety in region as early as possible, seasonal conditions and risk management per se, would dictate the need for growers to retain a number of varieties with a range of maturities to ensure that risk is minimised.
References
Dodman RL, Wildermuth GB (1987). Inoculation methods for assessing resistance in wheat to crown rot caused by Fusarium graminearum group 1. Australian Journal of Agricultural Research 38, 473- 486.
Graham R, Graham N, Simpfendorfer S (2016) Yield impact of crown rot and sowing time on winter cereal crop and variety selection – Tulloona 2015
Graham R, Brooke G, McMullen G, Simpfendorfer S, Graham N (2017). Agronomic drivers of yield in rain-fed wheat production systems of the Northern Grains Region – Liverpool Plains and Central West NSW. GRDC Updates, Dubbo 28th February - 1st March, 2017
Hochman Z, Gobbett D, Holzworth D, McClelland T, van Rees H, Marinoni O, Garcia JN, Horan H (2012). Quantifying yield gaps in rainfed cropping systems: a case study of wheat in Australia. Field Crops Research 136, 85-96.
Lawes RA, Huth ND, Hochman Z (2016). Commercially available wheat cultivars are broadly adapted to location and time of sowing in Australia’s grain zone. European Journal of Agronomy 77, 38-46.
Robertson M, Kirkegaard J, Rebetzke G, Llewellyn R, Wark T (2016). Prospects for yield improvement in the Australian wheat industry: a perspective. Food and Energy Security 5, 107- 122.
Sharma DL, D’Antuono MF, Anderson WK, Shackley D, Zaicou-Kunesch CM, Amjad M (2008). Variability of optimum sowing time for wheat yield in Western Australia. Australian Journal of Agricultural Research, 2008, 59, 958–970
van Ittersum MK, Cassman KG, Grassini P, Wolf J, Tittonell P, Hochman Z (2013). Yield gap analysis with local to global relevance – a review. Field Crops Research 143, 4-17.>
van Rees H, McClelland T, Hochman Z, Carberry P, Hunt J, Huth N, Holzworth D (2014). Leading farmers in South East Australia have closed the exploitable wheat yield gap: Prospects for further improvement. Field Crops Research 164, 1-11.
Acknowledgements
The research undertaken as part of projects DAN00181, DAN00175 and DAN00167 is made possible by the significant contributions of growers through both trial cooperation and the support of the GRDC, the authors would like to thank them for their continued support. This project is co-funded by the NSW state government through the NSW DPI who are also thanked for their support in fully funding four of our positions and for laboratory and other infrastructure costs. Soil-borne pathogen levels were determined using the DNA based soil test service PreDicta B® provided by the South Australian Research and Development Institute. Technical assistance provided by Jim Perfrement, Jan Hosking, Mick Dal Santo, Peter Formann, Rod Bambach, Robyn Shapland and Patrick Mortell is gratefully acknowledged. We finally thank Jack Gooderham, David Ronald, and Michael Ledingham for allowing us to conduct these experiments on their properties.
Contact details
Rick Graham
NSW DPI, Tamworth
Ph: 0428 264 971
Email: rick.graham@dpi.nsw.gov.au
Reviewed by
Dr Steven Simpfendorfer
Varieties displaying this symbol beside them are protected under the Plant Breeders Rights Act 1994
® Registered trademark
Was this page helpful?
YOUR FEEDBACK