
· Cereal grains are fed to livestock for energy because of their high starch content.
· Individual batches of grain can vary by 3-4 MJ/kg in available energy content (energy released during digestion) for different livestock types.
- Variation is greater for pigs and poultry (3-4 MJ/kg) than for ruminants (~1 MJ/kg).
- Variation is greater for wheat, barley and triticale than for sorghum when fed to pigs and
poultry.
- Cattle obtain approximately 40% less energy per kg from sorghum than pigs or poultry and
25% less than sheep.
· The effect of environment (growing conditions) on the energy value of grains for livestock is often greater than the effect of cultivar.
· A difference of 1 MJ/kg in available energy content equates to a difference in the value of cereal grains for different livestock types (assuming $400/t for wheat):
- Growing pigs $28/t
- Broilers $53/t
- Layers $48/t
- Feedlot cattle $28/t
- Dairy cows $15/t when used as a supplement to pasture
· Animal performance (growth rate, milk yield etc.) is driven by available energy intake (MJ/day = available energy content (MJ/kg) x feed intake (kg/day)).
- Wheat samples selected for high and low available energy intake for broilers resulted in 2 days difference in time to sale, which equates to a difference in profit of approximately $4m/year for a 1 million bird a week operation.
· There is little relationship between available energy content of grains and intake of diets containing these grains. Thus, both available energy content (MJ/kg) and available energy intake (MJ/day) must be described to fully characterise the energy value of any batch of cereal grain for livestock.
· Individual grain batches are frequently more suited to one livestock type than another because of differences in the modes of digestion between animals. Some grains are best for supplying energy to cattle and sheep than to pigs, while others are best suited for poultry.
· Current measurements used for trading grains for livestock (protein content, test weight (kg/hl) and screenings percent) do not represent well either the available energy content or available energy intake of grains for livestock.
· Near-infrared (NIR) calibrations have been developed to predict the available energy content and available energy intake index (0-100) for cereal grains for some common livestock types.
· These calibrations are soon to be made widely available to the grains and animal industries so the energy value of any batch of grain for different livestock types can be assessed.
· These NIR calibrations can be added to the normal scan of grains for protein and moisture to form a rational basis for trading grains for livestock based on their energy value for different livestock types.
· Grain growers as well as intensive livestock producers must know the energy value of traded feed grains because ‘knowledge is power’. When both the seller and buyer know the value of a batch of grain, a fair price can be negotiated.
Increasing demand for cereal grains by livestock industries
A major proportion of the cereal crop produced in Australia is used by the domestic livestock industries. Although drought has influenced figures in recent years, in 2005 approximately 11.5 million tonnes of cereal grain were used by domestic livestock compared with 1.6 million tonnes for domestic human consumption and 19.1 million tonnes exported. GRDC (2004) also projected that the increase in demand for cereal grains over the coming decades would be considerably greater for the livestock industries than for either domestic human consumption or export. The projected increase in cereal grain use from 2000 to 2020 for domestic human consumption and export was 17% and 20%, respectively, compared with 70% for domestic livestock industries. These figures may change because of the influence of grain use for ethanol production and current world shortage of gain.
These statistics indicate there is a considerable opportunity for grain growers to increase the production of grains for domestic livestock. However, grain quality is extremely important for the intensive livestock industries. These industries are similar to other manufacturing industries where quality of the raw materials can have a marked impact on the efficiency of production, quality of the product and enterprise profitability.
The Premium Grains for Livestock Program
Cereal grains are fed to livestock predominantly as a source of energy because of their high starch content. Traditionally, feed grains have been traded on the basis of their protein content, test weight (kg/ha) and screenings content, often with a great deal of haggling between buyer and seller. However, the capacity of an individual grain sample to provide energy is known to vary widely between and within cereal grain and animal types and not to be closely associated with traditional trading measures. The intensive livestock industries have been concerned about not obtaining sufficient quantities of high quality grains to meet their production schedules. Hence, a large research effort, the Premium Grains for Livestock Program, funded jointly by the grains and animal research and development organisations and Ridley Agriproducts was established in 1996 to define the range and causes for variation in the quality of cereal grains for different livestock types. A major deliverable from the program was to provide the mechanisms for the rational trading of grains for livestock based on an understanding of why grains have different quality for different livestock types and rapid measurement of this quality.
Over 3300 cereal grains (wheat, barley, oats, triticale ad sorghum) with a wide range in chemical and physical characteristics were collected from germplasm archives, plant breeder, farmers and selected because of drought, frost damage or pre-harvest germination. Over 190 grains selected on variation in near infrared spectroscopy scans (NIR) and in vitro (laboratory) fermentation/digestion assays were fed to sheep, cattle, pigs, broilers and layers and 40 grain samples were offered across all animal types. The energy from grains made available following digestion was measured in all animal types and voluntary intake was measured in cattle, pigs, broilers and layers. A comprehensive chemical and physical analysis was conducted on all grains fed to animals.
Definition of the energy value of cereal grains for livestock
The value of a grain as an energy source to an animal depends on the total amount of energy made available for metabolism (MJ/day), which is determined primarily by the energy released during digestion (MJ/kg) and the amount of grain consumed (kg/day). The value of energy released during digestion varies substantially depending on whether digestion is a result of animal secreted enzymes or enzymes of microbial origin. In the latter case, dietary constituents are converted into growing microbes, volatile fatty acids and other compounds with the release of methane, ammonia and heat of fermentation. This microbial fermentation process can result in loss from the animal of 15-20% of the energy in digested material depending on diet composition, conditions of fermentation and species of microbes present.
The energy released during digestion, frequently called the available energy content (MJ/kg), is used commonly in diet formulation for animals. However, the amount of a grain based feed eaten depends largely on factors that influence the rate of passage of digesta through the whole digestive tract. Animal performance is driven by the total intake of available energy (MJ/day), whereas feed conversion efficiency is determined more by available energy content (MJ/kg) of the grain. Available energy is expressed as digestible energy (DE) for pigs, apparent metabolisable energy (AME) for poultry and metabolisable energy (ME) for ruminants.
Variation in the nutritional value of cereal grains
The range in available energy content (MJ/kg DM) following digestion of cereal grains fed to different animal types within the Premium Grains for Livestock Program is presented in Table 1. The range tended to be large (3-4 MJ/kg DM) for pigs and poultry offered wheat, barley, triticale and oats, but less (~1 MJ/kg DM) for sorghum. In contrast, the range in available energy content was lower for ruminants than monogastric animals offered wheat, barley and triticale (~1 MJ/kg DM), but high for oats. The range in available energy content for sorghum was closer to monogastric animals for sheep, but not for cattle, where the range was 3 MJ/kg DM.
The contrast in the available energy content of sorghum across the animal types is illustrated further in Table 2 where digestion of a waxy and non-waxy isoline supplied by the Queensland Department of Primary Industries and Fisheries is compared with a commercial hybrid. The amylose content of starch in the grains was 45, 271 and 297 g/kg, respectively for the waxy, non-waxy and commercial samples. Available energy content of the sorghum samples was greater than 15.5 MJ/kg DM for pigs and poultry and was unaffected by the amylose content of the starch. The available energy content of the sorghum samples was less for sheep (~14 MJ/kg DM) than for the monogastric species and also unaffected by the amylose content of the starch. However, the available energy content of normal sorghum for cattle was extremely low at only approximately 10.5 MJ/kg DM. In contrast to the other animal types, the waxy isoline when fed to cattle, showed an improvement in available energy content of approximately 3 MJ/kg DM.
Table 1: Range obtained in the Premium Grains for Livestock Program for the available energy :content of cereal grains following digestion by different animal types.
|
|
Available energy content (MJ/kg DM)1
|
|
Animal type
|
Wheat
|
Barley2
|
Oats2
|
Triticale
|
Sorghum
|
|
Sheep
|
12.7-13.7
|
11.5-13.9
|
11.2-15.7
|
12.3-13.4
|
13.6-14.3
|
|
Cattle
|
12.2-13.1
|
12.2-13.2
|
10.8-13.4
|
12.9-13.2
|
10.2-13.2
|
|
Pigs
|
12.4-15.0
|
10.6-14.7
|
-
|
12.3-16.5
|
15.5-16.6
|
|
Broilers
|
12.4-15.6
|
11.2-13.7
|
12.6-14.6
|
11.0-14.6
|
15.2-16.5
|
|
Layers
|
13.1-17.1
|
11.0-14.8
|
12.7-16.4
|
11.6-14.4
|
15.5-16.3
|
1ME for ruminants, DE for pigs and AME for poultry.
2Naked grain samples included.
Table 2: Influence of amylose content of starch on the available energy content of sorghum samples for different animal types.
|
Sorghum
|
Available energy content (MJ/kg DM)1
|
|
Grain type
|
Sheep
|
Cattle
|
Pigs
|
Broilers
|
Layers
|
|
Non Waxy
|
14.0
|
10.7
|
16.1
|
16.5
|
15.5
|
|
Waxy
|
13.9
|
13.2
|
16.6
|
16.5
|
15.5
|
|
MR Maxi
|
14.3
|
10.2
|
16.6
|
16.7
|
15.6
|
1ME for ruminants, DE for pigs and AME for poultry.
Figure 1 shows that there is little consistent relationship between the available energy content of grains across animal types when the same grains were fed to cattle, pigs, broilers and layers. There were low and negative correlations in available energy content of grains between the animal types (e.g. broilers-pigs, 0.19; broilers-cattle, -0.28; pigs-cattle, 0.21). There were also low and negative correlations between available energy content (MJ/kg) and available energy intake (MJ/day) within each animal type (e.g. 0.2 for broilers to -0.1 for pigs) indicating that different characteristics of grains determine digestibility and intake. Similarly, there were low and negative correlations in total available energy intake across animal types (e.g. broilers-pigs, -0.15; broilers-cattle, -0.03; pigs-cattle, 012). These low and negative correlations indicate that grains that have high digestibility do not necessarily promote high intakes and that some grains are better than others for providing energy for one animal type and vice versa.
The results from the Premium Grains for Livestock show:
· The energy value of individual grain samples varies widely between and within grain species and animal types.
· Grains with high digestibility do not necessarily promote high intake and levels of production.
· Individual grain samples are often more suitable for one animal type than another.
Figure 1: Available energy content (MJ/kg DM) of individual grain samples fed to different animal types. Circled grains illustrate the range in responses across animal types.
Economic value of variation in grain quality
The economic implications of varying the available energy content of a grain by 1 MJ/kg for the major classes of livestock was estimated using standard least-cost feed formulation techniques assuming typical Australian diets and ingredient prices in 2004 when the price of wheat was approximately $200/t (Table 3). The relative lower cost of 1 MJ/kg for dairy cows was due to the assumed high intake of pasture and forage by these animals.
Table 3: Economic implications for livestock industries of increasing the available energy content of cereal grains by 1 MJ/kg.
|
Industry sector
|
Change in grain value ($/t) for a change of 1MJ/kg
|
|
Pig
|
14.30
|
|
Broiler
|
26.90
|
|
Layer
|
24.07
|
|
Feedlot
|
14.20
|
|
Dairy
|
7.48
|
|
Average
|
17.39
|
The value of increasing the daily intake of available energy (MJ/day) such that it reduces the time taken for broiler chickens to reach market weight by one day has been estimated to save $0.04/bird through lower feed, labour, building costs and reduced mortality. This saving translates to $2.0m/year for a 1 million bird/week operation or $40m/year for the Australian broiler industry.
NIR calibrations for predicting available energy content & energy intake from individual grain samples
Preliminary NIR calibrations have been developed within the Premium Grains for Livestock Program for predicting for individual samples of cereal grains the following:
Ruminant ME (MJ/kg)
Acidosis index (0-100)
Cattle faecal starch content (%)
Broiler AME (MJ/kg)
Broiler AME intake index (0-100)
Pig DE (MJ/kg)
Pig DE intake index (0-100)
Research is currently being conducted by the pig and poultry industries to strengthen these calibrations. Case studies have been conducted to determine the range in energy values for different grains and different livestock types. Figure 2 shows the range in NIR predicted DE for pigs, ME for cattle and acidosis index from individual barley samples collected by ABB Grains in South Australia during 2004 and 2005 harvests.
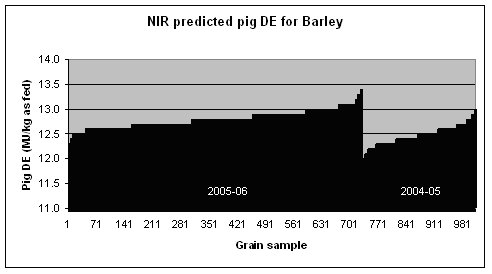
Figure 2: NIR predicted pig DE, ruminant ME and acidosis index for over 1000 samples of barley delivered to ABB Grains in South Australia during 2004-05 and 2005-06.
The graphs confirm that there are some grains that have either high or low energy values with a range of 1.5 MJ/kg for pigs and 1 MJ/kg for ruminants and the acidosis index varying from below 50 to over 90. An important finding was that the 2004-05 year produced grains that had higher energy content and lower acidosis index for ruminants than for 2005-06 grains, whereas the 2004-05 grains were superior on average than the 2005-06 grains for pigs.
A case study conducted with the broiler demonstrated also that a wheat sample selected for high AME and AME intake using the NIR calibrations developed in the Premium Grains for Livestock Program resulted in broilers reaching market weight 2 days earlier than for a wheat sample selected for low AME and 1.5 days earlier than for the standard wheat sample used.
John L Black Consulting
Locked Bag 21, Warrimoo NSW 2774
Phone: 02 4753 6231
Mobile: 0419 493 567
Email: jblack@pnc.com.au