Meeting the cropping system's demand for nitrogen - Can we do it and manage the profit risk?
Author: John Angus | Date: 26 Feb 2013
John Angus
CSIRO Plant Industry Canberra, CSIRO Sustainable Agriculture Flagship and the EH Graham Centre for Agricultural Innovation, Charles Sturt University, Wagga Wagga.
Keywords: nitrogen fertiliser, nitrogen fixation, continuous cropping, pasture phase
Take home messages:
- With continuous cropping, the N-fertiliser application rate on dryland crops in south eastern Australia will need to double in about 4 decades.
- As soil N decreases, more of the fertiliser N should be applied at sowing, preferably using delayed-release methods.
- The real price of N fertiliser is likely to increase.
- Cropping in phased rotation with lucerne-based pastures growing at water-limited potential is likely to be more profitable and stable than continuous cropping.
- Farms containing about 40% lucerne-based pasture will maintain soil N levels.
- To understand soil N (and C!), read Hans Jenny’s 1941 book.
Background
Crops continue to replace ley pastures on dryland farms in south eastern Australia, mimicking, with a delay of several decades, the trend in most other parts of the world. Australian crops are therefore coming to rely more on fertiliser N and less on biologically fixed N from pasture legumes and depletion of soil organic matter. In answer to the question posed for this paper: can we do it? – the answer is yes of course, since cropping systems in other regions do so.
A more important question is should we rely more on fertiliser N. Fertiliser N use for dryland crops in south eastern Australia increased rapidly almost 20 years ago. Most of the increase was as N applied tactically after sowing in response to above-average rainfall, a favourable price ratio of grain:N fertiliser and to a crop with no yield limitations other than N. Further increases in N fertiliser usage will be as strategic application to supply sufficient N for average or even below-average seasons. This paper discusses the consequences and wisdom of continuous cropping with increasing amounts of fertiliser N and compares this with crops grown with phased pastures.
Long-term soil N status under intensive cropping
For any undisturbed soil there is an equilibrium level of soil total N which is reasonably predictable from temperature, rainfall, soil clay content, parent material and natural vegetation. This is described in the classic book by Jenny (1941), which is available online. Under intensive cropping the level of soil total N generally decreases and the rate of decrease depends on the balance of inputs and outputs. When there is no input (apart from the unavoidable fallout of 5-10 kg/ha annually in dust and rain in southern Australia), the level of total N typically decreases at a rate of 2-3% per year in moist temperate regions. A convenient way to express this is as a half-life of total N, which means the number of years for total soil N to reach half the previous value. For example an annual decrease of 2% gives a half-life of 34 years and an annual decrease of 3% gives a half-life of 23 years.
The best information about changes in soil total N status comes from long-term experiments and serial measurements on farms where the duration of cropping is known (Table 1). Based on many studies of soil organic matter changes, the introduction of continuous cropping is expected to lead to an exponential decrease in soil total N to a new and lower equilibrium level. The first four examples in Table 1 are particularly long studies that show the expected exponential decrease, but the other examples show a linear decrease. To present the data simply as a half-life of soil total N, an exponential decrease is assumed for all observations. The first estimate in Australia is from a 27-year half-life from a long-term experiment at the Waite Institute in the mid-twentieth century, when no N fertiliser was applied. This early research also showed that in dry environments the changes in total soil-N were equal to the N removed in crops, but in wetter environments there was more loss of soil N than removal of crop N, probably because of loss of soil N due to denitrification. Extensive surveys of farms in six regions of southern Queensland may be less relevant to southern Australia but the large variation in N half-life in different soils shows we should be careful in generalising.
Table 1. Half-life of total nitrogen in the topsoil (generally 10 cm) in long-term studies.
|
Cropping system |
Years of observation |
Location |
Half-life of soil N (years) |
Reference |
|
Continuous wheat no N fert |
40 |
Waite Institute |
27 |
Clarke & Russell (1976) |
|
Qld fallow-wheat, no N fert |
70 |
Waco |
12 |
Dalal & Mayer (1986) |
|
“ |
50 |
Langlands |
8 |
“ |
|
“ |
35 |
Cecilvale |
2 |
“ |
|
“ |
26 |
Billa Billa |
23 |
“ |
|
“ |
23 |
Thallon |
52 |
“ |
|
“ |
20 |
Riverview |
60 |
“ |
|
Continuous wheat no N fert |
25 |
Wagga Wagga |
18 |
Heenan et al. (2004) |
|
Continuous wheat +50 kg N/ha |
25 |
Wagga Wagga |
22 |
Heenan et al. (2004) |
|
Wheat-broadleaf tactical N |
14 |
Harden |
14 |
Angus et al. (2006) |
Three significant changes in southern Australian farming systems have occurred since the measurements at the Waite Institute and Queensland.
- Crop yield potential increased so N removal is becoming faster.
- Most of the current soil total N originated from the residues of improved pastures growing during the post-war decades and they are probably more labile than the pre-settlement soil N
- Fertiliser N usage increased after the early 1990s and presumably slows the decrease of soil-N.
Two experiments in southern NSW were conducted in modern conditions. One is the SATWAGL experiment at the Wagga Wagga Agricultural Research Institute shows which shows a half-life of total soil N shorter than the original research and also shows that the half-life was extended by only 4 years with commercial rates of N fertiliser. The other is the CSIRO tillage experiment at Harden, set up in 1989, which includes the now-common cropping system of wheat alternating with broadleaf crops, usually canola, and tactical applications of fertiliser N, averaging ~50 kg/ha. Treatments in the experiments compared zero tillage with one-pass tillage and stubble burning with stubble retention. These treatments had little effect on soil total N. The reason that the half-life of soil N at the Harden experiment was shorter than most of the other measurements was probably because of the high initial soil-N level following a long period of pasture.
Table 2 shows the consequences of continuous cropping on the requirement for fertiliser N. The assumptions are that cereals yield 3.5 t/ha with a grain protein content of 11.5% and 75% of the above-ground N in the grain, leading to a annual N requirement is 94 kg/ha. Other assumptions are that half the mineralised N and fertiliser N is taken up by the crop.
Table 2. N mineralisation and fertiliser N requirement (kg/ha) over the next 40 years, assuming (1) constant crop N demand of 94 kg/ha (2) half the mineralised N and half the fertiliser N is taken up by the crop (3) soil total N half-life is 20 years (4) N-mineralisation proportional to soil total N.
|
Year |
N from mineralisation |
Fertiliser-N requirement |
|
2013 |
108 |
80 |
|
2023 |
76 |
112 |
|
2033 |
54 |
134 |
|
2043 |
38 |
150 |
|
2053 |
27 |
161 |
Strategies to increase N-fertiliser application
In farming systems that include pasture phases there is generally sufficient soil mineral N for crop growth up to the stem elongation stage, after which top-dressed N can supply some, or all, of the remaining crop demand. With continuous cropping much of the extra N should be applied at or before sowing. When this leads to large amounts of mineral N content in the topsoil there is a risk of excessive vegetative growth, leading to risks of foliar disease, lodging or haying off. To counter this risk N should be applied in a slow-release form. Polymer-coated granules and urea containing a urease inhibitor may have application in the future, but are expensive. Urea or anhydrous ammonia concentrated in bands beside the seed also provide slow-release mineral N but at lower cost.
Risk
N fertiliser is an inherently risky source of profit for dryland crops and the risks increase as fertiliser provides an increasing proportion of crop N. To minimise risk the first step is to overcome known problems of root disease, weeds and deficiencies of other nutrients. There then remain risks of (1) forecasting rainfall (2) accurately measuring or estimating N status, and (3) forecasting fertiliser price, grain price and protein premium. These risks can be minimised by delaying application until there are reserves of soil water, the seasonal pattern is established, crop N-status is apparent from visual appearance or shoot density and the northern hemisphere crop is nearing harvest, giving some indication of the future price. There is little or no difference in average fertiliser efficiency if N is applied at sowing or at any stage up to early stem elongation. After that, the average yield response decreases and the grain-protein response increases, but in very wet springs the yield and protein response can remain high for N top-dressed up to flowering. There is still a risk that top-dressed N will be stranded on the soil surface in dry conditions or urea will be volatilised on alkaline soils. Alternatives are liquid-N formulations and banding granular urea between the crop rows using high-precision GPS guidance. Liquid-N formulations have been tested but there is no consistent evidence that they are more profitable than urea. Mid-season side-banding has not been widely tested.
Environmental aspects of N
Manufacture of fertiliser N requires a large amount of fossil fuel, at present mostly in the form of natural gas. The real prices of N-fertiliser and natural gas are closely linked and have both fallen in recent decades. The efficiency of manufacturing N-fertiliser has increased during this period and in the largest and newest plants is now approaching the thermodynamic maximum. So efficiency improvements cannot continue for much longer and the cost of manufacturing N fertiliser will not continue to fall. Another factor in the cost of N fertiliser is the availability of natural gas. Supplies and reserves of natural gas have jumped in the past few years with the discovery of coal-seam gas and shale gas, along with efficient methods of extraction. The availability of natural gas feedstock is unlikely to limit N-fertiliser supplies in the near future.
The price of N fertiliser has been closely linked to the price of cereals for many decades and the real prices of both have fallen in lockstep. The ratio of fertiliser N and ASW-APW wheat prices has tended to return to about 6:1 at Australian farm-gates, although there have been up-spikes and down-spikes that briefly make fertiliser more or less profitable.
Other environmental aspects of fertiliser N are (1) possibly degraded structure of soil due to reduced organic matter (2) atmospheric emission of CO2 from the fossil fuel used in fertiliser manufacture, and (3) soil acidification resulting from N-uptake by crops. Soil structural degradation and erosion due to reduced organic matter content could be problems if the soil is cultivated. These problems would be overcome with direct drilling.
The CO2 emissions from fertiliser manufacture may lead to an additional cost through a carbon tax or related cost. Soil acidification is reversed using lime, but this process also involves release of CO2 to the atmosphere, possibly leading to a carbon tax on lime. There is little difference in the effects of N-fertiliser and biologically-fixed N on soil acidification. When these external effects are included, the N fertiliser:grain price ratio will tend to rise and the profitability of N fertiliser to decrease.
Evaluating the contribution of N-fixation by phased pastures
Comparing nitrogen and cash budgets for continuous cropping and phased crop-pasture farms
Many of the long-term experiments discussed earlier showed that introducing pastures into the rotation stabilised the soil total N. In these experiments the pastures mainly consisted of annual species, while lucerne is now more widely grown and is generally more productive than annual legumes. Angus and Peoples (2012) showed that current productivity and biological N-fixation of pastures is far below the biological potential. When lucerne-based pastures and wheat both grew at their water-limited potentials, a farm consisting of 60% crop and 40% pasture maintained a stable amount of soil total N. A smaller proportion of pasture led to declining total soil N (Figure 1).
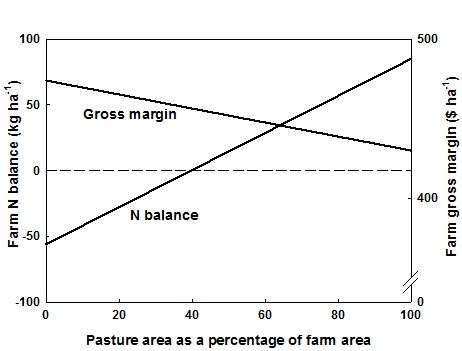
Figure 1. Nitrogen balance and gross margin estimated for farms in southern NSW (Angus and Peoples (2012).
Farm gross margin, based on enterprise gross margins published online by NSW Agriculture, was relatively insensitive to the proportion of crop on the farm.
Angus and Peoples (2012) then compared profitability of the stable N system of 60/40 crop pasture with continuous cropping over the period from 1980-2010 based on a multi-year N budget. For example the estimated mean biological N-fixation at Temora was 87 kg/ha and the between-year variation, expressed as standard deviation, was 56 kg/ha. The profitability was then calculated using historical prices of grain and animal products, production costs published online by NSW Agriculture, and the value of biologically fixed N. Figure 2 shows that the gross margin for a continuously cropped farm was considerably greater than for the 60/40 farm in the early 1980s. However, the gap almost completely closed by 2010, mainly because of increases in the prices of animal products compared to wheat. It is likely that gross margins underestimate the profitability of the mixed pasture-crop system because the method does not take into account of other synergies between pastures and crops, and so phased pasture systems appear to be more profitable than continuous cropping. Minimising the inputs of fertiliser N will provide a comparative advantage over cropping systems with a high dependence on fertiliser N.
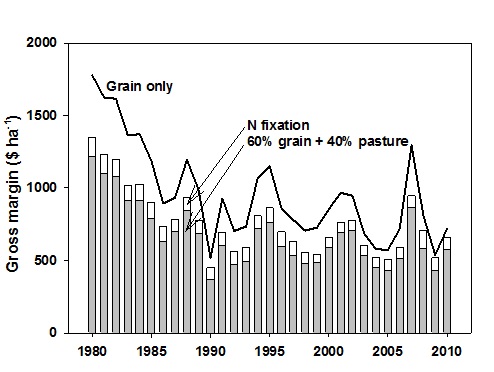
Figure 2. Comparison of gross margins using 2011 variable costs and 1980–2010 prices for grain-only farms (line) and mixed farms on which 60% of the land produces grain and 40% producing pasture (solid bars) and the value of biologically fixed N (open bars). All values are expressed in 2011 dollars using the consumer price index (Angus and Peoples 2012).
Monetary value of biologically fixed N
A simple way to estimate the value of biological N-fixation by pastures is to multiply the amount fixed by the cost of fertiliser. Using the estimated mean rate of N-fixation for Temora, 87kg/ha, by the 2012 price of N fertiliser, $1.4/kg, gives an estimate of $122/ha. This approach ignores factors that underestimate and overestimate the value; the value of the animal production due to the fixed N, the time delay in N becoming available to subsequent crops and the effect of ‘hydrogen fixation’ on the crop growing after a pasture. When these are included, the estimated value is $115±15/ha.
Lessons from 2012
Many crops in eastern Australia were obviously N deficient in 2012 and grain protein levels were generally low except where crops received N fertiliser. There were five unusual circumstances that made it difficult to optimise N fertiliser:
- Excellent subsoil water following rain in March.
- Low soil mineral N where the March rain led to flooding or waterlogging.
- Low grain price at the time of sowing followed by a sudden rise in late June.
- Low winter temperature leading to slow mineralisation and fertiliser-N uptake
- Dry September-October also limiting mineralisation and fertiliser-N uptake
Of these factors, the wet subsoil, the low soil N and the high grain price after July were reasons to apply N, but the low initial prices and the winter and spring weather were not. In retrospect, the best option was to apply the full N requirement at sowing or at least by the end of July. Even so, the visual responses to N applied at sowing were unspectacular and the measured responses of yield and protein to N fertiliser were relatively poor.
Probably the main reason for the generally low N in 2012 was denitrification (conversion of nitrate to N2 and N2O) during the March floods. The microbes responsible for denitrification require anaerobic and warm conditions for rapid activity, which are uncommon in southern Australia, but relatively common in the Darling Downs where a N-loss of 2 kg/ha per day has been measured. Presumably soil mineral N will build up to previous levels in the next few years.
Acknowledgement
Figures 1 and 2 are reproduced with permission of Crop and Pasture Science.
References
Angus JF, Bolger TP, Kirkegaard JA, Peoples MB (2006) Nitrogen mineralisation in relation to previous crops and pastures. Australian Journal of Soil Research 44, 355–365.
Angus JF, Peoples MB (2012) Nitrogen from Australian dryland pastures. Crop and Pasture Science 63, 746–758.
Clarke AL, Russell JS (1977) Crop sequential practices. In ‘Soil factors in crop production in a semi-arid environment’. (Eds JS Russell, EL Greacen) pp. 279–300. (University of Queensland Press: St Lucia)
Dalal RC, Mayer RJ (1986) Long-term trends in fertility of soils under continuous cultivation and cereal cropping in southern Queensland V Rate of loss of total nitrogen from the soil profile and changes in carbon:nitrogen ratios. Australian Journal of Soil Research 24, 493-504.
Heenan DP, Chan KY, Knight PG (2004). Long-term impact of rotation, tillage and stubble management on the loss of soil organic carbon and nitrogen from a Chromic Luvisol. Soil and Tillage Research 76, 59-68.
Jenny, H (1941). Factors in soil formation. McGraw-Hill Book Company, New York (http://www.soilandhealth.org/01aglibrary/010159.Jenny.pdf)
Contact details
John Angus
CSIRO Plant Industry
GPO Box 1600, Canberra, ACT 2601
02 62465095
Was this page helpful?
YOUR FEEDBACK