Should the gravel content of soils impact on your input management decisions
Author: Bill Bowden - West Midlands Group | Date: 07 May 2014
Should the gravel content of soils impact on your input management decisions?
Bill Bowden, West Midlands Group.
Key messages
1. The gravel content of soils (gv%) affects many soil processes which impact on input decision making but it is rarely sampled or estimated correctly.
2. In some situations gv% is used quantitatively where it is not justified and in other circumstances it is ignored where it should be used.
3. More resources and work needs to be put into answering the questions raised in this study.
Aims
To determine whether adjustments need to be made to a range of decision support systems (DSSs) to quantitatively account for the effect of gravel on inputs such as fertilisers, lime, pesticides and herbicides.
Background
This was a desktop study of the role of gv% in decision making systems in WA. An email survey was conducted to see how some of the main players in the fertiliser, lime, pesticide and herbicide advisory systems take account of gravel content. Some of these areas of decision making were then subjected to an analysis of what, in theory, should be done to account for gravel content.
Lateritic gravelly soils (soils with >20% gravel in the surface van Gool priv.com.) make up about 3 million hectares of the 18 million hectares of privately owned land in the agricultural areas of south western WA. They are ubiquitous, and occur at high frequency in the increasingly cropped, high rainfall zone of WA. However, the gv% is not often sampled for or estimated correctly, even though it is used as a quantitative input, for fertiliser and liming decision making.
Gravel or rocks (soil mineral particles > 2mm screen size) occupy soil volume which would otherwise be occupied by the fines fraction. From the point of view of soil processes and root growth, gravel ranges from being completely inert (rock chips) to very active (hard porous mottles). For the simple discussion which follows gravel is considered to be inert.
Soil chemical analyses are only carried out on the fines fraction and are expressed as a concentration (% or as mg/kg). Sometimes these analyses need to be adjusted to quantities per unit area (eg kg/ha) when they are to represent the amounts of available nutrients in the whole soil or in the plant root zone. This adjustment involves multiplying the concentrations by the bulk density and depth of the soil as well as by (1-gv%/100).
One problem in delivering fertiliser input advice is as follows. Compared with a soil with zero gv%, the same soil with 50 gv% would have only half the soil supplies/amount of available nutrients so fertiliser recommendations would need to increase. Compared with a soil with zero gv%, the soil with 50 gv% would have double the concentration of inputs in the soil matrix and the fertiliser recommendations would need to go down! Which direction is correct and how does the logic apply to other inputs?
Results and discussion
An informal email survey requesting the views on the role of gravel in our farming systems was sent to about 50 selected DSS providers, agronomists, specialists and growers. About 30 replied. With some exceptions the general feeling was that gravel and gravelly soils were an important part of our agricultural systems and that a project focused on gravel would raise, if not solve, some issues of importance to growers.
However, the advisers and growers were more interested in what management adjustments might be needed for gravelly soils (and all that correlates with them), than in the quantitative effect of gravel in soils on the recommendations. Answers for such questions will depend on what constitutes a “gravelly soil” in WA from the practitioners’ point of view. Soil scientists have their definitions but how much gravel and where in both the profile and the landscape is it recognisable and significant for growers?
Fertiliser recommendation systems
1. Recommendations from local calibration curves
Most fertiliser recommendation systems in WA rightly rely on locally determined calibration curves. These are experimentally-determined relationships between soil concentrations of nutrients and crop responses to inputs of those nutrients across a range of sites differing in nutrient status. Calibration curves have been developed for the PKS macro nutrients for given crops, and soil types. These correlations already take account of gravel in the soil either through separate calibration curves for gravelly soils, or in the spread of points for more robust correlations for non-differentiated groups of soil (Figure 1.).
Figure1 Phosphorus soil test calibration curves for wheat from the Better Fertiliser Decisions for Crops database (courtesy Geoff Anderson). The 90% yield critical levels are: all - 21 mg/kg, minus gravel – 20, gravel only – 21mg/kg.
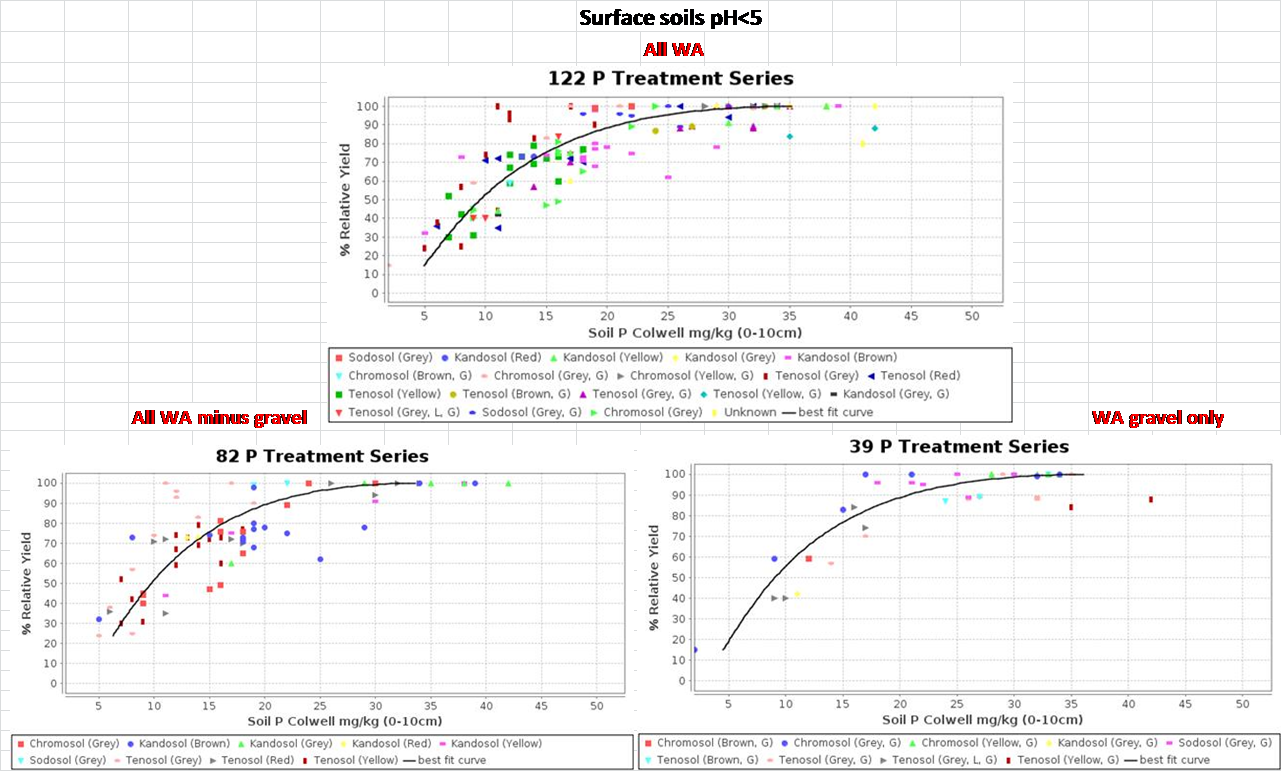
Given the spread of data, separating out the gravel from non-gravel soils makes little difference to the calibrations. Any further, quantitative adjustment for gravel needs to be justified by demonstrable improvements to the accuracy of the calibration curves. To my knowledge, no such work has been done in WA.
However, the main DSS providers for crop and pasture nutrition and liming, currently do adjust laboratory soil tests for gv% and have provided the detail of how they do this. The gravel is usually considered to reduce soil nutrient availability in a linear fashion for whole soil or unit area calculations. That is, the chemical availability of the nutrient in question is reduced by a factor of (1-gv%/100). This is reasonable when crops respond to the amount of nutrients rather than to nutrient concentrations. This question of response to concentration or amount is also relevant to the addition of fertiliser nutrients on gravelly soils. In the presence of gravel you need less nutrient input to change the concentration in the soil fines than if there was no gravel.
The “buffering” of the soil for a given nutrient is a crucial factor in discriminating which of these two propositions holds for which nutrients and in which situations. Buffering relates the amount of an element stored on the soil surfaces to the concentration in solution from which plants take up nutrients. If the buffering capacity is high then the soil can replace the nutrients in solution without a significant reduction in their availability. The plant uptake then depends more on concentration in the soil than on the amount of available nutrients. If the buffering is low then depletion of nutrients leads to deficiency – in this case the plant depends more on the amounts of the available nutrients in the root zone than on the concentration.
For the nutrition of crops in the field, the whole soil buffering capacity needs to be known and this depends on gv% as well as soil bulk density and depth. Soils are discriminated on P buffering capacity (PBI) in recommendation systems used in WA, but gv% is not used to express the PBI on a whole soil basis.
Some DSSs use calibration curves which express the available nutrient supply as an amount in kg/ha. To make the conversion from the mg/kg concentration in the fines requires an estimate of gv%, bulk density (BD) and depth. BD can be assumed with some accuracy (plus/minus15%) whereas gv% cannot and it rarely, if ever, is even estimated, let alone measured and so can introduce much larger errors into the conversion.
2. Recommendations from models
For nitrogen (N), recommendations are not based on soil test calibrations alone because very poor correlations of yield response with soil mineral N are found. These poor correlations are due to the variability in N mineralization pre and post sampling, and to nitrate leaching events which depend on rainfall, soil type, wettability and gv%.
A mechanistic, modelling approach is often used to determine soil N supplies. Currently in WA N recommendation systems determine the supply of available N from rotational sources (kg N/ha) and from the soil organic matter sources (estimated from soil OC% of the matrix). These estimates are combined with laboratory determined mineral N (mg/kg). The total N availability is usually expressed in kg N/ha so these calculations of supply should take account of gv% for estimating the amounts of organic and mineral N in the soil.
Most of these calculation-based, N fertiliser recommendation systems in WA (SYN, NUlogic, N Broadacre) adjust the chemically available nutrient levels measured on the matrix to a whole soil basis by reducing the N availability by the factor (1-gv%)/100. Thus increasing gv% would decrease N supply from the soil and so increase N fertiliser recommendations.
These DSSs also reduce the availability of soil and fertiliser N according to estimates of leaching. Again gv% is assumed to be inert and is used to dilute the water holding capacity of the soil and increase drainage. Whether this is a correct assumption is examined elsewhere.
Other factors affecting nutrition and soil fertility
1. Some WA DSSs for the management of lime take gv% into account, though again how adequately gv% is estimated is open to question. The assumption is that gravel is inert and so liming rates can be reduced directly as gv% increases. The implication is that the gravel reduces the amount of soil which reacts with the lime; the pHBC is reduced by the gravel. This should mean that liming effects should extend deeper and faster on gravelly soils than on the same soil without gravel. On the same principle, the gravelly soils should suffer falling pH values more rapidly for any given acid input
2. Root growth dynamics and architecture are important components of nutrient availability – particularly for the soil immobile nutrients where uptake depends on roots exploring fresh soil.
A small study using the ROOTMAP model was commissioned to see how inserting inert objects (“no go” volumes for roots) into a soil impacted on root length density (RLD) and P uptake. Certainly, RLD and the P uptake from the gravel zone, increased. However, a lot more work needs to be done in this area to determine the effect of inert gravel on nutrient uptake because the results of this study were very specific for the chosen gv% and the nutrient status and distribution. Simple factors like the wetting and drying of soil were not considered. A much larger project with funds to not only go further with the model but also to test (invalidate?) the findings experimentally could be justified.
3. Water availability is a crucial component of nutrient uptake from soils – crops do not take nutrients out of dry soils. Inert gravel obviously reduces the water holding capacity (WHC) of a soil such that it will dry out faster in the surface layers where most of the soil immobile nutrients are stored and where root densities are largest. Thus shorter periods of adequate moisture in the surface layers of high gv% soils would result in less nutrient uptake and a higher fertiliser requirement. If gravel acts as a mulch it can slow evaporation and perhaps keep nutrient-rich surface soils moister for longer and so aid nutrient uptake. This effect would hold early in the season when soil evaporation dominates and particularly in seasons with post-seeding droughts.
4. Soil carbon sequestration calculations should take account of the gv% of soils just as they take account of BD and depth. Carbon trading will be registered in tonnes of carbon or carbon dioxide equivalents and so measured soil OC% values will have to be converted to a whole soil basis. The carbon sequestration literature pays little attention to using gv% in its calculations and even less to how gv% is measured or estimated.
Weed and pest control
None of the pathologists, entomologists or weeds experts in the survey take any specific account of gravel in their pesticide recommendation systems. They do recognize that the ecology of their disciplines can be different on gravel soils but that this is more likely to be related to correlated properties such as the pH and non-wetting of the soil than to gravel per-se. Lip service is paid to the fact that gravel could increase the leaching of soil mobile pesticides to depth with consequences for their effectiveness. The concentrating effects of gravel on herbicide and pesticide sprays and a need for a reduction of rates is denied either because outcomes are very insensitive to rates of application or because the gravel is considered to be active and, as such, holds pesticides such that the concentrations in the matrix do not vary much with gravel content. It was conceded that granular pesticide applications would be concentrated by the presence of gravel.
Conclusions
The gravel content of a soil certainly affects soil physics and chemistry as well as crop growth processes.
In terms of nutrient management, currently increased gv% is assumed to reduce the amount of nutrients available to the crops, but not to concentrating the effect of fertiliser inputs. Adjustments for gv% are made in systems which use soil test calibration curves to produce recommendations when in fact those adjustments are probably not justified. All of the adjustments which are made, lead to higher fertiliser recommendations. Even so, no attempt is made to better sample for or estimate gv%.
Whether it is worth investing further resources to confirm or refute the importance of the questions raised in this study is open to question. The complexity of the effects of gv% in real farming systems is such that there may well be no way to improve the predictive power of the models (both regression and mechanistic) to any great extent.
If resources are found to fund future work then it would be best to start with direct measures of whether gravel is inert or not – particularly with respect to water. Experimental work used in parallel with ROOTMAP model runs to study the effect of gravel on nutrient uptake could also be worthwhile.
Key words
Gravel, fertiliser use, input management, soil testing
Acknowledgments
Thanks to COGGO for funding the work, the West Midlands Group for backing it, to Geoff Anderson for help with access to the BFDC data base and to the many people who replied to the survey with (often) useful comments and suggestions.
Paper reviewed by: Wayne Pluske
Was this page helpful?
YOUR FEEDBACK