Key outcomes arising from the crop sequence project
Author: Mark Peoples, Tony Swan, Laura Goward, James Hunt, (CSIRO Agriculture Flagship), Allison Glover and Ian Trevethan (Riverine Plains Inc), Tony Pratt (FarmLink) | Date: 19 Feb 2015
ɸExtra technical comment by Protech Consulting Pty Ltd
GRDC project code: CSP000146
Take home messages
- Canola and legume break crops were frequently as profitable, and in a number of instances considerably more profitable, than wheat.
- Wheat following break crops was consistently more profitable than wheat on wheat.
- Wheat grain yields were reduced by 450 kg/ha for every 1 t/ha of ryegrass dry matter present in-crop.
- At least two years of weed control may be required to reduce ryegrass seed banks to levels where weed competition does not result in yield reductions in subsequent wheat crops.
- Cheaper, more effective ryegrass control was achieved with a clean fallow and many break crops compared to the best options available for in-crop grass management within wheat.
Introduction
There is a wide-spread perception among growers and their advisers that broadleaf break crops such as canola and legumes are higher risk and/or not as profitable as cereals. The aim of GRDC project CSP000146 was to challenge this notion, and to examine the potential beneficial impacts of break crops on the longer-term financial performance of the following wheat crops.
The present paper presents a selection of key findings generated from experimentation undertaken through participatory research between CSIRO, Riverine Plains and FarmLink in Victoria and NSW that focus on three specific questions:
- Can break crops be as profitable as wheat?
- Are cropping sequences that include break crops more profitable than continuous cereals?
- Can herbicide resistant ryegrass be managed cost effectively under break crops?
Aspects of legume effects on available soil N are covered in another GRDC Update paper (“Legume effects on soil N dynamics - Comparisons of crop response to legume and fertiliser N”), but some N data will also be included here for completeness.
Can break crops be as profitable as wheat?
Experimental site – Yarrawonga South (2012)
(also see year 1 data from Junee Reefs and Eurongilly, NSW described below)
During 2012, a trial was established on the Inchbold family property at Yarrawonga South to address the renewed interest of growers in the Riverine Plains area in growing break crops, and to help identify which break crop might best fit their situation.
Break crops and different end-use options tested
Experimental details: Soil tests were taken at the beginning of 2012 to determine starting soil characteristics. Soil pH (0–10cm) ranged between 5.3–5.9 (CaCl2) across the site and increased with depth. Colwell P (0–10cm) ranged from 9–22 and soil mineral N (0-60cm) was 40–50 kg N/ha.
Treatments included:
- Canola: cv Tawriffic TT, 3 kg/ha sowing rate – for grain.
- Faba bean: cv Rana, 160 kg/ha sowing rate – for grain.
- Chickpea: cv Slasher, 130 kg/ha sowing rate – for grain.
- Field pea: cv Oura, 130 kg/ha sowing rate – for hay or brown manure (BM).
- Vetch: cv Morava, 40 kg/ha sowing rate – for hay or BM.
- Arrowleaf clover: cv. Zulu, 8 kg/ha sowing rate – for hay or BM.
- Sub-clover: cv. Antas, 8 kg/ha sowing rate – for hay or BM.
- Wheat: cv. Young, 90 kg/ha sowing rate – for grain.
All eight species were sown with MAP @ 80 kg/ha in plots 20 m x 1.42 m, and replicated four times in a randomised block design. Sowing was carried out on either 4 May (faba bean, canola, arrow-leaf clover, sub-clover and vetch), or 1 June 2012. Pulses were inoculated with standard peat inoculant and treatments were grown according to best management practice. Both wheat and canola included a nil and plus N fertiliser treatments (180 kg/ha of urea).
The field pea, vetch, arrow-leaf clover and sub-clover treatments were each split in half, with one half brown manured and the other half cut for hay. Only the economics of the hay cut treatment will be presented here. Hay cut yields were calculated at 70% of peak biomass values. The faba bean, chickpea, wheat and canola treatments were harvested for grain at physiological maturity. Weeds such as soursob, ryegrass and marshmallow were an issue in some plots and were removed by hand.
Results
Flooding rainfall proceeded the 2012 growing season, with more than 300mm recorded during late February–early March. This rainfall provided excellent sub-soil moisture at sowing. However, growing season rainfall (GSR – April to October) was 213mm, which was below-average.
Crop yields and gross margins
The arrow-leaf clover and sub-clover hay cuts provided higher gross margins than wheat due to the combination of high DM yields and high hay prices (Table 1). The clover hay treatments have multiple advantages for subsequent crops because they potentially start with higher available soil N, better weed control and higher soil water reserves due to an early termination.
Table 1. Comparisons of grain yield, hay production, income, variable costs and gross margins at Yarrawonga in 2012. Crops arranged in order of descending gross margin.
|
Treatment |
Grain or hay yield (t/ha) |
Gross income ($/ha) |
Total variable costs ($/ha) |
Gross margin ($/ha) |
|---|---|---|---|---|
|
Arrow-leaf clover hay |
4.3 |
1324 |
229 |
1,095 |
|
Sub-clover hay |
4.0 |
1252 |
229 |
1,023 |
|
Wheat + N |
4.8 |
1310 |
323 |
987 |
|
Wheat - N |
4.1 |
1066 |
215 |
851 |
|
Faba bean |
3.0 |
1170 |
347 |
823 |
|
Canola + N |
2.2 |
1206 |
415 |
791 |
|
Canola - N |
1.8 |
965 |
307 |
658 |
|
Vetch hay cut |
3.5 |
815 |
224 |
571 |
|
Chickpea |
1.7 |
799 |
265 |
534 |
|
Field pea hay |
2.8 |
614 |
244 |
371 |
Note: Grain and hay prices used in the calculations were current at the time of harvest. Variable costs were based on local practice and prices. These figures are estimated as a guide only.
Above-average prices were achieved for most grains; in particular wheat, faba bean and canola, which resulted in excellent gross margins for 2012. Wheat yields showed a marked response to additional N with a large difference between the + N fertiliser treatment (4.84 t/ha) and the nil treatment (4.07 t/ha), but there was no substantial difference between canola yields +/- N.
Are cropping sequences that include break crops more profitable than continuous cereals?
Experimental site – Junee Reefs NSW (2011-2013)
The experiment was located in a growers’ paddock at Junee Reefs located 23km north of Junee. Soil pH (CaCl2) in the surface 0-10 cm was 5.50. Soil mineral nitrogen (N) prior to the commencment of the experiment in April 2011 (0-150 cm) was 100 kg N/ha.
Year 1 (2011) – Initial break crop and cereal treatments
Experimental details: The treatments imposed in 2011 were described in considerable detail in the Update papers by Peoples et al (2012) Swan et al (2012) and Swan et al (2013), and can be provided upon request from the authors.
The range of crops sown, their relative risk category and input costs were as follows:
- Canola - low: cv Crusher TT open pollinated variety – for grain; input costs = $181/ha.
- Canola - high: cv Hyola®505 RR Hybrid – for grain; input costs = $334/ha.
- Lentil - medium: cv Flash – for grain; input costs = $172/ha.
- Chickpeas - high: cv Slasher – for grain; input costs = $296/ha.
- Lupins - medium: cv Mandelup - for grain; input costs = $164/ha.
- Lupins BM - low: cv Mandelup - for BM; input costs = $115/ha.
- Field peas BM - low: cv Morgan- for BM; input costs = $104/ha.
- Barley - low: cv Hindmarsh – for grain; input costs = $130/ha.
- Wheat - low: cv Lincoln – for grain; input costs = $117/ha.
- Wheat - high: cv Lincoln – for grain; input costs = $324/ha.
There were two sowing times: late April (canola and lupins) and mid May (lentil, chickpeas, field peas, barley and wheat). Treatments were replicated four times and were sown in a randomized design in 2.5 x 20m plots.
Year 2 (2012) - First wheat after break crops
Experimental details: Each of the replicated plots of all treatments from 2012 were split into 2x10m sub-plots and sown to Spitfire heat in mid-May 2012 under either a low or high input regime.
Low input wheat: target density of 75 plants/m2, seed-dressed and deep-banded starter fertiliser of 25 kg/ha MAP (2.5 kg N/ha), top-dressed with 100 kg/ha urea (46 kg N/ha) at stem elongation. Total input cost including initial knock-down, in-crop herbicides and foliar fungicide was $143/ha.
High input wheat: target density of 150 plants/m2, seed-dressed and deep-banded starter fertiliser of 75 kg/ha MAP (7.5 kg N/ha), top-dressed with 200 kg/ha urea (92 kg N/ha). Total input cost including initial knock-down, in-crop herbicides and foliar fungicide was $379/ha.
Rationale for inclusion of the choice of various inputs in the high input treatment was:
- Higher seeding rates for greater competition with weeds.
- Flutriafol (Impact) for take-all.
- Difenoconazole + metalaxyl-M (Dividend) and zinc seed dressing for Rhizoctonia.
- More starter fertiliser for early vigour for competition with weeds and root diseases.
- Use of new pre-emergent grass herbicide chemistry.
- Use of new post-emergent broadleaf herbicide chemistry to maintain competition.
Year 3 (2013) - Second wheat after break crops
Experimental details: All plots were sown to wheat cv Gauntlet, at a target density of 150 plants/m2; seed dressed with Dividend and fertilised with MAP dressed with Impact Endure banded with the seed at 50 kg/ha (5 kg N/ha). All plots had an initial knockdown of Roundup Attacka plus Goal, pre-emergent herbicides of Logran 750 WG and Avadex Xtra with in-crop pesticides being Velocity, Prosaro and Pirimor WG. The difference in total input costs between the 2013 treatments relates to the amount of urea applied with 200 kg/ha (92 kg N/ha) spread onto the wheat, canola and barley 2011 treatments, 100 kg/ha (46 kg N/ha) onto the chickpea and lentil treatment and 50 kg/ha (23 kg N/ha) applied to the field pea BM and lupin grain treatments. No urea was applied to the lupin BM 2011 treatment. Total input costs for each group of treatments were:
- Wheat, canola, barley = $345/ha.
- Chickpeas and lentils = $280/ha
- Field peaBM and lupin grain = $245/ha
- LupinBM = $215/ha
ɸ a Roundup Attack brand is discontinued
Results
Crop yields and gross margins
Year 1 (2011) – Break crop year
GSR was 216 mm which was considerably lower than the long-term average of 311 mm, but heavy rainfall in February 2011 (226 mm) resulted in an annual total of 639 mm which was approximately 130 mm wetter than the long-term average (506 mm). The soil moisture profile at the beginning of the growing season was full which contributed to respectable grain yields for the various break crops and cereals grown at Junee Reefs (Table 2).
Table 2. Comparisons of grain yield, income, variable costs and gross margins of cereals and various break crops grown for grain or brown manure (BM) in year 1 at Junee Reefs, NSW in 2011. Crops arranged in order of descending gross margin.
|
Crop & input |
Grain yield |
Gross incomea |
Total variable costs ($/ha) |
Gross margin 2011 ($/ha) |
Profit/cost ratio |
|---|---|---|---|---|---|
|
Canola – low |
3.2 |
$1,581 |
$381 |
$1,199 |
3.1 |
|
Canola – high |
3.3 |
$1,604 |
$571 |
$1,033 |
1.8 |
|
Lentils – medium |
3.2 |
$1,165 |
$455 |
$710 |
1.6 |
|
Barley – low |
6.3 |
$945 |
$386 |
$559 |
1.4 |
|
Wheat – high |
5.2 |
$1,056 |
$544 |
$511 |
0.9 |
|
Lupins - medium |
3.5 |
$770 |
$315 |
$455 |
1.4 |
|
Wheat – low |
4.8 |
$744 |
$319 |
$425 |
1.3 |
|
Chickpeas – high |
1.8 |
$792 |
$406 |
$386 |
1.0 |
|
Peas BM – low |
0 |
$0 |
$139 |
-$139 |
-1.0 |
|
Lupins BM – low |
0 |
$0 |
$150 |
-$150 |
-1.0 |
aNote: Grain prices used in the calculations were current at the time of harvest and assumed delivery to Junee except RR canola to Stockinbingal (extra freight cost = $5/t) and lentils to Victoria (extra freight cost = $53/t).
Canola yields were 3.2-3.3 t/ha with an oil content of 46-49%. The N fertiliser applied to wheat (low input = 48 kg N/ha and high input = 100 kg N/ha) had little effect on yield (4.8 cf 5.2 t/ha; respectively), but did have a large impact on grain protein (low input 10.4% and high input 12.5%). Low grain prices received for wheat in 2011 ($155/t for ASW and $203/t for AH2) resulted in canola and lentil being more profitable than both wheat and barley, and lupin to be more profitable than the low input wheat treatment (Table 2).
Gross margins achieved on-farm for wheat in 2011 may have been lower than shown in Table 2 due to downgraded wheat resulting from 150 mm rain throughout November and December 2011. The favourable gross margins received for canola and lentil relative to cereals were reflected in profit : input cost ratios of between 1.6:1 and 3:1 compared to 0.9-1.3 for wheat (Table 2). In other words, $1.60-$3 profit was recieved for every $1 spent when growing these particular break crops, but < $1.30 profit was achieved for every $1 invested on wheat. No income was generated by the brown manure treatments in 2011, although they have the potential to contribute in future years through additional N supply and/or carry-over of residual soil water.
Year 2 (2012) - First wheat after break crops
Despite 115 mm of rainfall in March 2012, residual effects of some of the 2011 treatments on soil water reserves were still measured when wheat was sown in May 2012. The stand out break crop treatments were chickpea and the brown-manured field peas and lupins which had between 40-65 mm more soil water (0-160cm) than where wheat had been grown in 2011 (data not shown). The concentrations of soil mineral N measured in autumn 2012 (0-160cm) were all significantly higher after the 2011 legume treatments (between 119-172 kg N/ha) than following canola or cereals (59-77 kg N/ha).
Despite the 1-2 decile GSR experienced at Junee Reefs in 2012, wheat grain yields following the pulse treatments in 2011 were still significantly higher than after cereals or canola with the low input wheat treatments (Table 3). However, the application of the higher N fertiliser rates in the high input wheat in 2012 following the 2011 pulse treatments resulted in high grain protein contents, high screenings (>5%) and a reduction in grain yield suggesting that the wheat ‘hayed-off’ (Table 3). The gross margins and profit:cost ratios calculated for the low input wheat in 2012 were greater than that achieved by any of the high input wheat treatments reflecting the lower production costs in a dry cropping year (Table 3).
Table 3. Comparisons of grain yields and protein content, income, gross margins and profit/cost ratios for wheat grown with low or high inputs (total variable costs $315/ha and $556/ha respectively) in year 2 at Junee Reefs, NSW in 2012 following wheat, barley or various break crops grown for grain or brown manure (BM) in 2011. Crop 2011 pre-treatments are arranged in order of descending 2012 gross margin.
|
Crop & input in 2011 |
Input 2012 |
Grain yield |
Gross incomea |
Gross margin 2012 |
Profit/cost ratio |
|
|---|---|---|---|---|---|---|
|
(t/ha) (%) |
($/ha) |
($/ha) |
||||
|
Lupins BM |
low |
4.0 (13.6%) |
$1,218 |
$902 |
2.9 |
|
|
Peas BM |
low |
4.1 (12.3%) |
$1,176 |
$861 |
2.7 |
|
|
Chickpeas |
low |
4.0 (12.4%) |
$1,166 |
$851 |
2.7 |
|
|
Lupins |
low |
3.9 (12.4%) |
$1,136 |
$821 |
2.6 |
|
|
Lentils |
low |
4.0 (11.2%) |
$1,079 |
$764 |
2.4 |
|
|
Wheat - high |
low |
3.5 (11.0%) |
$933 |
$617 |
2.0 |
|
|
Canola - high |
low |
3.6 (9.8%) |
$896 |
$581 |
1.8 |
|
|
Canola - low |
low |
3.4 (9.8%) |
$861 |
$545 |
1.7 |
|
|
Wheat - low |
low |
3.4 (9.9%) |
$855 |
$540 |
1.7 |
|
|
Barley |
low |
3.4 (10.3%) |
$852 |
$537 |
1.7 |
|
|
Lentils |
high |
3.8 (12.9%) |
$1,114 |
$558 |
1.0 |
|
|
Wheat – low |
high |
3.8 (11.7%) |
$1,083 |
$527 |
0.9 |
|
|
Canola – high |
high |
3.9 (9.8%) |
$1,054 |
$498 |
0.9 |
|
|
Canola – low |
high |
3.8 (11.3%) |
$1,013 |
$456 |
0.8 |
|
|
Barley |
high |
3.7 (11.0%) |
$1,004 |
$448 |
0.8 |
|
|
Wheat – high |
high |
3.7 (11.2%) |
$998 |
$442 |
0.8 |
|
|
Peas BM |
high |
3.8 (14.1%)* |
$984 |
$428 |
0.8 |
|
|
Chickpeas |
high |
3.7 (13.9%)* |
$971 |
$414 |
0.7 |
|
|
Lupins BM |
high |
3.7 (15.1%)* |
$961 |
$404 |
0.7 |
|
|
Lupins |
high |
3.7 (13.7%)* |
$952 |
$396 |
0.7 |
|
|
LSD (P<0.05) Grain yield Grain % protein |
0.3 (low 2012) & NS (high 2012) 0.8 (low 2012) & 1.3 (high 2012) |
- |
- |
- |
||
Total production costs ranged between $72-$93/t (low input 2012) and $144-$152/t of grain produced.
* Indicates grain screenings > 5% reducing quality.
Year 3 (2013) - Second wheat after break crops
Annual rainfall and GSR at Junee Reefs for 2013 were 432 mm and 289 mm respectively, well below average. In April 2013, all low input 2012 treatments and the lupin BM (2012 high input) treatments were soil sampled to 170cm and analysed for mineral N concentrations which ranged from 151-167 kg N/ha after the lupin and pea BM treatments, 123-151 kg N/ha following the pulses harvested for grain in 2011, and 106-133 kg N/ha after canola and cereals. Fertiliser N requirements were calculated for each low input 2012 treatment to achieve a 5 t/ha grain target yield (rates described in detail above). There were no significant differences in grain yield between treatments in November 2013 with an average wheat yield of 4.46t/ha and protein concentrations ranging from 11.5-12.5% (Table 4). The most limiting factor affecting grain yield in 2013 was soil moisture. The top seven gross margins from 2013 were wheat following either a pulse or canola in 2011, with the top nine profit/cost ratios being pulse crops in 2011. The best profit/cost ratio treatments returned $1.50 to $2.00 for each $1 spent, indicating that in dry years, risk was reduced following a pulse.
Table 4. Comparisons of grain yields and protein content, income and gross margins for wheat grown with high or low inputs in year 3 at Junee Reefs, NSW in 2013 following wheat in 2012, and wheat, barley or various break crops grown for grain or brown manure (BM) in 2011. Crop 2011 pre-treatments are arranged in order of descending 2013 gross margin.
|
Crop & input 2011 |
Input 2012 |
Grain yield (t/ha) |
Grain Protein (%) |
Gross incomea |
Gross margin in 2013 ($/ha) |
Profit/cost ratio in 2013 |
|---|---|---|---|---|---|---|
|
Lupins BM |
high |
4.5 |
11.6% |
$1,238 |
$819 |
2.0 |
|
Lupins BM |
low |
4.5 |
11.8% |
$1,195 |
$780 |
1.9 |
|
Lupins |
high |
4.6 |
11.5% |
$1,216 |
$767 |
1.7 |
|
Pea BM |
high |
4.4 |
12.0% |
$1,203 |
$755 |
1.7 |
|
Lupins |
low |
4.7 |
11.7% |
$1,192 |
$745 |
1.7 |
|
Chickpeas |
high |
4.6 |
12.3% |
$1,224 |
$742 |
1.5 |
|
Pea BM |
low |
4.4 |
11.7% |
$1,186 |
$740 |
1.7 |
|
Lentils |
high |
4.5 |
12.0% |
$1,219 |
$737 |
1.5 |
|
Canola - high |
high |
4.5 |
11.9% |
$1,267 |
$715 |
1.3 |
|
Canola - low |
high |
4.5 |
12.4% |
$1,265 |
$712 |
1.3 |
|
Chickpeas |
low |
4.5 |
12.2% |
$1,186 |
$708 |
1.5 |
|
Canola - high |
low |
4.5 |
11.9% |
$1,240 |
$690 |
1.3 |
|
Canola - low |
low |
4.4 |
12.1% |
$1,240 |
$690 |
1.3 |
|
Wheat - high |
high |
4.4 |
12.4% |
$1,224 |
$676 |
1.2 |
|
Barley |
low |
4.4 |
12.3% |
$1,213 |
$667 |
1.2 |
|
Wheat - low |
high |
4.4 |
12.5% |
$1,205 |
$660 |
1.2 |
|
Wheat - high |
low |
4.4 |
12.3% |
$1,197 |
$653 |
1.2 |
|
Barley |
high |
4.7 |
12.4% |
$1,197 |
$653 |
1.2 |
|
Lentils |
low |
4.6 |
11.7% |
$1,122 |
$651 |
1.4 |
|
Wheat - low |
low |
4.2 |
12.5% |
$1,186 |
$643 |
1.2 |
|
NS |
0.54% |
Cumulative economic analyses of the sequences examined at Junee Reefs (2011-2013)
Calculations across the three years of the experiment indicated that the average annual gross margin fell into three distinct groups (Table 5). The sequences with the highest cumulative gross margins (>$1,940 over three years; average annual gross margins >$640/ha per year) involved break crops in 2011. The gross margin for canola in year 1 had a particularly important impact on the profitability of the sequence. These break crop-wheat sequences generally had higher profit : cost ratios than the second cohort who had cumulative gross margins of $1,540-$1,800/ha (average annual gross margins $513-$600/ha per year) were dominated by cereal-wheat sequences, but also included the lupin and chickpea grain crops 2011 followed by high input wheat. The final group that had cumulative three year gross margins of <$1,540/ha (average annual gross margins <$513/ha per year) were the brown manure (BM) lupin and field pea–wheat sequences (Table 5). High N fertiliser usage on the BM treatments in the dry year of 2012 contributed to the lowest gross margins.
Table 5. Comparisons of annual and cumulative gross margins ($/ha) calculated for different crop sequences from three years of experimental data from Junee Reefs, NSW between 2011 to 2013. Crop sequences are arranged in order of descending cumulative 3 year gross margin.
|
Crop & input
in 2011
|
Input
in 2012
|
Gross margin in 2011a
|
Gross margin in 2012b
|
Gross margin in 2013c
|
Cumulative gross margins over 3 yrs
|
Average profit/cost ratio (3 yrs)
|
|---|---|---|---|---|---|---|
|
|
|
($/ha)
|
($/ha)
|
($/ha)
|
($/ha)
|
|
|
|
|
|
|
|
>$1,940/ha
|
|
|
Canola - low
|
low
|
$1,199
|
$545
|
$690
|
$2,434
|
2.0
|
|
Canola - low
|
high
|
$1,199
|
$456
|
$712
|
$2,367
|
1.6
|
|
Canola - high
|
Low
|
$1,033
|
$581
|
$690
|
$2,304
|
1.6
|
|
Canola - high
|
high
|
$1,033
|
$498
|
$715
|
$2,246
|
1.3
|
|
Lentils
|
low
|
$710
|
$764
|
$651
|
$2,125
|
1.9
|
|
Lupins
|
low
|
$455
|
$821
|
$745
|
$2,021
|
1.6
|
|
Lentils
|
high
|
$710
|
$558
|
$737
|
$2,005
|
1.3
|
|
Chickpeas
|
low
|
$386
|
$851
|
$708
|
$1,945
|
1.7
|
|
|
|
|
|
|
$1,540-$1,800/ha
|
|
|
Wheat - high
|
low
|
$511
|
$617
|
$653
|
$1,781
|
1.3
|
|
Barley
|
low
|
$559
|
$537
|
$667
|
$1,763
|
1.4
|
|
Barley
|
high
|
$559
|
$448
|
$653
|
$1,660
|
1.1
|
|
Wheat - high
|
high
|
$511
|
$442
|
$676
|
$1,629
|
1.0
|
|
Lupins
|
high
|
$455
|
$396
|
$767
|
$1,618
|
1.1
|
|
Wheat - low
|
high
|
$425
|
$527
|
$660
|
$1,612
|
1.2
|
|
Wheat - low
|
low
|
$425
|
$540
|
$643
|
$1,608
|
1.1
|
|
Chickpeas
|
high
|
$386
|
$414
|
$742
|
$1,542
|
1.4
|
|
|
|
|
|
|
<$1,540/ha
|
|
|
Lupins BM
|
low
|
-$150
|
$902
|
$780
|
$1,532
|
1.7
|
|
Pea BM
|
low
|
-$139
|
$861
|
$740
|
$1,462
|
1.6
|
|
Lupins BM
|
high
|
-$150
|
$404
|
$819
|
$1,073
|
1.0
|
|
Pea BM
|
high
|
-$139
|
$428
|
$755
|
$1,044
|
0.9
|
a Derived from Table 2. b Derived from Table 3. c Derived from Table 4.
Can herbicide resistant ryegrass be managed cost effectively under break crops?
There is substantial evidence from surveys of the frequency of herbicide resistance in weeds collected at random from growers’ paddocks in southern NSW, SA and Victoria that have indicated there is wide-spread resistance or partial resistance to a wide range of herbicide groups (up to 70-80% of samples in some areas; Broster et al 2011; Preston et al 2013). One of the most common reasons growers’ give for replacing a cereal with canola or legume is to provide new herbicide options to manage difficult to control weeds. Several studies were initiated in growers’ paddocks in southern NSW in 2012 and 2013 where herbicide resistant ryegrass was known to occur to investigate the efficacy of different break crop strategies and herbicides. Since both experiments have generated similar findings, only detailed data from one of these trials will be presented. However data from both studies will be used to demonstrate the impact of ryegrass on wheat yield .
Experimental site – Eurongilly NSW (2012-2014)
Average annual rainfall at Eurongilly is 556 mm and long-term growing season rainfall (GSR) is 328 mm. GSR in 2012 and 2013 was 179 mm and 274 mm respectively. The soil is a red chromosol (Isbell 1996). The sensitivity / resistance of the annual ryegrass populations at the Eurongilly trial site were tested by Plant Science Consulting SA (Table 6). The result of the analysis indicated that the ryegrass had resistance to Group A herbicides Verdict (Haloxyfop-R), Select (Clethodim) and Axial (Pinoxaden & cloquintocet-mexyl) and Group B herbicides, Hussar (Iodsulfuron-methyl-sodium + Mefenfpyr-diethyl), but suggested that the ryegrass was still susceptible to Group M (Glyphosate) and one Group A herbicide, Factor (Butroxydim).
Table 6. Herbicide resistance assessment of annual ryegrass populations at Eurongilly, NSW (determined in March 2012)
|
Herbicide |
Herbicide group |
Survival (%) Rating |
|---|---|---|
|
Verdict + 1% Hasten 75 A |
Fops |
70 RR |
|
Select + 1% Hasten 300 A |
Dims |
55 R |
|
Axial + 0.5% Adigor 300 A |
Den |
65 RR |
|
Factor + 1% Supercharge 180A |
Dims |
0 S |
|
Hussar + 1% Hastena 200 B Glyphosate 1500 + 0.2% BS1000* |
Sulfonylureas Group M |
95 RRR 0 S* |
Resistance- rating: RRR - indicates plants tested have strong resistance; RR- indicates medium- level resistance; R - indicates low- level but detectable resistance; S - indicates no detection of resistance.
* Ryegrass tested from a 2nd experimental trial site ɸ a Hussar label recommends 0.25% BS1000
Year 1 (2012) – First year of break crops
Experimental details:
Year 1 treatments, input/risk categories and input costs are presented below:
1. Canola – low: cv’s Crusher TT target density of 40 plants/m2, seed dressed with Jockey Stayer and Gaucho, sown with MAP (25 kg/ha), then topdressed with ammonium sulphate (100 kg/ha) and urea (100 kg/ha). Total fertiliser elements as N:P:S (kg/ha) were 69.5, 5.5 and 4.4. Herbicides for ryegrass control included initial knock-down with 450 g/L glyphosate @ 1.6 L/ha; pre-emergent of 480 g/L trifluralin @ 2 L/ha; 900 g/kg atrazine @ 1.1 kg/ha; in-crop herbicide 250 g/kg butroxydim @ 80 g/ha + 900 g/kg atrazine @ 0.9 kg/ha. Total input costs for seed, fertiliser, herbicides and insecticides = $249/ha.
2. Canola – high: cv Hyola®505 RR Hybrid, target density of 40 plants/m2, seed dressed with Jockey Stayer and Gaucho, sown with MAP (75 kg/ha) and Impact Endure, then topdressed with ammonium sulphate (100 kg/ha) and urea (200 kg/ha). Total fertiliser elements as N:P:S (kg/ha) were 120.5, 16.4 and 25.1. Herbicides for ryegrass control included initial knock-down with 450 g/L glyphosate @ 1.6 L/ha; pre-emergent of 480 g/L trifluralin @ 2 L/ha; in-crop herbicide glyphosate (Round-Up Ready) @ 0.9 kg/ha at 2-3 leaf and 6 leaf stages. Total input costs for seed, fertiliser, herbicides and insecticides = $427/ha.
3. Fallow - low: Herbicides for ryegrass control included initial knock-down with 450 g/L glyphosate @ 1.6 L/ha; fallow established in September 2012 with an application of 450 g/L glyphosate @ 2 L/ha + metsulfuron-methyl @ 5 g/ha, then follow-up with 250 g/L paraquat @ 2 L/ha. Total input costs for herbicides = $35/ha.
4. Field peas BM - low: cv’s Morgan for BM, target density of 40 plants/m2, sown with MAP (25 kg/ha). Total fertiliser elements as N:P:S (kg/ha) were 2.5, 5.5 and 0.4. Herbicides for ryegrass control included initial knock-down with 450 g/L glyphosate @ 1.6 L/ha; pre-emergent 480 g/L trifluralin @ 2 L/ha; 900 g/kg simazine @ 1.0 kg/ha; brown manure herbicide 450 g/L glyphosate @ 2 L/ha + 300 g/L clopyralid @ 150 ml/ha + 240 g/L carfentrazone-ethyla @ 25 ml/ha; fallow maintenance 450 g/L glyphosate @ 2.5 L/ha. Total input costs for seed, fertiliser and herbicides = $120/ha. (ɸ a Not registered for this use)
5. Lupins - low: cv Mandelup for grain target density of 40 plants/m2, sown with sown with MAP (25 kg/ha). Total fertiliser elements as N:P:S (kg/ha) were 2.5, 5.5 and 0.4. Herbicides for ryegrass control included initial knock-down with 450 g/L glyphosate @ 1.6 L/ha; pre-emergent 480 g/L trifluralin @ 2L/ha; 900 g/kg simazine @ 2.2 kg/ha; in-crop herbicide 250 g/kg butroxydim @ 180 g/ha; 250 g/L paraquat @ 400 ml/ha. Total input costs for seed, fertiliser & herbicides = $168/ha.
6. Wheat - low: cv’s Spitfire, target density 75 plants/m2, seed dressed with Raxil, sown with MAP (25 kg/ha) then topdressed with urea (100 kg/ha). Total fertiliser elements as N:P:S (kg/ha) were 48.5, 5.5, 0. Herbicides for ryegrass control included initial knock-down with 450 g/L glyphosate @ 1.6 L/ha; pre-emergent 480 g/L trifluralin @ 2 L/ha + diuron 500 g/L @ 1 L/ha; in-crop herbicide 800 g/L prosulfocarb +120 g/L S-metalochlor (Boxer Gold) @ 1.5 L/ha at 2-3 leaf stagea. Total input costs for seed, fertiliser and in-crop herbicides and foliar fungicide = $169/ha.( ɸ aLabel recommends pre-emergent use)
7. Wheat - high: cv’s Spitfire, target density 150 plants/m2, seed dressed with Dividend, sown with MAP (75 kg/ha) and Impact Endure, then topdressed with urea (200 kg/ha). Total fertiliser elements as N:P:S (kg/ha) were 99.5, 16.4, 0. Herbicides for ryegrass control included initial knock-down with 450 g/L glyphosate @ 1.6 L/ha; pre-emergent 850 g/kg pyroxasulfone (Sakura 850WG) @ 118 g/ha + 500 g/L triallate (Avadex Xtra) @ 2 L/ha; in-crop herbicide 800 g/L prosulfocarb +120 g/L S-metalochlor (Boxer Golda) @ 2.5 L/ha + 100 g/L pinoxaden 25 g/L cloquintocet (Axial) @ 150 ml/ha at 2-3 leaf stage. Total input costs for seed, fertiliser, in-crop herbicides and foliar fungicide = $430/ha.( ɸ a Label recommends pre-emergent use; bAxial label recommends 250-350 ml/ha)
There were two sowing times late April (canola and lupins) and mid May (field peas and wheat). The weed-free fallow commenced in early September and peaBM plots were sprayed-out in mid October (2012 and 2013) and re-sprayed within 14 days as a double knock. The lupin treatment was spray topped in mid November 2012 with paraquat. Plots were 40m in length x 2m with each treatment replicated four times.
Year 2 (2013) – Wheat or second break crop
Experimental details: Each of the replicated plots of all the break crop and cereal treatments from 2012 were split into three 13.3 m sub-plots, in a split plot design. Four treatments were sown in early May 2013, with treatments being canola, wheat (high or low input) and wheat (hay). Wheat (high and low input) treatments were sown into all 2012 treatments and canola was sown into pulse, wheat or fallow 2012 treatments only. Wheat (hay) was sown into canola 2012 plots to act as a double break instead of sowing canola 2013 after canola 2012.
Year 2 - Total input costs/ha were outlined as follows, pesticide details can be found in Table 7:
1. Canola (year 2) following pulses (year 1) - cv Hyola®575CL, target density of 40 plants/m2, seed dressed with Jockey Stayer and Gaucho, sown with MAP (75 kg/ha) and Impact Endure, ammonium sulphate (100 kg/ha) spread pre-sowing, then topdressed with urea at stem elongation at 100 kg/ha. Total fertiliser elements as N:P:S (kg/ha) were 74.5, 16.5, 25.1. Total input costs = $352/ha.
2. Canola (year 2) following wheat (high or low) year 1 - cv Hyola®575CL, target density of 40 plants/m2, seed dressed with Jockey Stayer and Gaucho, sown with MAP (75 kg/ha) and Impact Endure, ammonium sulphate spread pre-sowing @ 100 kg/ha, then topdressed with urea at stem elongation at 200 kg/ha. Total fertiliser elements as N:P:S (kg/ha) were 120.5, 16.5, 25.1. Total input costs = $417/ha.
3. Wheat (hay) year 2 following canola (high and low) year 1 - cv Gauntlet, target density 150 plants/m2, seed dressed with Raxil, sown with MAP (25 kg/ha) and urea (40 kg/ha), plus ammonium sulphate spread pre-sowing @ 100 kg/ha. Total N:P:S (kg/ha) were 41.1, 5.5, 24.4. Total input costs = $157/ha.
4. Wheat (low) year 2 following wheat high, field pea BM or fallow year 1 - cv Gauntlet, target density 75 plants/m2, sown with MAP (25 kg/ha) and Impact Endure, plus ammonium sulphate spread pre-sowing @ 100 kg/ha. Total fertiliser elements as N:P:S (kg/ha) were 22.7, 5.5, 24.4. Total input costs = $133/ha.
5. Wheat (low) year 2 following lupin (grain) or canola year 1 - cv Gauntlet, target density 75 plants/m2, sown with MAP (25 kg/ha) and Impact Endure, plus ammonium sulphate spread pre-sowing @ 100 kg/ha, then topdressed with urea at GS30 in Exp 2 only @ 50 kg/ha. Total fertiliser elements as N:P:S (kg/ha) were 22.7, 5.5, 24.4. Total input costs = $133/ha.
6. Wheat (low) year 2 following wheat low year 1 - cv Gauntlet, target density 75 plants/m2, sown with MAP (25 kg/ha) and Impact Endure, plus ammonium sulphate spread pre-sowing @ 100 kg/ha. Total fertiliser elements as N:P:S (kg/ha) were 22.7, 5.5, 24.4. Total input costs = $133/ha.
7. Wheat (high) year 2 following pulses year 1 - cv Gauntlet, target density 150 plants/m2, sown with MAP (75 kg/ha) and Impact Endure, ammonium sulphate spread pre-sowing @ 100 kg/ha then topdressed @ GS 30 with urea @ 100 kg/ha. Total fertiliser as N:P:S (kg/ha) were 73.7, 16.4, 25.1. Total input costs = $412/ha.
8. Wheat (high) year 2 following wheat (high and low) year 1 - cv Gauntlet, target density 150 plants/m2, sown with MAP (75 kg/ha) and Impact Endure, ammonium sulphate spread pre-sowing @ 100 kg/ha then topdressed @ GS 30 with urea @ 200 kg/ha. Total fertiliser elements as N:P:S (kg/ha) were 119.7, 16.5, 25.1. Total input costs = $478/ha.
9. Wheat (high) year 2 following canola (high and low) year 1 - cv Gauntlet, target density 150 plants/m2, sown with MAP (75 kg/ha) and Impact Endure, ammonium sulphate spread pre-sowing @ 100 kg/ha, then topdressed @ GS30 with urea @ 260 kg/ha. Total fertiliser elements as N:P:S (kg/ha) were 147.3, 16.5, 25.1. Total input costs = $517/ha.
Table 7. Pesticides sprayed at sowing and in-crop in year 2 (2013) at Eurongilly, NSW.
|
|
Year 2 pesticides |
Wheat (High) |
Wheat (Low) |
Wheat (HAY) |
Canola (RR) |
|---|---|---|---|---|---|
|
Pre-Em & IBS |
Roundup Attack @ 1.9 L/ha, Goal @ 75 ml/ha, LI700 @ 0.25 % v/v |
Y |
Y |
Y |
Y |
|
Sakura® 850WG @ 118 g/ha + Avadex Xtra @ 2 L/ha |
Y |
|
|
|
|
|
Lorsban @ 900 mL/ha + Fastac Duo @ 200 mL/ha |
|
|
|
Y |
|
|
TriflurX @ 2.0 L/ha |
|
Y |
|
|
|
|
TriflurX @ 2.0 L/ha + 1.5 L/ha Kerb |
|
|
|
Y |
|
|
In-crop herbicides / insecticides |
Boxer Gold @ 2.5 L/ha |
Y |
|
|
|
|
570 g/L MCPA LVE @ 440 mL/ha + Glean @ 20 g/ha + (Lontrel 300/L) @ 300mL/ha + Activator surfactant @ 0.1% |
|
Y |
|
|
|
|
Velocity @ 670 mL/ha + Axial @ 300 mL/ha + Adigor @ 0.5% v/v |
Y |
|
|
|
|
|
Lontrel 300ml/L @ 300 mL/ha + Intervix @ 300 mL/ha + Select @ 500 mL/ha + Le mat @ 100 ml/ha + Supercharge @ 0.5 % |
|
|
|
Y |
|
|
Roundup Attack @ 1.9 L/ha + LI700 @ 0.25 % v/v |
|
|
Y |
|
|
|
Fungicides |
Prosaro @ 300 ml/ha + non-ionic surfactant @ 0.2 % v/v |
Y |
|
|
|
|
Folicur @ 145 ml/ha |
|
Y |
|
|
ɸ a Roundup Attack brand is discontinued, ɸ b Kerb is not registered for use in canola, ɸ c Lontrel is not registered for ryegrass in wheat, ɸ d Velocity is not registered for ryegrass in wheat, ɸ e Intervix is not registered for ryegrass in canola.
Results
Monthly, annual and growing season rainfall is outlined in Table 8. Growing season rainfall (GSR) in 2012, 2013 and 2014 at Eurongilly was 179 mm, 274 mm and 246 mm respectively, compared to the long-term average 328 mm. Annual rainfall (AR) in the three years was 557 mm, 432 mm and 456 mm respectively, compared to the long-term average annual rainfall (AAR) of 556 mm. Although 2012 had a low GSR, 234 mm fell in February and March which resulted in a significant amount of soil moisture in the soil profile pre-sowing compared to 108 mm and 84 mm falling in 2013 and 2104, respectively.
Table 8. Monthly, yearly (annual) and growing season rainfall (GSR) in 2012, 2013 and 2014 at Eurongilly, NSW.
|
Jan |
Feb |
Mar |
Apr |
May |
Jun |
Jul |
Aug |
Sep |
Oct |
Nov |
Dec |
Annual |
GSR |
|
|---|---|---|---|---|---|---|---|---|---|---|---|---|---|---|
|
2012 |
38.4 |
81.4 |
152.8 |
11.0 |
39.6 |
22.6 |
45.2 |
14.8 |
20.8 |
25.4 |
74.0 |
30.6 |
556.7 |
179.4 |
|
2013 |
19.0 |
83.4 |
25.0 |
7.4 |
39.7 |
88.4 |
53.3 |
42.1 |
35.6 |
14.4 |
7.0 |
16.4 |
431.7 |
280.9 |
|
2014 |
16.0 |
20.0 |
63.6 |
52.0 |
32.4 |
66.8 |
20.4 |
18.0 |
33.2 |
24.0 |
30.4 |
78.8 |
455.6 |
246.8 |
The efficacy of the various research herbicide treatments used in the Eurongilly experiment are presented in Table 9. The number of ryegrass panicles measured in late spring were 1,042 per m2 in untreated areas immediately outside the experimental plots, and ranged from 78-504 per m2 under wheat to zero under the RRcanola and bare fallow. No viable ryegrass seed was set in 2012 by the BM treatments. So cheaper, more effective ryegrass control was achieved in the break crops and fallow compared to the best options available for in-crop grass management within wheat.
Table 9. Measures of peak shoot dry matter (DM) accumulation of wheat and various break crops, the cost of ryegrass control measures (April – December 2012), and ryegrass DM and panicle numbers year 1 at Eurongilly, NSW in 2012, Crops arranged in order of descending ryegrass panicle numbers.
|
Crop & input 2012 |
Crop shoot DM |
Costs of grass herbicides |
Ryegrass DM |
Ryegrass panicle number |
|---|---|---|---|---|
|
(t/ha) |
($/ha) |
(t/ha) |
(no./m2) |
|
|
Untreated area |
0 |
$0 |
Not available |
1,042 |
|
Wheat - low |
5.0 |
$56 |
1.6 |
504 |
|
Lentils |
1.4 |
$67 |
0.6 |
215 |
|
Wheat - high |
8.4 |
$142 |
0.3 |
78 |
|
Lupins |
6.5 |
$65 |
0.1 |
43 |
|
Canola - low |
8.3 |
$62 |
0.3a |
32 |
|
Canola - high |
12.0 |
$46 |
0 |
0 |
|
Fallow |
- |
$35 |
0 |
0 |
|
Lupins BM |
1.9 |
$68 |
2.4 |
Killed before seed set |
|
Peas BM |
4.5 |
$66 |
0.7 |
Killed before seed set |
|
LSD (P<0.05) |
1.1 |
- |
0.7 |
147 |
# Two summer sprays of Roundup Attackb @ 1.9L/ha were applied to all treatments, but are not part of these costs (ɸ a Roundup Attack brand is discontinued).
a ryegrass DM estimated based on panicle number using regression of DM = 0.1746+0.0051x (r2 = 0.92).
Crop yields and gross margins
The cool end to the 2012 season and early November rain in the first year of the experiment assisted the canola to yield similar to wheat with both the canola and lupin crops being more profitable than wheat. The BM crop or fallow treatments resulted in negative gross margins in 2012 (Table 10).
The cumulative gross margin over the three cropping years 2012-2014 fell into four distinct categories (Table 10). The sequences with the highest cumualtive gross margins (>$2,000/ha; average annual gross margins >$800/ha per year) involved break crops in 2012, compared to the next cohort dominated by canola in 2013. The third cohort mostly involved fallow or combinations of wheat (high or low), with the final cohort either wheat following pea BM or wheat-low (Table 10). The sequences with the lowest risk and a profit of $2 for each $1 spent (highest profit/cost ratio) were wheat-low following TTcanola-low, lupin-grain crop or fallow.
Table 10. Comparisons of annual gross margins for 2012-2014, 3 year cumulative gross margin ($/ha) and average profit/cost ratio of wheat grown in Year 3 (2014) at Eurongilly, NSW following cereals and various break crops in Years 1-2 (2012-2013). Treatments are arranged in order of descending cumulative 3 yr gross margin.
|
Crop & input in 2012 |
Crop & input in 2013 |
Grain Yield in 2012 (t/ha) |
Gross Margin in 2012 ($/ha) |
Grain Margin in 2013 (t/ha) |
Gross Margin in 2013 ($/ha) |
Wheat Grain Yield in 2014 (t/ha) |
Gross Margin in 2014 ($/ha) |
Cumulative 3 yr gross margin ($/ha/3yrs) |
Average Profit/cost ratio (3 yrs) |
|---|---|---|---|---|---|---|---|---|---|
|
> $2,000/ha |
|||||||||
|
Canola - high |
Wheat - high |
3.5 |
$1,259 |
4.7 |
$533 |
4.5 |
$858 |
$2,650 |
1.4 |
|
Canola - high |
Wheat - low |
3.5 |
$1,259 |
4.7 |
$489 |
4.1 |
$788 |
$2,536 |
1.8 |
|
Canola - low |
Wheat -high |
3.0 |
$1,166 |
4.7 |
$537 |
3.8 |
$828 |
$2,532 |
1.6 |
|
Canola - low |
Wheat - hay |
3.0 |
$1,166 |
8.1DM |
$644 |
3.8 |
$720 |
$2,531 |
1.6 |
|
Canola - high |
Wheat - hay |
3.5 |
$1,259 |
7.4DM |
$533 |
3.7 |
$709 |
$2,501 |
1.4 |
|
Canola - low |
Wheat - low |
3.0 |
$1,166 |
2.8 |
$480 |
3.8 |
$753 |
$2,399 |
2.0 |
|
Lupin - grain |
Canola |
3.1 |
$683 |
3.2 |
$967 |
4.1 |
$721 |
$2,371 |
1.9 |
|
Lupin - grain |
Wheat - high |
3.1 |
$683 |
5.1 |
$726 |
3.9 |
$863 |
$2,272 |
1.7 |
|
Lupin - grain |
Wheat - low |
3.1 |
$683 |
3.5 |
$651 |
3.9 |
$811 |
$2,145 |
2.0 |
|
$1750 - $2000/ha |
|||||||||
|
Wheat - high |
Canola |
3.2 |
$257 |
3.3 |
$964 |
3.1 |
$686 |
$1,908 |
1.2 |
|
Fallow |
Canola |
nil |
-$45 |
3.6 |
$1,159 |
3.7 |
$696 |
$1,810 |
1.8 |
|
Wheat - high |
Wheat -high |
3.2 |
$257 |
5.0 |
$642 |
4.2 |
$855 |
$1,755 |
1.0 |
|
Wheat - low |
Canola |
2.0 |
$250 |
3.0 |
$820 |
4.0 |
$677 |
$1,747 |
1.4 |
|
$1500 - $1750/ha |
|||||||||
|
Fallow |
Wheat - high |
nil |
-$45 |
5.2 |
$761 |
4.5 |
$900 |
$1,616 |
1.5 |
|
Wheat - low |
Wheat - high |
2.0 |
$250 |
4.6 |
$536 |
4.0 |
$824 |
$1,610 |
1.2 |
|
Fallow |
Wheat - low |
nil |
-$45 |
4.2 |
$799 |
3.5 |
$835 |
$1,589 |
2.1 |
|
Wheat - high |
Wheat - low |
3.2 |
$257 |
2.9 |
$510 |
3.7 |
$772 |
$1,539 |
1.2 |
|
Pea BM |
Canola |
nil |
-$160 |
3.3 |
$1,019 |
3.4 |
$679 |
$1,538 |
1.4 |
|
<$1500/ha |
|||||||||
|
Pea BM |
Wheat - high |
nil |
-$160 |
5.0 |
$707 |
4.3 |
$911 |
$1,457 |
1.2 |
|
Pea BM |
Wheat - low |
nil |
-$160 |
3.0 |
$525 |
3.8 |
$826 |
$1,191 |
1.4 |
|
Wheat - low |
Wheat - low |
2.0 |
|
1.5 |
$170 |
3.8 |
$745 |
$1,164 |
1.2 |
*Brackets () indicates grain yield (t/ha grain) and Hay yield (t/ha plant dry matter)
Interaction between crop treatments and ryegrass plant populations
The combined weed data from both experiments were used to examine in-crop competition effects and the efficacy of treatments on ryegrass control. The number of ryegrass panicles (m2) measured in spring year 1 in untreated areas were 1,042, reducing to between 78 and 504 under wheat (high or low) and to zero under canola-high, pea BM or fallow. In year 1, the most effective ryegrass control was achieved from fallow, pea BM or canola - high compared to wheat or TTcanola-low treatments. In year 2, a second break crop of canola-high resulted in the lowest number of ryegrass panicles, and although the wheat-hay treatment had between 577-791 panicles/m2 following canola (high or low), no seed was set. The expensive herbicide costs ($142 & $154/ha) associated with consecutive wheat-high treatments resulted in a significant reduction in ryegrass panicle numbers (42+ panicles/m2). However, if each panicle sets between 30-36 seeds/m2, re-infestation could quickly occur.
Soil cores were removed in March of 2012 (pre-experiment), 2013 and 2014 to measure changes in ryegrass seedbank numbers. Initial ryegrass populations were 1800 plants/m2 . By autumn 2013 there was a three fold increase in ryegrass seedbank populations (5,492 m2) following low input wheat (2012) and a further 2.6 fold increase (14,254 m2) where there was a second low wheat (2013) treatment. Comparitively, seedbank numbers reduced to 166 plant/m2 where canola-high 2012 was followed by wheat-hay (2013), and to 250 plants/m2 where wheat-high, lupin-grain or peasBM were followed by canola in 2013 (data not shown).
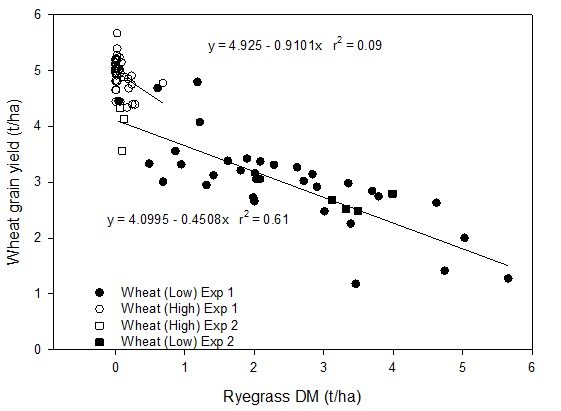
Figure 1. Relationships between ryegrass dry matter (DM) and wheat grain yield following high and low input treatments in wheat in 2013 at two locations in southern NSW.
The effect of the high and low input treatments on ryegrass control and wheat grain yield can be seen in Figure 1. The high input treatment (open symbols) significantly reduced ryegrass DM and increased wheat grain yield. This compares to the increase in ryegrass DM under the low input treatments (closed symbols) resulting in a reduction in wheat grain yield of 450 kg/ha for every 1 t/ha of ryegrass DM (Figure 1).
Conclusions
Results from 11 experiments undertaken in conjunction with the Riverine Plains Inc (reported here), Birchip Cropping Group in the Vic Mallee (same break crops and end-uses repeated across two soil types, established sequentially between 2009-11; data presented by Peoples et al 2013) and FarmLink in southern NSW (four experiments established between 2011-13; data from two studies presented here; results from a 2nd site at Eurongilly and Wagga Wagga can be found in Peoples et al 2013 and Swan et al 2014) demonstrated that canola and legume break crops can frequently be as profitable, and in a number of instances considerably more profitable, than wheat. Canola was consistently the most profitable break crop. However, legumes also provide additional rotational benefits for subsequent crops by increasing soil N supply.
Wheat following break crops was consistently more profitable than wheat on wheat. This in part reflected the relatively low wheat grain prices experienced during experimentation (2011), although sequences with canola were largely profitable due to the high returns from canola itself. Crop sequences involving legumes were found to be profitable either due to their high value (eg lentil) or as a result of increased wheat yields and lower costs of production.
Growing pulses for brown manure (BM) lost money in the year they are grown, but achieved excellent grass weed control, high N inputs, potential residual carry-over of soil water, and provided more ground cover than when grown for hay. Often the wheat crops grown immediately following BM had the highest grain yields and profit, but the increased grain yields were insufficient to fully compensate for the loss of income in the first year. The net result was that cumulative gross margins using BM were the least profitable of any break crop treatment where there was no resistant ryegrass problem. Furthermore, the high available soil N following BM can also increase the risk of haying-off of a following wheat crop in an exceptionally dry year if additional fertiliser N is applied. On the other hand, the BM / wheat-low input sequence provided a lower risk adverse option over dry years.
In paddocks where there is a high background of herbicide-tolerant ryegrass, crop sequences that include a break crop or bare fallow are likely to provide cheaper more effective ryegrass control than is achievable in wheat. It was apparent that there was a requirement for two break crop years to control ryegrass with one of the most profitable options being RRcanola-high followed by a wheat-hay treatment or lupin-grain followed by canola-high. Although RRcanola-high followed by wheat-high had a high gross margin, approximately 20 ryegrass panicles set seed per m2, indicating that this sequence may quickly become reinfested. It is in these situations where growing pulses for BM is most beneficial.
Project findings about specific break crops, different end-use options, and cropping sequences can be summarised as:
- TT-canola > wheat (H) > wheat sequence
- Very profitable if no grass weeds and nitrogen (N) is supplied.
- Not sustainable in the long run
Pulse grain > wheat (H) > wheat - Close behind on $’s even with low pulse prices.
- Results in enhancing available soil N for wheat.
RR-canola > high input wheat > wheat - Most profitable response to a ryegrass weed problem, but
- One year break crop control of ryegrass was found to be insufficient because of high residual seed bank.
Pulse grain (spray topped) > RR-canola, or RR-canola > wheat-hay > wheat - Very effective in terms of gross margins.
- Can provide two years of complete seed set control of ryegrass (but necessary to spray paraquat in grain crops if ryegrass maturing or glyphosate before cutting hay crop and paraquat after to achieve complete grass control in years 1 and 2).
Brown manures not as profitable, but have other benefits not included in gross margins.- Can provide two years of complete seed set control of ryegrass (when used as double break with RR-canola), plus;
- Provide additional nitrogen for subsequent crops (strategic management required for subsequent dry years).
- Improves timeliness of operations on farm
- Reduces risk
- Capital
References
- Broster et al (2011) Herbicide resistance levels in annual ryegrass (Lolium rigidum Gaud.) in southern New South Wales. Plant Protection Quarterly 26, (1) 22-28.
- Isbell (1996) ‘The Australian soil classification.’ (CSIRO Publishing: Melbourne)
- Peoples et al (2012) Doing the numbers: The role and contributions of break crops in cropping systems. Grains Research Update for Advisers 2013: Temora, NSW.
- Preston et al (2013) Maintaining the best options with herbicides. NSW GRDC Grains Research Update for Advisers 2013: Temora, NSW.
- Swan et al (2012) Break crops & brown manures: Effects on nitrogen, grass weeds, grain yield and profit. In: GRDC Grower Update 2013: Ganmain, NSW
- Swan et al (2013) Break crops in cropping systems: Impacts on profit, nitrogen and weeds. In: Grains Research Update for Growers 2014: Wallendbeen, NSW.
Contact details
Mark Peoples and Tony Swan
CSIRO Agriculture Flagship, GPO Box 1600, Canberra
mark.peoples@csiro.au ; tony.swan@csiro.au
GRDC Project Code: CSP000146,
Was this page helpful?
YOUR FEEDBACK