Making better liming decisions
Author: Lisa Miller (Southern Farming Systems) | Date: 18 Mar 2015
Take home messages
- Sampling in 10 cm increments to 30 cm gives a good guide to acidity within the soil profile and will pick up any formation of acidic layers.
- Lime to maintain a good soil pH profile, pHCa above 5.0 in the topsoil or 5.5 when there are subsurface acidity issues and pHCa greater than 4.8 at depths below 10 cm.
- Maintenance liming is needed rather than waiting for soil pH to fall to levels where you get a response because lime takes time to neutralise soil acidity and responses are a reflection of lost production.
- Surface applied lime is not affected by burning stubble but bare paddocks could lead to lime being lost through wind removal.
Background
Soils in most parts of Victoria are generally acidic and are slowly becoming more acidic over time due to weathering and farming practices. Agriculture increases acidification rates and as we continue to increase productivity our soils will start to acidify more quickly. Current rules of thumb of applying one lime tonne/acre every ten years may not be enough to keep pace with our acidification rates.
SFS are working with producers on three soil acidity related projects that are funded by GRDC and supported by the Corangamite Catchment through funding from the Australian Government. They are:
- Soil acidity monitoring within the Corangamite Catchment.
- Trials to measure crop responses to liming in South West Victoria so that simple lime response calculators can be created to help growers make better liming decisions.
- Trials to measure pasture responses to liming and biological amendments within the Corangamite catchment.
These projects will help determine the amount of lime needed in different soil types to remove production constraints, recover soil pH to desirable levels and answer questions such as how long before I need to reapply lime. They will also provide financial information on the costs and returns of maintaining a good soil pH profile from liming.
Acidity: the basics
Soil pH is a measure of how acid or how alkaline the soil is. There are two main pH tests using either solutions of calcium chloride or water. In this paper, pH results presented are using calcium chloride as it removes some of the seasonal variation that can be caused by moisture. Generally pH results from the water test are 0.7 units higher than the calcium test. Even small decreases in pH results are important as they result in large increases in acidity because the pH scale is logarithmic. For example a soil with a pH of 4.5 is 10 times more acidic than a soil with a pH of 5.5 and 100 times more acidic than a soil with a pH of 6.5.
Soil acidity can vary throughout the soil profile and in SW Victoria pH commonly increases as you go down in depth. We normally soil test the 0-10 cm fraction of topsoil which generally goes down to 20 to 25 cm before organic matter declines and the subsoil begins. Deeper soil testing has always been recommended when establishing acid sensitive species such as lucerne because rooting depth is critical for its growth and survival over summer. In this project, soils were tested in 0-10, 10-20 and 20-30 cm increments to find out how acid the topsoils are, if acidity layers are forming and if subsoil acidity is present.
As a minimum, pHCa should be at least 5.0. However, for soils with subsurface acidity issues, a pHCa of at least 5.5 is needed to allow enough lime to treat any acidity occurring below 10 cm. Research has shown that when the topsoil pH is below 5.5 any lime applications or alkalinity deposits from decaying plants is used up neutralising the acidity within the top 10 cm of soil and none is available to move into and treat the subsurface acidity (Gazey et al, 2014). Soil pH for depths below 10 cm should be at least 4.8 to avoid aluminium toxicity issues.
There are many negative effects on plant growth and soil biology, fertility and structure when soils become too acidic. One major effect is when pH falls to 4.8. At this point aluminium starts to become more soluble where it is toxic to plants and restricts their root growth and function. Plant species have different tolerances to soluble aluminium. There are four broad categories of plant tolerance (Highly sensitive, Sensitive, Tolerant and Highly tolerant). Plants highly sensitive to aluminium have their yields effected at low levels of aluminium (approximately Al % CEC > 2%). When pH falls below 4.5, the amount of aluminium increases markedly and even plants tolerant of aluminium will suffer yield reductions or fail to persist.
The aluminium test used in this program reflects the amount of aluminium within the soil solution which roots are exposed to and is expressed as a percentage of cations. When interpreting the results, the electrical conductivity (EC) which is a measure of salts within the soil is needed to accurately predict the effect of aluminium on plant growth.
Methodology
In the soil monitoring project fifteen cores were collected in each paddock across a linear transect of 150 m. Each core was divided into three depths (0-10, 10-20 and 20-30 cm) and bulked together for testing. Tests included basic soil fertility, soil acidity and fractionated carbon but only the 2014 soil acidity results are reported below. Sites included both pasture and cropping, with meat, wool, cropping and dairy enterprises represented.
Eight crop and fourteen pasture lime response trials were established across SW Victoria and in addition SFS took over the long term monitoring of seven lime trials set up by the Woady Yaloak catchment group. Sites were chosen that had very little recent lime history and were likely to be acidic. Trials are a randomised block design with eight to ten treatments replicated four times. Plot sizes were four by 14 m. Six different rates of lime (0, 500, 1250, 1750, 2500, 3750 kg/ha) were applied to develop response curves. A soil fertility treatment was also applied in the crop and pasture sites with and without lime aiming at removing constraints to production. Up to two biological product treatments were also included at the pasture sites.
A further trial site was established on the Bellarine Peninsula to investigate if burning stubble reduced the effectiveness of recently surface applied lime. A randomised block design was used with four treatments including two lime rates (0, 3000 kg/ha) with and without burning which were replicated four times. Plot sizes were four by 14 m. Four metre square cuts were taken in each replicate to estimate stubble loads. Stubble loads were initially calculated to be 9.4 t/ha following a 6 t/ha wheat crop. Lime was applied in mid April and the stubble burnt in mid May due to fire restrictions. By this time, stubble loads had decreased due to early rain and only a cool burn was achieved. The site was sown on 13/6/2014 to Westminister barley. Plant establishment counts were taken six weeks after sowing.
Lime movement at the trial was also studied with regular soil sampling. Four 10 cm cores were taken from each treatment and divided into 2.5 cm increments. Treatments across the four replicates were bulked together and their pH tested.
Results and discussion
Soil monitoring
The findings from the Corangamite soil monitoring program are relevant to Gippsland soils even though there are some differences in soil types. Corangamite catchment soils have an issue with surface soil acidity (0-10 cm), with 59% of the soil samples below the preferred level of 5.0 (Figure 1). Acidity in the topsoil will have implications not only for plant growth and soil biology within it but it will also contribute to the development of subsurface acidity. Research has shown that when the topsoil pH is below 5.5 any lime applications or alkalinity deposits from decaying plants is used up neutralising the acidity within the top 10 cm of soil and none is available to move into and treat the subsurface acidity.
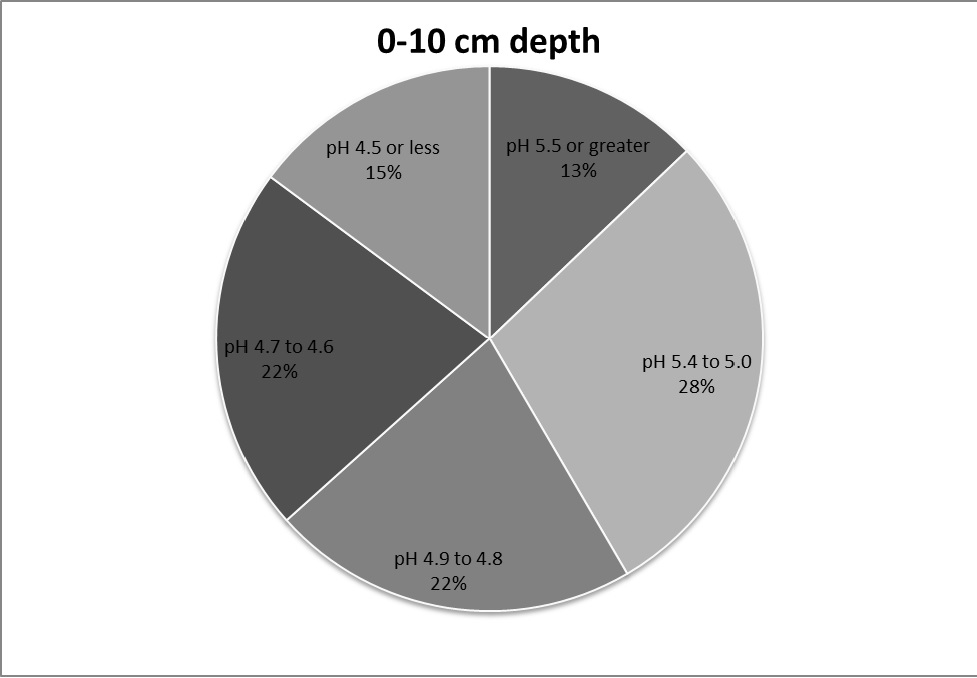
Figure 1. Percentage of sites with different pH ranges within the topsoil (0-10cm) depth.
Given that 90% of topsoil sites had soil pH below 5.5 it’s likely they are too acidic to allow any applied lime to work beyond the 10 cm soil depth and this seemed evident from the soil testing results. Thirty three percent of sites had soil pH lower at the 10-20 cm depth than in their topsoil and strongly acidic layers (10-20 cm) existed in 16% of sites in sedimentary, alluvial and granite soils (Table 1). Further analysis is needed to see how many of these paddocks had been limed. In some cases lime may have been applied recently and had not yet moved deeper into the soil profile. In WA it takes surface applied lime 3-4 years to change pH at depth (Gazey et al, 2014).
Table 1. Percentage of sites where soil pH decreased with depth.
| When the soil pH at: |
Percentage of sites |
Percentage of sites that were ALSO less than pH 4.8 |
|---|---|---|
|
10-20 cm was less than topsoil |
33% |
16% |
|
20-30 cm less than topsoil |
20% |
10% |
|
20-30 cm less than 10-20 cm |
11% |
4% |
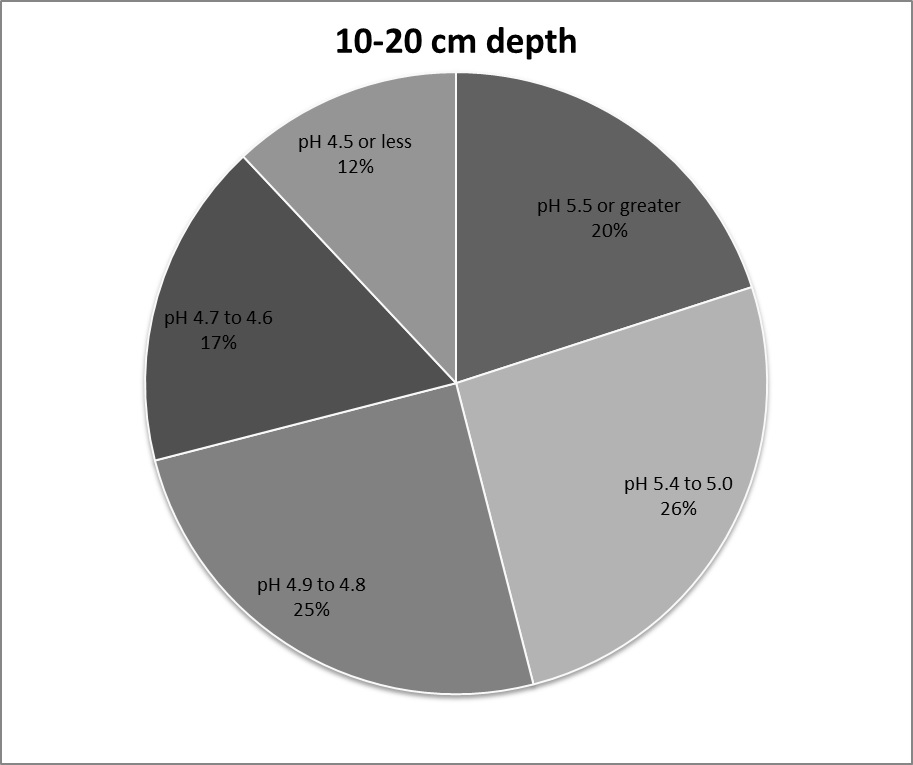
Figure 2. Percentage of sites with different pH ranges within the 10-20 cm depth.
In 17 percent of the paddocks tested soil acidity issues extended into the subsoil (20-30 cm) (Figure 3). Addressing soil acidity at this depth is difficult because surface applied lime takes time to move to this depth and incorporation can cause inadvertent mixing of low quality subsoil with topsoil. The soils found to be acidic at depth were mainly formed on sedimentary, alluvial, granite or marl based soils and located in high rainfall areas (greater than 600 mm). Soils formed on basalt had no issues with acidity at 20-30 cm as they naturally increase in pH with depth due to their high calcium oxide and magnesium oxide content which can neutralise acidity.
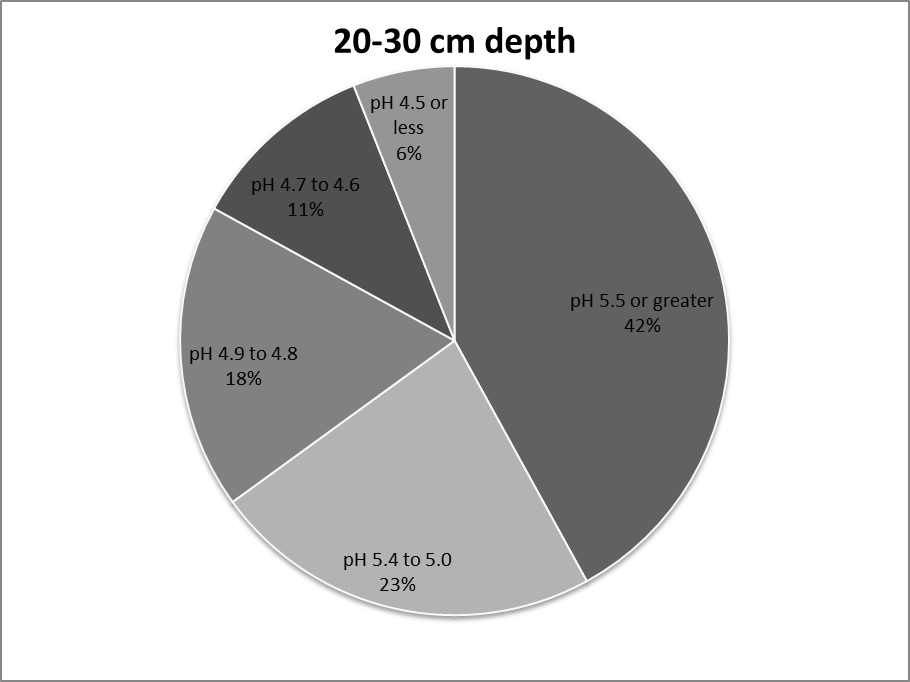
Figure 3. Percentage of sites with different pH ranges within the 20-30cm depth.
Further analysis of deeper cores has been undertaken by DEPI and indicates some soil types and areas have acidity issues extending below 30 cm. The soil types found are roughly coinciding with those mapped in the Australian soil order Kurosols which by definition have subsoil (B horizon) with pHCa below 5.4. Soil maps like the West Gippsland Kurosol map shown in Figure 4 can be found in the catchment management regions of Victorian Resources Online (VRO).
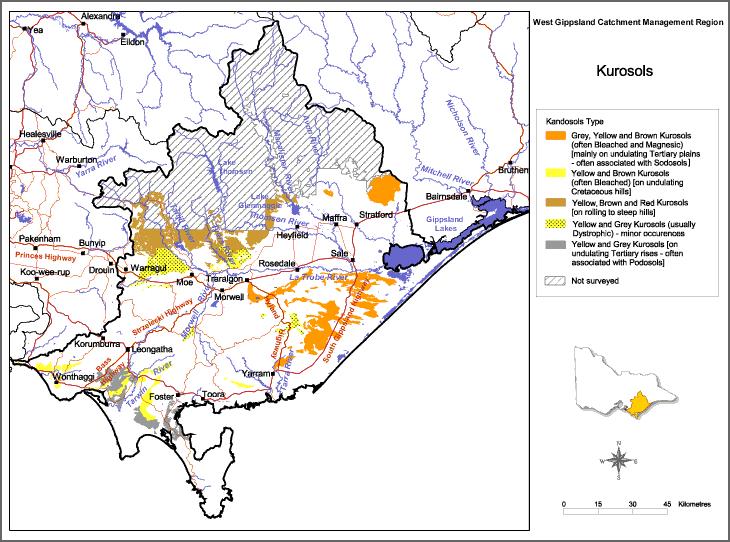
Figure 4. A broad map of the location of Kurosol soils in West Gippsland from Victorian Resources Online.
Soil acidity issues below 10 cm are not well recognised as limited soil testing occurs below 10 cm. Sometimes deeper soil pH testing of 10-30 cm is advised but this may not pick up the formation of acidity layers as a soil layer with higher pH would raise the overall pH of the sample. On soil types with an absence of subsoil acidity (e.g. basalt plains soils), pH monitoring could occur at the 0-10 cm and 10-20 cm depths. On other soils increment testing down to 30 cm is recommended. If the 20-30 cm layer is found to have a pH less than 4.8 then further testing down the profile is needed.
Table 2. Median pH and aluminium results for different soil parent materials across the Corangamite catchment with the highest and lowest recorded values shown in brackets.
| Soil Parent Material |
Tests |
Soil Depth (cm) |
||
|---|---|---|---|---|
| 0-10 |
10-20 | 20-30 |
||
| Basalt, (29 sites) |
pH(Ca) Al % CEC |
5.0 (4.3 - 6.3) 1% (0.1 - 12%) |
5.3 (4.8 – 7.4) 0.2% (0.1 - 8%) |
5.8 (4.9 – 7.6) 0.1% (0.1 – 2.4%) |
| Sedimentary & Alluvial soils (64 sites) |
pH(Ca) Al % CEC |
4.8 (4.1 – 6.1) 2.5% (0.1 - 21%) |
4.8 (4.2 – 6.2) 2% (0.1 - 29%) |
5.0 (4.3 - 6.5) 1% (0.1 - 46%) |
| Marl (5 sites) |
pH(Ca) Al % CEC |
5.0 (4.7 – 5.2) 0.5% (0.4 - 5%) |
4.9 (4.8 – 5.0) 2% (1 - 8) |
4.8 (4.6 – 5.3) 3% (1 - 12%) |
| Granitic soil (1 site) |
pH(Ca) Al % CEC |
4.7 4% |
4.4 19% |
4.9 4% |
| Limestone soil (1 site) |
pH(Ca) Al % CEC |
7.2 <0.1% |
8.4 <0.1% |
8.4 <0.1% |
Crop lime response trials
Lime applications are needed for maintenance of desirable pH levels and to recover soils when pH levels have fallen. Keeping topsoil pH above 5.5 although highly desirable for lime movement may seem economically unfeasible. So what are the responses of different crops to lime application and is yield being forfeited? One of the first steps in answering this question is to look at the lime responses of crops and pastures. In trial work we want to see responses to get a better understanding of the value of liming, but for the grower a lime response it not a measure of success because it means production has been lost to soil acidity. Where there is no response, the lime is not wasted but acting to maintain a good soil pH profile.
Our crop trial results for 2014 showed some lime responses in acid sensitive crops of canola and barley but not wheat and most were not statistically significant (Table 3). Lime was applied in May 2014 and it is not common to see a lime response in the first year of application. Other reasons for not getting a response may be there are other constraints occurring such as sodicity which lime may also address over time.
Table 3. A summary of soil testing and yield results for crop lime response trials for 2014.
| Location |
Crop 2014 |
Depth |
Texture | pH (Ca) | Al% of CEC |
Lime response |
|---|---|---|---|---|---|---|
| Bellarine | Westminister | 0-10 0-20 20-30 |
Loam Clay Loam Clay |
4.2 |
16.6% 10.7% 2.5% |
Lime 3 t/ha increased yield |
| Gatum | Canola | 0-10 0-20 20-30 |
Clay Loam Light Clay Light Clay |
4.4 4.5 5.4 |
12.8% 5.5% 0.1% |
Lime 2.5 t/ha increased yield 21%. NS |
| Hensley Park | Revenue Wheat |
0-10 0-20 20-30 |
Clay Loam Clay Loam Light Clay |
4.4 4.7 5.3 |
7.7% 1.7% 0.5% |
No treatment responses. NS |
| Mingay | Westminister Barley |
0-10 0-20 20-30 |
Clay Loam Light Clay Heavy Clay |
4.8 5.2 5.7 |
1.8% 1.4% 0.1% |
No treatment responses. NS |
| Modewarre | Revenue Wheat |
0-10 0-20 20-30 |
Clay Loam Clay Loam Clay Loam |
4.6 4.6 5.0 |
1.4% 2.3% 0.7% |
No lime responses. NS. |
| Shelford | Canola | 0-10 0-20 20-30 |
Clay Loam Light Clay Clay |
4.9 5.4 6.0 |
0.4% 0.1% 0.1% |
Accidental windrowing of the trial site. No harvest data available. |
| Warncoorte | Wheat | 0-10 0-20 20-30 |
Clay Loam Light Clay Heavy Clay |
4.5 4.6 5.2 |
2.1% 2.4% 0.9% |
Crop cut for hay due to ryegrass. Treatment responses NS. |
| Westmere | Revenue Wheat |
0-10 0-20 20-30 |
Clay Loam Clay Loam Clay |
4.3 4.7 5.5 |
3.9% 5.9% 0.1% |
Lime 1.75 t/ha increased |
| Yulecart | Canola | 0-10 0-20 20-30 |
Clay Loam Clay Loam Light Clay |
4.5 4.5 5.0 |
9.2% 9.3% 0.9% |
Yield response 12% at lime 2.5t/ha vs Nil, NS |
Only the Bellarine peninsula site showed a significant increase in barley yield by 1 t/ha. This site was extremely acid with high aluminium levels and barley is sensitive to aluminium. Lime movement was shown to be very quick, most likely due to the light textured nature of the soil. Lime movement was down approximately 6 cm after 6 months which is very quick but not quick enough to address soil acidity beyond 10 cm by the time of crop harvest. On 20 paddock trials conducted as part of the SGS program by Cam Nicholson, consultant in SW Victoria, soil pH change was detected down to 5 cm after 16 months. The take home message is to get your lime on well before it is needed.
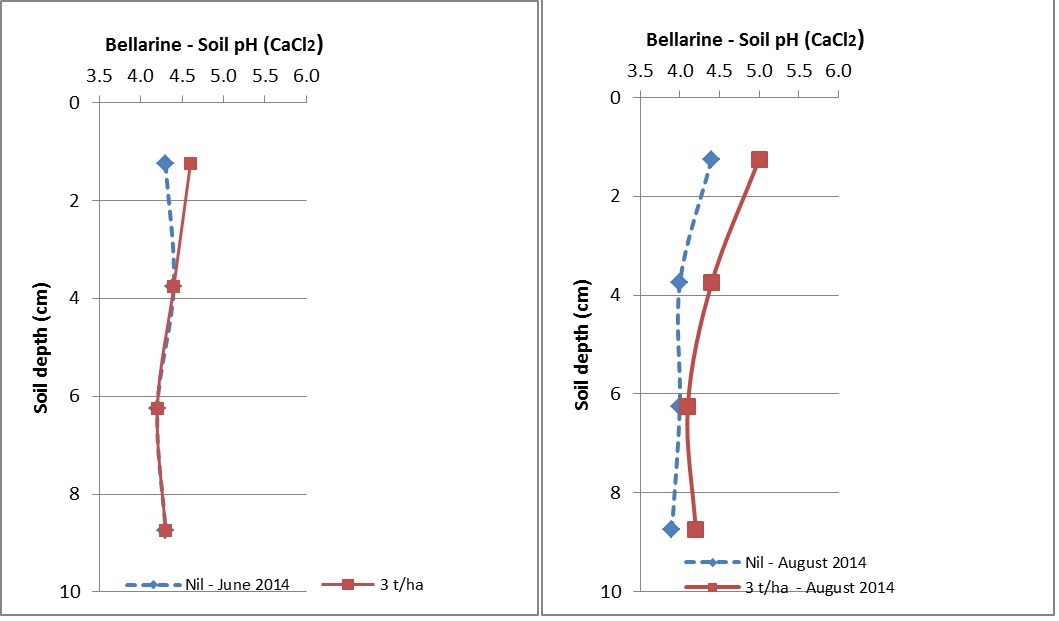
Figure 5. Soil pH change 7 weeks (June) and then four months (August) after lime application in April 2014.
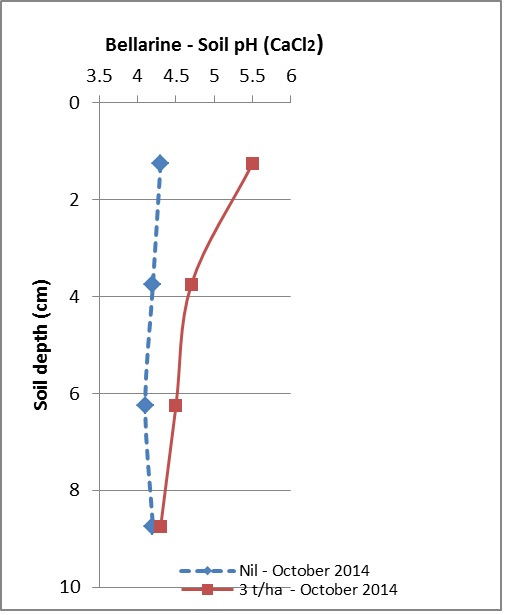
Figure 6. Soil pH change 6 months (October) after lime application in April 2014.
The Woady Yaloak Catchment group have been conducting lime trials near Ballarat where lime was applied in 2012 and so has had longer to work. They have had responses in canola but not in faba beans, which was expected as it is acid sensitive. Soil nitrogen tests will be undertaken to see if there is more nitrogen available from Rhizobia nitrogen fixation under the lime applications. There is currently no soil test data below 10 cm, and therefore, no explanation as to what is happening at depth. It’s surprising that 1.25 t/ha of lime has been getting yield responses in clay loam soils but not at 2.5 t/ha. It’s questioned whether the higher rate of lime could be inducing a trace element deficiency (copper or zinc) which maybe constraining production. This theory will be further investigated.
Table 4. A summary of soil testing and yield results for Woady Yaloak catchment group lime crop response trials, where lime was applied in 2012.
| Location |
Crop |
Texture |
pH (Ca) |
Al% of CEC |
Lime response comments |
|---|---|---|---|---|---|
| Rokewood |
Canola 2012 |
Loam |
4.8 | 3% |
Canola response lime 1.25 t/ha & |
| Rokewood West |
Wheat 2012 |
Clay Loam |
4.8 | 2.4% |
No data collected in 2012. Faba beans |
| Werneth |
Canola 2012 |
Clay Loam |
4.7 | 2.3% |
Canola response lime 1.25t/ha with 8% |
Burning and liming
Our Bellarine trial also investigated whether stubble burning reduces the effectiveness of recently applied lime. Growers were questioning if they could put out lime prior to burning stubble to try to save time in preparation of crop sowing. Although a significant response was found to liming, there was no significant effect of burning on the crop yield. This could have been due to the one month delay between burning and liming or the occurrence of a cool burn. However, the fact is that lime is not affected by burning. At 900oC agricultural lime (CaCO3) is burnt in kilns to create burnt lime (CaO) which makes it faster acting for use in the horticultural industry. Stubble burns might reach 500oC at most. The only danger with burning stubble is leaving paddocks bare where lime might be blown away. Ideally lime would be spread into standing stubble which will help protect it and dews and rainfall will partially dissolve it and move into the soil before burning occurs.
Table 5. Grain yield and grain testing results of Barley at the Bellarine site with different liming and burning treatments.| Treatment | Yield t/ha | Protein % | Test Weight kg/hl | Screening % | ||||
|---|---|---|---|---|---|---|---|---|
| No Lime No Burnt | 2.1 | b | 11.8 | a | 58.7 | a | 1.03 | a |
| Lime No burn | 3.4 | a | 10.8 | a | 59.6 | a | 0.96 | a |
| No Lime, Burn | 2.5 | b | 11.6 | a | 58.5 | a | 1.09 | a |
| Lime Burn | 3.2 | a | 11.2 | a | 58.4 | a | 1.02 | a |
| Mean | 2.78 | 11.4 | 58.8 | 1.03 | ||||
| LSD (P=0.05) | 0.58 | 0.88 | 2.15 | 0.42 | ||||
| CV | 12.87 | 4.86 | 2.25 | 25 | ||||
The other often unrecognised side effect of burning stubble is its liming effect. The ash from burning stubble is alkaline, being partly K2O, CaO and MgO, (equivalent to burnt lime) which will give a rapid increase in the pH of the surface soil. Agronomists and farmers may mistake responses to burning as a potassium deficiency rather than a liming response. Brennan (2003) who studied the effects of ash in cereal crops following burning canola stubble in 33 trials in WA found burnt canola swaths had increased soil pH by 0.3-0.8 of a pHCa unit which might be equivalent to about 1 t/ha of lime. It is therefore recommended to avoid soil testing burnt windrows as this could inadvertently result in soil pH of paddocks being overestimated.
Pasture lime response trials
In the pasture trials there were only two notable increases in yield and only Murroon was statistically significant. Most lime responses in previous pasture trials have been picked up in autumn and winter rather than in spring. At pasture sites, the initial response might be from an increase in molybdenum which may lead to an increase in nitrogen availability rather than from a reduction in aluminium toxicity.
Lime at very high applications of 3.75 t/ha is not a rate that is generally recommended. Generally higher rates work more quickly at neutralising acid because there is a higher surface area of lime available. However, high lime rates have been thought to initially suppress pasture growth by perhaps affecting soil biology, however there is little evidence to support it.
The soil testing results are shown for producers to get an idea of the variation in pH with depth. The site at Simpson is particularly interesting not only for its extreme acidity but because the paddock is supposedly limed every three years with 2.5 t/ha of lime.
Table 6. A summary of soil testing and yield results for pasture lime response trials for 2014.|
Location |
Pasture Type |
Depth (cm) |
Texture |
pH (Ca) |
Al% of CEC |
Lime Response |
|---|---|---|---|---|---|---|
|
Ballan |
Cocksfoot, Fescue, Subclover mix |
0-10 10-20 20-30 |
Clay Loam Clay Loam Light Clay |
4.7 5.1 4.8 |
2.9 0.8 1.6 |
No treatment response NS, Lime applied in August 2014 |
|
Bambra |
Perennial ryegrass |
0-10 10-20 20-30 |
Loam Loam Clay Loam |
4.5 4.5 4.6 |
7.8 20.3 18.8 |
Lime yield response 15% at lime 2.5t/ha vs Nil, NS Poultry litter yield response 18% vs Nil, NS |
|
Bamganie |
Australian phalaris, subclover |
0-10 10-20 20-30 |
Clay Loam Clay Loam Light Clay |
4.7 4.5 4.6 |
3.6 8.5 9.8 |
No lime response Poultry litter 21% yield response in Sept vs Nil. NS Pig effluent 50%, Sig. P=0.0207, CSV 13.72. |
|
Freshwater Ck |
Phalaris, subclover |
0-10 10-20 20-30 |
Loam Loam Clay Loam |
5.0 4.9 5.0 |
0.6 1.5 0.6 |
No Lime Response. NS. Poultry litter 18% yield response in Sept vs Nil, Sig. P=0.048, CSV 7.85. |
|
Gnarpurt |
Fletcher fescue |
0-10 10-20 20-30 |
Clay Loam Clay Loam Clay |
4.9 5.1 5.5 |
1.0 0.5 0.1 |
Treatments only applied in late August, 2014 |
|
Mandibar |
Annual grasses, Perennial ryegrass, subclover |
0-10 10-20 20-30 |
Clay Loam Clay Loam Heavy Clay |
5.2 5.0 6.0 |
0.7 1.7 0.1 |
Poultry litter 24% yield response vs Nil in August, Sig. P=0.0001, CSV 5.08 |
|
Moriac |
Lime applied 2012, monitoring starts 2015 |
0-10 10-20 20-30 |
Loam Clay Loam Light Clay |
4.4 4.7 5.3 |
5.6 4.8 0.1 |
No harvest data available for 2014 |
|
Murroon |
Avalon perennial ryegrass, subclover |
0-10 10-20 20-30 |
Loam Clay Loam Light Clay |
4.7 4.6 4.7 |
3.0 7.5 10.8 |
Lime 3.75t/ha in Sept yield response 20% (P=0.0195, CSV 16.5), & Nov 12% yield response vs Nil, Sig. P=0.029, CSV 7.75. Potash response 60% -26% Sep & Nov vs Nil, Sig. |
|
Rokewood |
Fraydo Tall fescue, Holdfast phalaris, subclover |
0-10 10-20 20-30 |
Clay Loam Clay Loam Clay |
4.6 5.0 5.9 |
5.6 1.1 0.1 |
No treatment response NS |
|
Simpson |
Dairy pasture, Short term ryegrass/no clover. |
0-10 10-20 20-30 |
Sandy loam Not tested Not tested |
4.5 4.2 4.0 |
2.4 30.7 56.5 |
Treatments only applied in November 2014 |
|
Stonyford |
Demeter fescue, ryegrass, subclover |
0-10 10-20 20-30 |
Clay Loam Clay Clay |
5.3 5.7 5.9 |
0.1 0.1 0.1 |
No treatment responses NS. |
|
Timboon West |
Perennial ryegrass, subclover |
0-10 10-20 20-30 |
Loam Clay Loam Clay |
4.9 4.8 5.0 |
3.5 4.2 0.5 |
Treatments only applied in August 2014 |
|
Weerite |
Perennial ryegrass, subclover |
0-10 10-20 20-30 |
Clay Loam Light Clay Clay |
4.5 4.6 4.7 |
2.4 2.3 1.9 |
Treatments only applied in August 2014 |
|
Wingeel |
Australian phalaris |
0-10 10-20 20-30 |
Clay Loam Light Clay Heavy Clay |
4.9 5.2 5.8 |
1.0 0.06 0.1 |
No treatment responses NS. |
Conclusion
Our soil monitoring project is helping us understand the importance of pH testing beyond 10 cm to pick up the formation of acidity layers and subsoil acidity so we can make more informed liming decisions. It also highlighted the need for having soil pH targets above 5.5 where there are issues with subsurface acidity. Our trials are showing us that we are probably only going to see lime responses in the first year when acid sensitive crops are grown on strongly acidic soils. However, growers should focus on maintaining a good pH soil profile so that production is not forfeited. When growers are forced to reduce stubble loads by burning, they can be assured that spreading lime first won’t mean it will go up in smoke (nor will gypsum – everyone always asks!) but they need to be wary that it still could be lost through wind removal when paddocks are left bare.
References
Brennan RF, Bolland, MDA and Bowden, JW (2003). Post canola syndrome: burning swathed canola stubbles enables potassium deficiency and induced molybdenum deficiency and aluminium toxicity to be expressed in the next cereal crop. In "Thirteenth Biennial Australian Research Assembly on Brassicas" (J Edwards, ed.), pp. 32-39. NSW Agriculture, Orange Australia.
Gazey C, Davies S and Master R. (2014) Soil Acidity A guide for WA farmers and consultants 2ed. Bulletin 4858, Department of Agriculture and Food, Western Australia.
Contact details
Lisa Miller
Southern Farming Systems
23 High Street, Inverleigh, Vic. 3321
0488 600 226
lmiller@sfs.org.au
GRDC Project Code: SFS00026,
Was this page helpful?
YOUR FEEDBACK