Drought tolerance fo wheat varieties
Author: Glenn McDonald, DAFWA | Date: 29 Feb 2016
Glenn McDonald, Rebecca O’Leary, Department of Agriculture and Food, Western Australia
Key messages
Drought tolerance of wheat cultivars can be assessed by comparing rainfed and supplemental irrigation treatments.
There is diversity in the drought tolerance of commercial wheat cultivars.
Expression of drought tolerance varies with the season.
Wheat breeders and growers can use this information to assist in making decisions about cultivar selection.
Aims
To assess variability of terminal drought tolerance in advanced breeding lines and commercial cultivars.
Background
Genetic improvement of crops through conventional breeding has provided major advances in crop productivity and quality. Reliable selection for genetic improvement of wheat will be essential to sustaining the future of the grains industry. Past drought research within Australia has often been fragmented, with research groups focusing on different mechanisms, varieties and types of drought. A main limitation to breeders developing improved drought tolerant varieties is the knowledge on how the current Australian commercial varieties compare to novel sources of drought tolerance, how to select for drought tolerance and which mechanisms of drought tolerance to select for different production areas. This research was designed to provide plant breeders with the ability to compare their genetic material for drought tolerance and benchmark it against commercial cultivars and material previously identified as drought tolerant.
Method
This project used the GRDC funded Managed Environment Facilities (MEF’s) at Merredin, Narrabri and Yanco to test experimental methodology and identify plant traits that may predict drought tolerance in commercial wheat cultivars and advanced breeding lines. Trials were conducted during 2011-2014 seasons and different ‘managed environments’ were created through supplementary irrigation via overhead boom in addition to naturally occurring rainfall during the flowering and post flowering period. These different treatments are subsequently referred to as ‘Irrigated’ and ‘Rainfed’ treatments, respectively.
Up to 250 entries were sown in partially replicated (2011-2013) and replicated (2014) small plot trials at the three sites in each season. Irrigation schedules were managed through the use of the StressMaster model (Chenu et al, 2013a; Chenu et al 2013b) via an internet webpage interface for APSIM which predicts yields based on rainfall to date and the probability of different rainfall patterns for the remainder of the growing season.
Both the Rainfed and Irrigated treatments were periodically watered as required to ensure even crop establishment and environmental consistency until treatment differences were implemented. Irrigation equal to approximately 60mm extra rainfall in each season was applied to the Irrigated treatment compared to the Rainfed treatment.
The different environmental conditions observed, and the range of yields for all cultivars tested at the Merredin, Yanco and Narrabri sites, makes data analysis complicated. This paper, therefore, focusses on the yield results for selected commercial cultivars evaluated at the Merredin MEF for drought tolerance.
Results
Irrigation and season effects
Much of the difference in the results obtained can be explained by comparing the rainfall patterns during the post sowing period and the amount and timing of applied irrigation (Figure 1). Horizontal lines in Figure 1 indicate no additional rain or irrigation and therefore a drying soil profile. During peak growth periods and warmer days in September and October, soil drying occurs at a faster rate. If there is no rain or irrigation for an extended period, the crop suffers from moisture stress and becomes drought affected. This drought effect can be seen during September to October in 2012 and 2014 seasons for at least four continuous weeks during flowering and early grain filling. This resulted in lower yields compared to the other two seasons (Figure 2). During the 2013 season the rainfall pattern followed the expected soil moisture demand for the growing crop, except for a two week period in August where no effective rain was recorded. At this time irrigation was not applied and the desired environmental difference between the Rainfed and Irrigated treatments wasn’t produced. The subsequent rainfall in September enhanced the yield potential of both treatments, leading to smaller yield differentiation between the two treatments than for the other seasons. The 2011 and 2014 seasons were almost the perfect experimental years as there was adequate natural rainfall during the vegetative stages of plant growth. After which low rainfall caused drought conditions at the end of August for 2011 and the start of August for 2014, which were alleviated in the Irrigation treatment until mid-October and mid-September for 2011 and 2014 seasons respectively. This difference in starting time of the drought effect of the Rainfed treatments accounts for much of the yield difference between these two seasons.
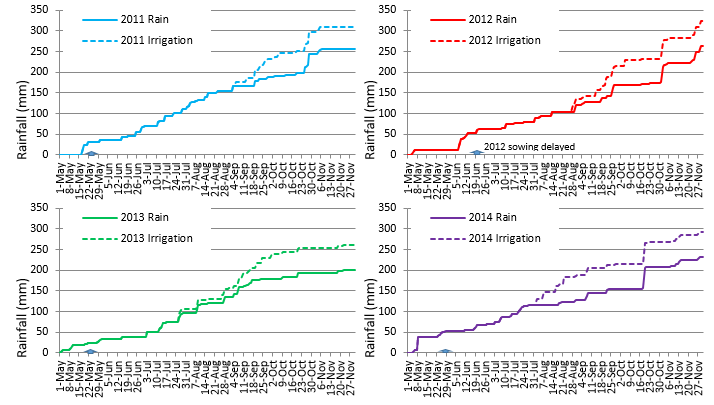
Figure 1. Cumulative May-October rainfall with and without irrigation during May-October at Merredin during 2011 to 2014 growing seasons. Blue arrows indicate sowing dates with all years sown 20-26 May, except 2012 which was sown 19 June.
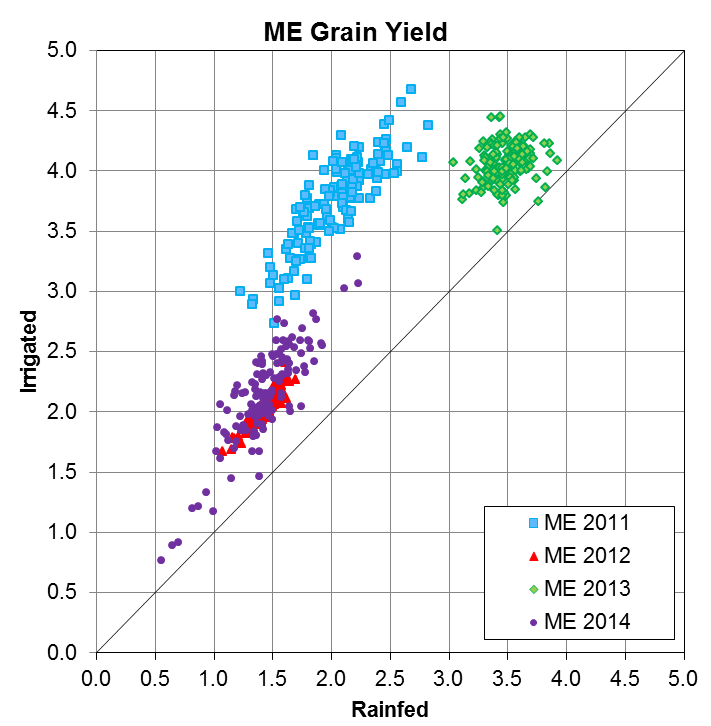
Figure 2. Evaluation of advanced breeding lines and commercial cultivars for grain yield (t/ha) using Rainfed and Irrigated treatments at Merredin (ME) during the 2011-2014 seasons.
In order to obtain an understanding of the diversity in drought tolerance for the breeding lines and commercial cultivars evaluated, a dispersed plot of yield points is desirable, as for 2011 and 2014 seasons (Figure 2). The 2012 results were less dispersed presumably due to the later sowing and insufficient watering of the ‘Irrigation’ treatment during July and early August in that season (compare with 2014 in Figure 1). This was exacerbated by no irrigation being applied after the first week in October during early grain filling.
In addition to the dispersed yield points as just described, a range of yield potentials is desired for each treatment to obtain good differentiation in drought tolerance between cultivars. Unfortunately this did not occur in 2013, the highest yielding season in our experiment. To generate variety specific differences between the treatments in 2013, a much larger and timely application of irrigation was required in mid-August to maintain the yield advantage of the Irrigated treatment over the Rainfed treatment.
Regardless of these seasonal effects, all four experimental seasons provided useful drought tolerance results and were used to calculate a measure of drought tolerance.
Calculating the Drought Index (DI)
With the range in yield potentials and seasonal rainfall from year to year, a standardised method of assessing the drought tolerance is needed. The rainfed and irrigated yields for all cultivars were analysed using a bivariate mixed model and the Best Linear Unbiased Predictions (BLUPs) were calculated. A linear regression of rainfed BLUPs on irrigated BLUPs was calculated (Lemerle et al 2006) and a Drought index (DI) was estimated as the vertical deviation of each point from this regression line. A typical example of a linear regression and DI all the entries in a season at Merredin is shown in Figure 3.
A cultivar with a positive DI (above regression line) was considered more tolerant to drought than a cultivar having a negative DI (below regression line). This DI value is independent to the yield potential of the cultivar but could be influenced by factors such as flowering time and tolerance to subsoil constraints, which could influence performance under irrigated or rainfed conditions.
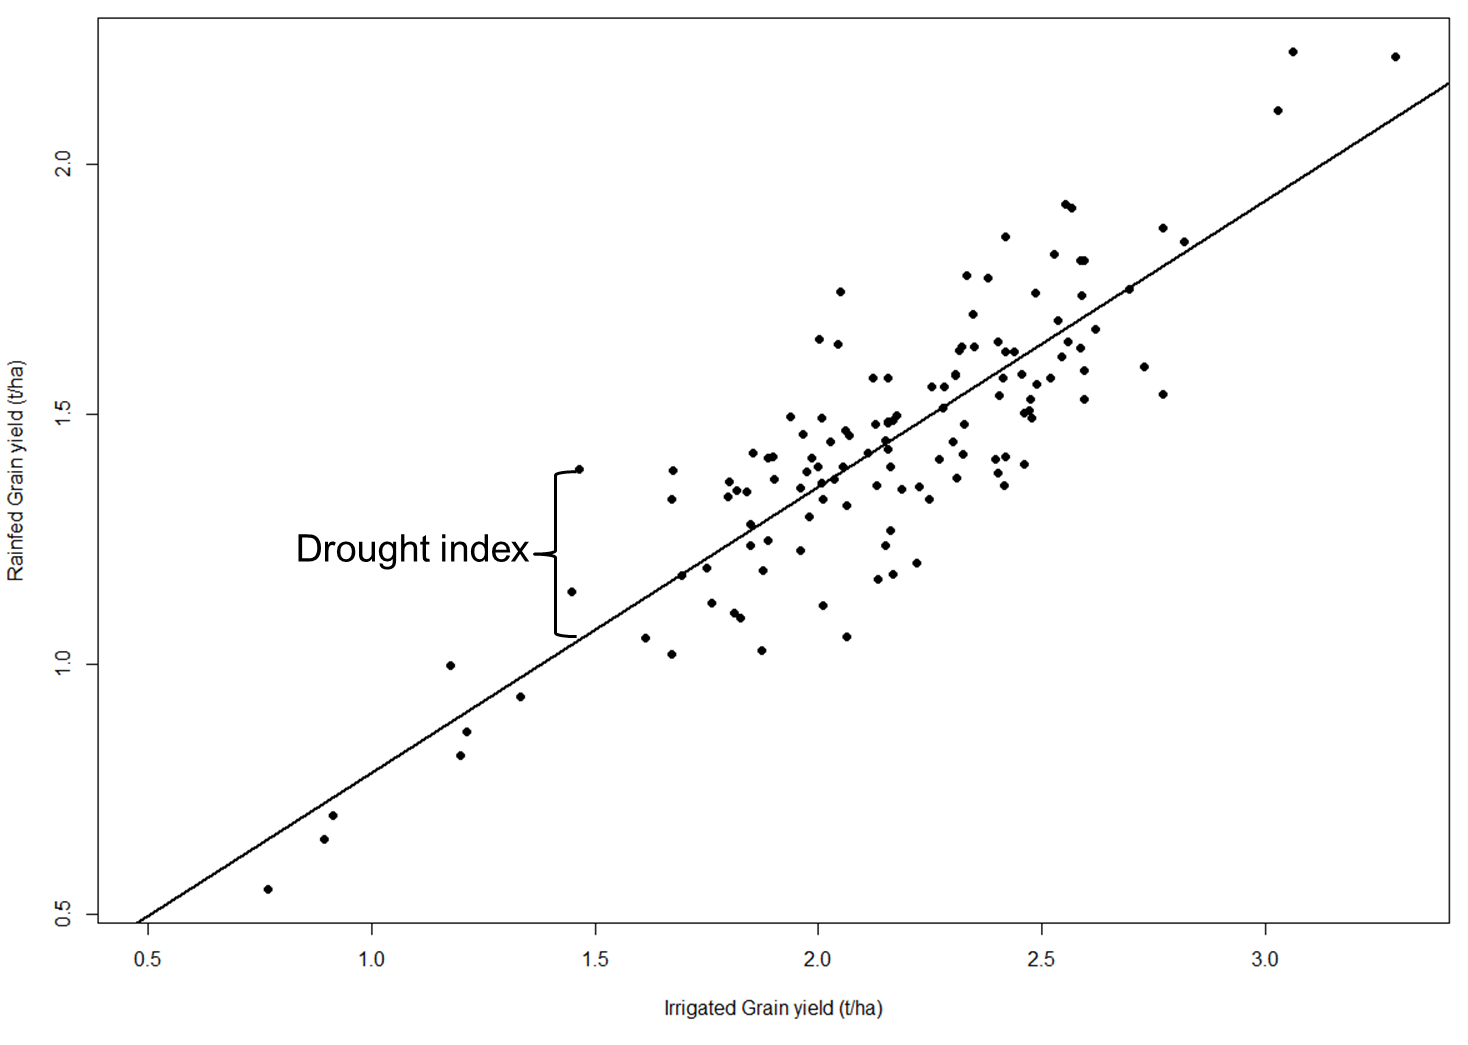
Figure 3. Irrigated versus Rainfed grain yield (t/ha) from Merredin 2014 with regression line used to calculate Drought Index (DI). Each cultivar is represented by a black dot identifying those above the line as having a positive DI and therefore more drought tolerant than those below the regression line.
Interpreting and using DI information
The trials conducted at the Merredin MEF produced yield potentials of between 1.5 and 4.0t/ha. The average ‘Rainfed’ yield for cultivars across the four seasons (2011-2014) ranged from 1.4-2.6t/ha, compared to the average for corresponding ’Irrigated’ treatments of 2.1-3.6t/ha (Figure 4).
Generally, the higher the average yield for a cultivar, the higher the respective DI (Figure 4). However there is variability in the DI of cultivars which indicates some cultivars are more drought tolerant. Both TrojanA and DrysdaleA have identical yields under the Rainfed treatment, but the difference in response to applied irrigation resulted in TrojanA having a higher DI and hence could be viewed as being more drought tolerant than DrysdaleA in these trials. The standard error for the DI values is used as an indicator of DI reliability. Therefore, cultivars with a high standard error, as indicated by long error bars in Figure 4, have a less reliable DI. By comparing the length of the error bars for DartA and WyalkatchemA, for example, it is evident that the DI value for WyalkatchemA, with a short error bar, is much more reliable than that of DartA, which has a long error bar. The short error bar (greater reliability) of the DI value for WyalkatchemA gives more confidence in the repeatability of the drought tolerance observed.
These results can be interpreted in several differing ways with varying conclusions, depending on the reason for using the results (Table 1). From a strictly plant breeding point of view, where the breeder wants to improve the drought tolerance in their breeding material, then the cultivars with the highest and most reliable DI values would be preferred, in addition to other desired plant traits such as yield and disease resistance. Examples of cultivars with preferred DI values as a measure of drought tolerance include WyalkatchemA, EstocA or YitpiA (Table 1).
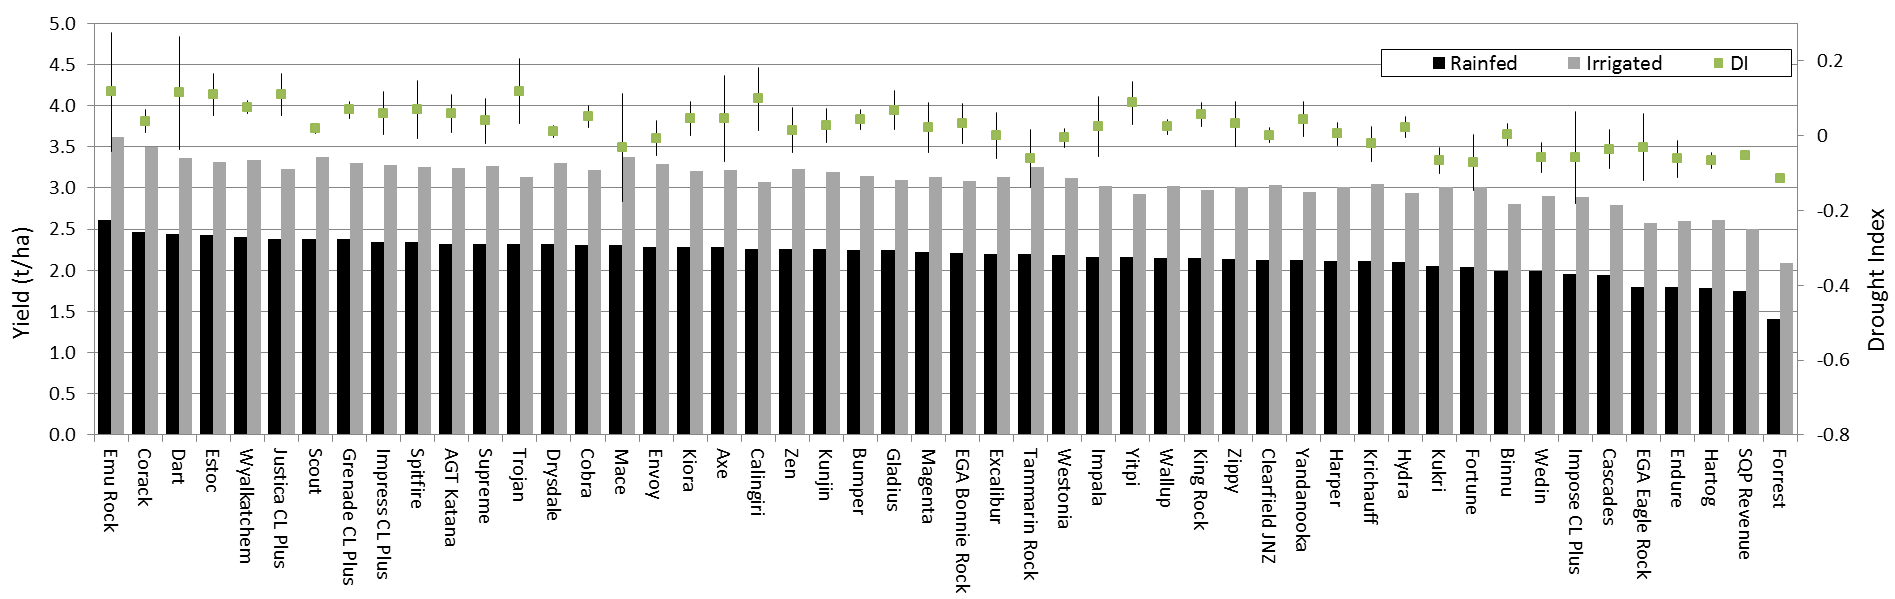
Figure 4. Predicted grain yield (t/ha) and Drought Index (DI) for selected commercial cultivars at Merredin, 2011-2014. Error bars are +/- standard error for Drought Index.
Table 1. Classification of selected commercial cultivars based on ‘Rainfed’ yield and Drought Index calculated using data from four seasons at Merredin (* indicates high reliability in Drought Index, ^ indicates low reliability, † indicates very low reliability, moderate reliability entries have no symbol).
|
Rainfed Yield Range (t/ha) |
Drought Index Range <-0.04 |
Drought Index Range -0.04 – 0.0 |
Drought Index Range 0.0 – 0.04 |
Drought Index Range 0.04 – 0.08 |
Drought Index Range >0.08 |
|
<1.8 t/ha |
^EllisonA EndureA ^ForrestA Hartog ^SQP RevenueA Sunco ^Sunstate |
^EGA Eagle RockA
|
|
|
|
|
1.8 – 2.0 t/ha |
CrusaderA GazelleA ^Impose CLA ^KennedyA ^LincolnA LR HornetA ^PugsleyA Sunbri VikingA WedinA |
Cascades FrameA
|
BinnuA Cunningham ^Sunvale
|
|
|
|
2.0 – 2.2 t/ha |
EspadaA ^FortuneA H45A KukriA †PrestonA ^Tammarin RockA
|
CharaA EGA GregoryA Krichauff ShieldA *StrzeleckiA Westonia |
*Clearfield JNZA *CosmickA ^EGA WedgetailA HarperA HydraA ^ImpalaA Janz SentinelA *WallupA ZippyA |
^GBA Hunter King RockA YandanookaA
|
†CatalinaA YitpiA |
|
2.2 – 2.4 t/ha |
|
CorrellA EnvoyA Excalibur †MaceA YoungA
|
*DrysdaleA EGA Bonnie RockA Kord CL PlusA KunjinA MagentaA *ScoutA SuntopA SupremeA ZenA |
AGT KatanaA ^AxeA BumperA CobraA GladiusA Grenade CL PlusA Impress CL PlusA KioraA Sabel CL Plus ^SpitfireA |
^Calingiri Justica CL PlusA ^MerlinA ^TrojanA
|
|
>2.4 t/ha |
|
|
CorackA
|
*WyalkatchemA |
†DartA †Emu RockA EstocA |
However, a wheat grower in the low rainfall areas of the Eastern Wheatbelt, for example, could use these results from Merredin as a guide to select a cultivar with a high yield in the ‘Rainfed’ treatments with a low DI value. This means that on the occasion when the grower receives extra rainfall during Spring compared to normal, then the cultivar is better able to take advantage of this rainfall. While this seems counter intuitive, if the grower has a cultivar that has a high yield across a range of low rainfall seasons but can out-yield similar performing cultivars when extra rain occurs, then this is an advantage to that grower (eg DrysdaleA vs TrojanA). A commonly grown cultivar of this type is MaceA, which is high yielding under rainfed conditions, as well as under supplementary irrigation, meaning it achieves a relatively low DI score. Other examples of cultivars with relatively low DI are CorackA, ScoutA or EnvoyA.
Alternatively, a wheat grower in a higher yield potential area with more reliable rainfall, such as the Kojonup area, would prefer a cultivar with a higher average yield in the ‘Irrigated’ treatments (as more representative of their rainfall) and a higher DI value. This is because such a cultivar would maintain relatively high yields during the drier seasons compared to cultivars with a lower DI. Cultivars in this group include Emu RockA (low DI reliability), DartA (low DI reliability) and EstocA. This scenario needs to be validated by repeating the experiment at a higher yield potential site, with similar rainfall patterns that cause flowering and post flowering moisture deficits, to confirm this interpretations of the results.
Conclusion
This GRDC funded research shows that there is variability in drought tolerance of wheat cultivars which can be used by breeders when developing new breeding lines. Through the use of MEF sites like at Merredin, these breeding lines can be evaluated for terminal drought tolerance.
Choosing the right cultivar for each environment should result in greater productivity and this research will assist in these decisions. However, it is important to remember that response to drought should be used as a variety characteristic in addition to other traits that can influence productivity and profitability, such as quality classification, disease resistance ratings and maturity when deciding what variety to grow.
This information has only been gathered from a small number of seasons and results presented from one location. Additional research seasons and locations will improve the reliability of any drought tolerance information produced.
References
Chenu, K., Deihimfard, R., and Chapman, S. C. (2013a). Large-scale characterization of drought pattern: a continent-wide modelling approach applied to the Australian wheatbelt – spatial and temporal trends. New Phytologist 198, 801-820.
Chenu, K., Doherty, A., Rebetzke, G. J., and Chapman, S. C. (2013b). StressMaster: a web application for dynamic modelling of the environment to assist in crop improvement for drought adaptation. In "7th International Conference on Functional-Structural Plant Models " (R. N. Sievänen, E., C. L. Godin, A. and P. Nygren, eds.), pp. 357-359, Saariselkä, Finland
Lemerle D., Smith A., Verbeek B, Koetz E., Lockley P. and Marin P. (2006) Incremental crop tolerance to weeds: A measure for selecting competitive ability in Australian wheats. Euphytica 149: 85-95.
Key words
Drought, wheat, breeding
Acknowledgments
This research was funded by the GRDC as the “Characterising water deficit and benchmarking genetic diversity in wheat for key adaptive traits at Merredin, Yanco and Narrabri MEFs” project.
The MEF teams at Merredin (DAFWA), Narrabri (University of Sydney) and Yanco (NSW DPI) for all of their hard work.
The DAFWA Project team including Ben Biddulph, Mike Baker (both South Perth), Cecelia DuPlessis and other Merredin staff.
All of the collaborative projects from other organisations including DAFWA, CSIRO, Australian Grain Technologies, InterGrain and other participating plant breeders.
GRDC Project Number: DAW00215
GRDC Project Code: GIA00004,
Was this page helpful?
YOUR FEEDBACK