Oat agronomy update achieving your yield and quality potential
Author: Georgie Troup, DAFWA | Date: 29 Feb 2016
Georgie Troup1, Blakely Paynter1 and Raj Malik2
Department of Agriculture and Food, Western Australia, 1Northam and 2Katanning.
Key messages
- Seeding date had a greater influence on oat grain yield, oat grain quality and return per hectare ($/ha) than variety selection or seed rate in 2015.
- Delaying seeding from early May to early June reduced grain yield by 32% and return per hectare by 45%.
- In lower rainfall environments Bannister is a better option than Carrolup, Williams and Yallara.
- When released, WA02Q302-9 will be a useful oat variety in situations where low hectolitre weight is consistently a problem or with later seeding opportunities.
- Maximum return per hectare was achieved between a target density of 100 to 200 plants/m2, which is in line with the suggested target density for grain oats in low rainfall areas of 160 plants/m2.
- The return per hectare of Bannister oat was maximised at a higher density than for Carrolup, WA02Q302-9, Williams and Yallara, suggesting Bannister should be sown at a higher target density than those varieties. This is a preliminary observation and more research is needed to confirm the optimum target density for the new milling oat varieties.
Aims
Investment in milling oat processing capacity, coupled with increased demand from both domestic and export processors for oats for human consumption has resulted in a competitive market for oat grain in Western Australia. Growers in lower rainfall regions are particularly keen to take advantage of the current pricing and have been evaluating their choice of varieties. Newly released milling varieties Bannister and Williams have been performing well in NVT trials over recent years and have created a lot of grower interest.
Along with assessing their variety choice, oat growers in low rainfall areas have also been questioning their target seed rates. They are enquiring about how the new varieties respond to seed rate, and in particular how their hectolitre weight and screenings holds up at higher seed rates. The suggested target plant density for grain oats in Western Australia is 160 plants/m2 (seed rate of 70 to 100 kg/ha) in low rainfall areas and 240 plants/m2 (seed rate of 105 to 155 kg/ha) in medium to high rainfall areas (Malik et al. 2011). Oat agronomy trials conducted in 2014 suggested that the grain quality of Bannister and Williams was more sensitive to increasing plant density than established varieties like Carrolup in lower rainfall regions (Troup et al. 2015). Those trials were however sown at the end of the ‘modern oat grower’ sowing window for milling oats (late May). Therefore we were interested to see if higher seeding rates had the same impact on grain quality when oats are sown in late April to early May in lower rainfall regions.
The aim of this study was to:
- evaluate the responsiveness of Bannister and Williams oats to increasing plant density,
- quantify the effect that plant density has on oat grain quality if a crop is sown early versus late, and
- determine if Bannister and Williams oats are suitable for lower rainfall regions.
Table 1. Plant density to seed rate conversion in oats.
|
|
|
Target plant density (plants/m2) |
|||||
|
|
|
50 |
100 |
160 |
240 |
320 |
400 |
|
1000 seed weight |
Seeding rate (kg/ha) |
||||||
|
25 |
g |
15 |
32 |
52 |
77 |
118 |
147 |
|
30 |
g |
18 |
39 |
62 |
93 |
141 |
177 |
|
35 |
g |
21 |
45 |
72 |
108 |
165 |
206 |
|
40 |
g |
24 |
52 |
82 |
124 |
189 |
236 |
|
germination % |
97% |
97% |
97% |
97% |
97% |
97% |
|
|
establishment % |
85% |
80% |
80% |
80% |
70% |
70% |
|
|
|
|
|
|
|
|
|
|
|
Seeding rate = |
100 x (1000 seed weight x target density) |
||||||
|
|
|
(germination % x establishment %) |
|||||
Method
This study was undertaken in 2015 at Cunderdin, Holt Rock and Merredin (Table 2) to compare five milling oat varieties, Bannister, Carrolup, WA02Q302-9 (under milling evaluation), Williams, and Yallara and one hay breeding line 05096-32, at four target plant densities (50, 100, 200, and 400 plants/m2) and two seeding dates (May and June – 4 weeks apart). Trials were established into canola stubble and were direct-drilled with a small plot air-seeder with on-row packing press wheels. Oat seed was placed at 2 to 3 cm depth. An NPK compound fertiliser was banded below the seed at 180 kg/ha, with 43 kg/ha of urea top-dressed in front of the bar, supplying a total of 40 kg N/ha, 25 kg P/ha and 9 kg K/ha. At sowing there was sufficient moisture in the soil profile to germinate the seed. Rainfall was low during spring at all locations.
The seed rate (kg/ha) to establish the target densities of 50, 100, 200, and 400 plants/m2 varied for each variety and was adjusted based on their grain weight and germination percentage. A seed rate of 50 plants/m2 = 15 to 25 kg/ha, 100 plants/m2= 30 to 50 kg/ha, 200 plants/m2= 65 to 105 kg/ha, 400 plants/m2= 145 to 235 kg/ha (Table 1). Plant establishment was determined at 4 weeks after seeding (WAS) by counting the number of plants in 2 rows x 1 m x 2 locations per plot.
Trials were sown as a split plot cyclic design with variety and time of sowing (TOS) as whole plots and seed rate randomised as subplots within a variety + TOS combination. Data was analysed within Genstat (VSN International 2013) with a block structure of (rep+colrep/TOS)/variety and a treatment TOS x variety x plant density.
Grain yields (t/ha) were recorded at harvest and cleaned samples (sample > 1.5 mm) were used to determine grain quality. Grain was assessed for standard GIWA Oat receival specifications (hectolitre weight, kg/hL and screenings, % < 2.0 mm) and grain protein) plus kernel weight (mg, db), grain protein concentration (%, db), groat per cent (%), grain colour (Minolta ‘L*’, “a*’ and ‘b*’) and oil per cent (%). Only the grain yield, hectolitre weight and screenings data are presented in this paper.
Data for the hay oat breeding line 05096-32 has not been included in this paper as it has not been progressed to commercial release.
Table 2. Location, soil type, previous crop, growing season rainfall (May-Oct) and soil test (0-10 cm) data.
|
Site |
Location |
TOS1 (date) |
TOS2 (date) |
May-Oct rainfall (mm) |
Organic C (%) |
pHCa (0-10cm) |
Soil type |
|
15NO30 |
Cunderdin |
5-May-15 |
4-Jun-15 |
167 |
0.87 |
5.8 |
Red loamy earth |
|
15ME22 |
Merredin |
8-May-15 |
8-Jun-15 |
211 |
1.35 |
5.2 |
Red sandy earth |
|
15KA22 |
Holt Rock |
1-May-15 |
2-Jun-15 |
140 |
1.06 |
5.5 |
Shallow sand over clay |
Table 3. Analysis of variance for main effects (variety, density and seeding date) and their interactions at Cunderdin, Merredin and Holt Rock. Significance: *** = p<0.001, ** = p<0.01, * = p<0.05 and n.s. = not significant.
|
|
Grain yield (t/ha) |
Hectolitre weight (kg/hL) |
Screenings (% < 2.0 mm) |
||||||
|
|
Cunderdin |
Merredin |
Holt Rock |
Cunderdin |
Merredin |
Holt Rock |
Cunderdin |
Merredin |
Holt Rock |
|
Variety (V) |
** |
*** |
* |
*** |
*** |
*** |
*** |
*** |
*** |
|
Plant density (D) |
** |
*** |
*** |
n.s. |
n.s. |
n.s. |
n.s. |
*** |
*** |
|
Seeding date (T) |
n.s. |
*** |
** |
n.s. |
*** |
*** |
** |
*** |
*** |
|
V x D |
n.s. |
n.s. |
* |
n.s. |
n.s. |
n.s. |
n.s. |
n.s. |
* |
|
V x T |
n.s. |
*** |
n.s. |
** |
n.s. |
n.s. |
*** |
*** |
n.s. |
|
T x D |
n.s. |
** |
n.s. |
*** |
*** |
*** |
** |
*** |
** |
|
V x T x D |
n.s. |
n.s. |
n.s. |
n.s. |
n.s. |
n.s. |
n.s. |
n.s. |
n.s. |
Results
Grain yield
Grain yield was influenced by plant density at all three sites and decreased with delayed seeding at two sites, Merredin and Holt Rock (Table 3, Figures 1 and 2). An interaction between date of planting and variety was only observed at Merredin and date of planting and seed rate only at Holt Rock (Table 3).
Carrolup was the lowest yielding variety across sites and sowing dates (Figure 1). With early May sowing Bannister and Williams were 0.34 t/ha higher yielding than WA02Q302-9 and Yallara and 0.61 t/ha better than Carrolup, averaged over seed rates. With early June sowing WA02Q302-9 was 0.27 t/ha higher yielding than Williams and Yallara and 0.41 t/ha higher yielding than Bannister and Carrolup.
Plant density influenced grain yield at all three sites. Increasing plant density from 50 to 100 plants/m2, increased grain yield by 10% (0.2 t/ha) at Cunderdin, 11% (0.2 t/ha) at Merredin and 14% (0.3 t/ha) at Holt Rock (Figure 2a). Grain yield plateaued between 100 and 200 plants/m2 before decreasing slightly above 200 plants/m2 (except at Cunderdin).
There was an interaction between variety and plant density only at Holt Rock. Bannister, Carrolup and Williams responded (grain yield increased) out to at least 200 plants/m2, whereas WA02Q302-9 and Yallara responded out to only 100 plants/m2 (Figure 2b).
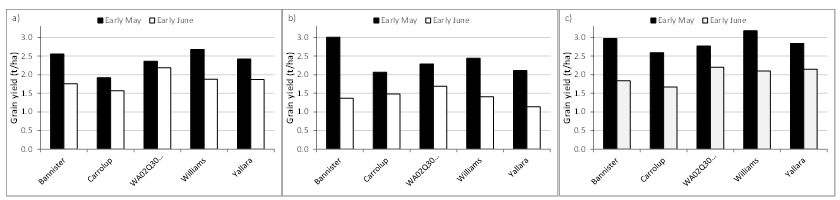
Figure 1. The effect of sowing date on grain yield at a) Cunderdin, LSD (p=0.05) = 0.7 t/ha, b) Merredin, LSD (p=0.05) = 0.2 t/ha and c) Holt Rock, LSD (p=0.05) = 0.4 t/ha.
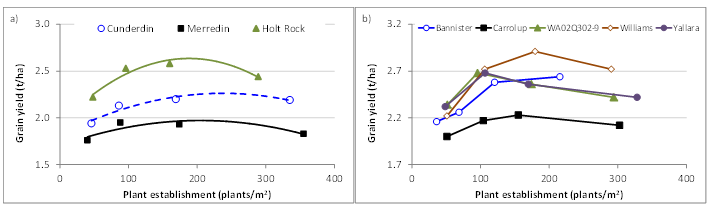
Figure 2. a) Average grain yield response to increasing density at Cunderdin, Merredin and Holt Rock, LSD (p = 0.05) = 0.1 t/ha and b) the effect of plant density on grain yield of six oat varieties at Holt Rock, LSD (p=0.05) = 0.4 t/ha .
Hectolitre weight
GIWA Oat specifications for hectolitre weight require oat grain to have a minimum hectolitre weight of 51 kg/hL for receival as Oat1 and 49 kg/hL for receival as Oat2. All varieties achieved the minimum hectolitre weight for receival as Oat2. When averaged over both seeding dates and sites, WA02Q302-9 had the highest hectolitre weight (Figure 3). WA02Q302-9 exceeded the Oat1 hectolitre receival limit in all treatments, with an average hectolitre weight of 58.6 hg/hL compared to Bannister, 55.3 kg/hL and Williams, 52.6 kg/hL. Bannister, Carrolup and Yallara produced similar hectolitre weights, while Williams had the lowest hectolitre weight. Williams failed to meet Oat1 standards in 40% of treatments with early June planting.
Hectolitre weight decreased with delayed seeding at two sites, by 3.4 kg/hL at Merredin and 1.8 kg/hL at Holt Rock (Table 3, Figure 3b and c). A variety by date of seeding interaction was observed at Cunderdin, with the hectolitre weight of Williams decreasing when sowing was delayed, while the hectolitre weight of Bannister, Yallara and WA02Q302-9 increased.
The hectolitre weight of varieties responded similarly to changes in plant density at most sites. With early May sowing, there was a decrease in hectolitre weight with increased plant density and an increase when sown in early June (Figure 4).
There was an interaction between plant density and date of seeding at all three sites. Increasing plant density decreased hectolitre weight with early May seeding by 2%, while increasing plant density with early June seeding increased hectolitre weight by 2% (Table 3 and Figure 4). This observation was not altered by variety and was smaller than the impact of delayed seeding on hectolitre weight.
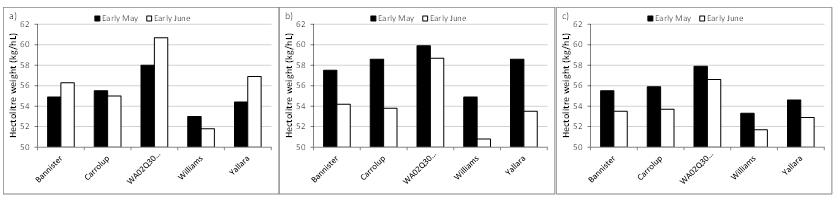
Figure 3. The effect of sowing date on hectolitre weight (kg/hL) at a) Cunderdin, LSD (P = 0.05) = 2.1, b) Merredin, LSD (P = 0.05) = 2.0 and c) Holt Rock, LSD (P = 0.05) = 1.1.
Figure 4. Average hectolitre weight (kg/hL) response of six oat varieties to increasing plant density at a) Cunderdin, LSD (P = 0.05) = 2.0, b) Merredin, LSD (P = 0.05) = 1.1 and c) Holt Rock, LSD (P = 0.05) = 0.5.
Screenings
To achieve the GIWA Oat1 specification the grain has a limit of 10% screenings, whilst for Oat2 there is no limit on screenings. Williams regularly exceeded the Oat1 screenings limit.
Delayed seeding doubled screenings (Figure 5). Bannister, WA02Q302-9 and Yallara (average 8%) had the lowest screenings with early May planting and Williams the highest (average 18%). WA02Q302-9 and Yallara (average 18%) had the lowest screenings with early June planting and Carrolup and Williams the highest (average 32%).
With early May sowing, there was a slight increase in screenings with increased plant density, except at Holt Rock and a decrease in screenings when sown in early June (Figures 5 and 6). The absolute change in screenings due to seed rate was smaller than the change due to seeding date.
The ranking of varieties was altered by date of seeding at Cunderdin and Merredin, with Williams having the highest screenings at when sown in early May, and Carrolup having the highest screenings when sown in early June. Ranking was altered by plant density at Holt Rock, with WA02Q302-9 screenings reduced by increasing plant density, while the screenings of the other four varieties was not affected by increasing plant density.
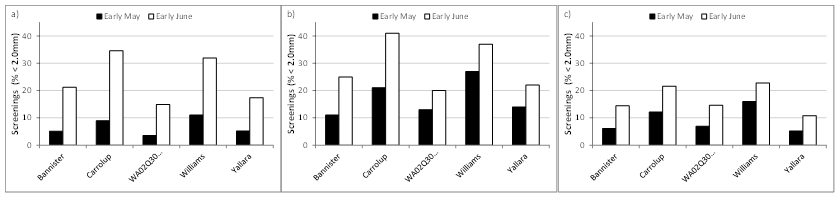
Figure 5. The effect of sowing date on screenings (%) at a) Cunderdin, LSD (P = 0.05) = 5.3 b) Merredin, LSD (P = 0.05) = 3.4 and c) Holt Rock, LSD (P = 0.05) = 2.9.
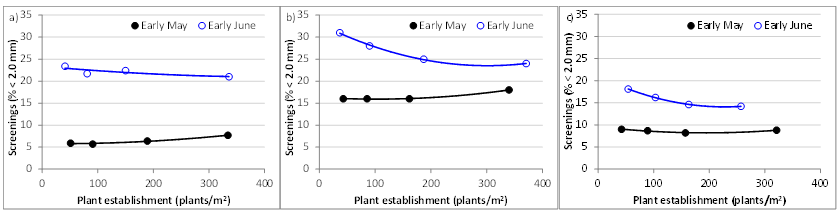
Figure 6. Average screenings (%) response of six oat varieties to increasing plant density at a) Cunderdin, LSD (P = 0.05) = 5.1, b) Merredin, LSD (P = 0.05) = 2.7, and c) Holt Rock, LSD (P = 0.05) = 1.8.
Economic analysis
An economic analysis calculating return (yield by price minus costs) was done for each variety, plant density, seeding date and site using the assumptions in Table 4 and the current GIWA Oat receival standards for Western Australia.
Williams had the lowest proportion of samples meeting the GIWA Oat1 receival specifications, with no samples being suitable for receival as Oat1. The grain quality of Bannister and WA02Q302-9 was suitable for receival as Oat1 at Cunderdin and Holt Rock, but only with early May sowing.
Seeding date had the greatest influence on return per hectare. Crops sown in early May had a higher return than the same crop sown in early June, by $280/ha averaged over sites. When sown in early May Bannister had the highest return per hectare (at is maximum return), higher than the next best variety Williams by $59/ha. When sowing was delayed until early June the breeding line WA02Q302-9 had the highest return per hectare, higher than the next best variety Williams by $47/ha (Table 5).
Maximum return was achieved by sowing between 100 to 200 plants/m2, with differences in the optimum density noted between varieties (Table 5 and Figure 7). The decrease in return above 200 plants/m2 was larger with early May sowing than with early June sowing. The seed rate that maximised returns in Bannister was higher than that for the other four varieties, being closer to 200 plants/m2 than 100 plants/m2. Carrolup, WA02Q302-9 and Yallara had a similar seed rate response at both sowing dates, with maximum return achieved around the target density of 100 plants/m2 and declining as the target density was increased to 200 plants/m2. The maximum return in Williams was achieved between the target densities of 100 and 200 plants/m2 with early May sowing, but around 100 plants/m2 with early June sowing.
Table 4. Assumptions used in economic analysis.
|
|
Indicative cash price ($/t) |
EPR ($/t) |
1000 seed weight (g) |
Seed rate (kg/ha) to achieve |
|||||
|
Variety |
Oat1 |
Oat2 |
Oat3 |
50 plants/m2 |
100 plants/m2 |
200 plants/m2 |
400 plants/m2 |
||
|
Bannister |
$350 |
$330 |
$120 |
$2.30 |
35.0 |
21 |
44 |
93 |
200 |
|
Carrolup |
$350 |
$330 |
$120 |
$0.00 |
35.0 |
21 |
44 |
93 |
200 |
|
WA02Q302-91 |
$350 |
$330 |
$120 |
$2.30 |
37.5 |
22 |
47 |
100 |
214 |
|
Williams |
$350 |
$330 |
$120 |
$2.30 |
35.0 |
21 |
44 |
93 |
200 |
|
Yallara |
$350 |
$330 |
$120 |
$2.00 |
37.5 |
22 |
47 |
100 |
214 |
|
Establishment percent |
|
|
|
|
85% |
80% |
75% |
70% |
|
|
|
|
|
|
|
|
|
|
|
|
|
Oat receival + BAMA |
$12.50 |
$/t |
|
|
|
|
|
|
|
|
Freight: farm to port |
$24.50 |
$/t |
farm to bin + bin to natural port |
||||||
|
Seed cost |
$400 |
$/t |
|
|
|
|
|
|
|
|
Germination percent |
97 |
% |
|
|
|
|
|
|
|
|
Operating costs |
$160 |
$/ha |
low rainfall - fuel, fertiliser, weed control, foliar fungicides |
||||||
|
R&D levy |
1.02% |
farm gate value |
|
|
|
|
|
|
|
|
1cash price and EPR for WA02Q302-9 assumed to be same as Bannister and Williams. |
|||||||||
Table 5. Return ($/ha, yield by price minus costs) with increasing seed rate of five oat varieties averaged over all sites.
|
Seeding date |
Early May |
Early June |
||||||
|
Variety |
Seeding rate (target plants/m2) |
Seeding rate (target plants/m2) |
||||||
|
50 |
100 |
200 |
400 |
50 |
100 |
200 |
400 |
|
|
Bannister |
$637 |
$668 |
$711 |
$637 |
$261 |
$282 |
$274 |
$304 |
|
Carrolup |
$450 |
$493 |
$470 |
$395 |
$233 |
$295 |
$281 |
$230 |
|
WA02Q302-9 |
$556 |
$591 |
$565 |
$472 |
$352 |
$418 |
$396 |
$368 |
|
Williams |
$566 |
$652 |
$645 |
$549 |
$272 |
$352 |
$371 |
$287 |
|
Yallara |
$549 |
$607 |
$575 |
$444 |
$265 |
$333 |
$306 |
$277 |
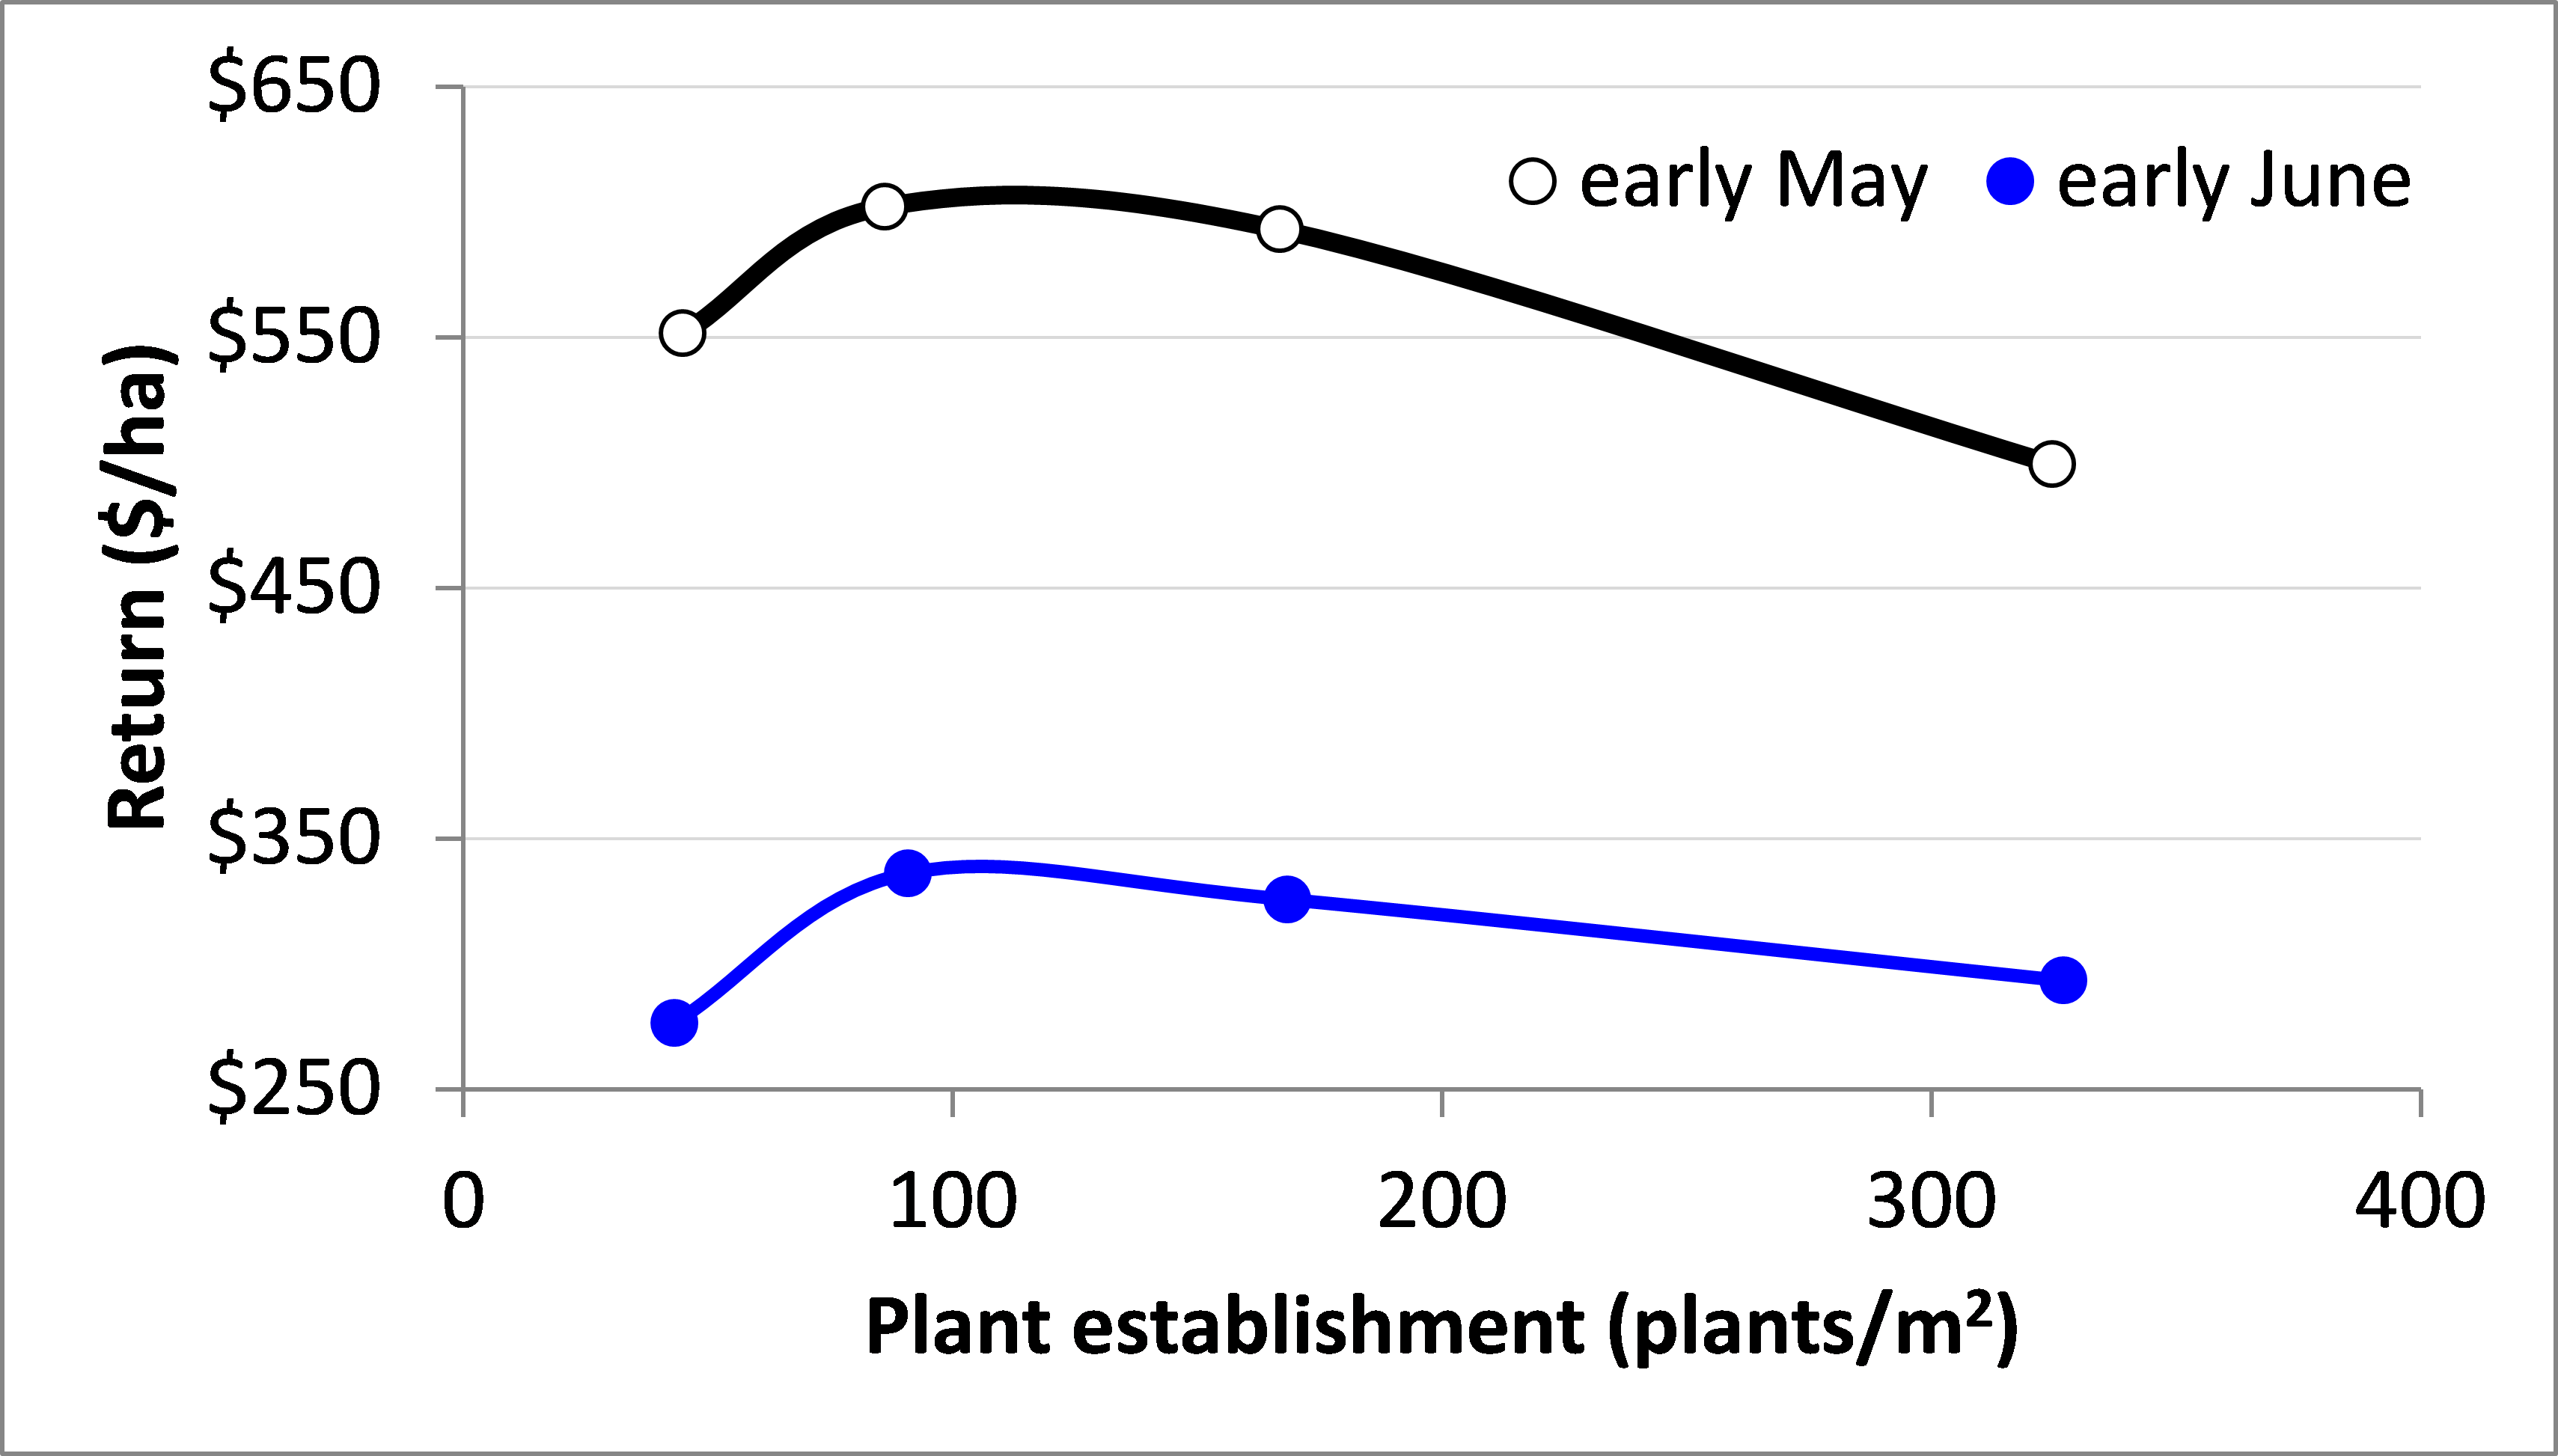
Figure 7. Return ($/ha, yield by price minus costs) with increasing seed rate at early May and early June averaged across varieties and sites.
Conclusion
Early seeding was the key to producing optimal grain quality, high grain yield and maximum return per hectare from oat grain production in our seed rate trials in lower rainfall areas in 2015. When sowing was delayed from early May to early June grain yield reduced by 32% and this was reflected in a 45% reduction in returns per hectare and a higher proportion of Oat2 quality grain produced. Variety choice and seeding date had a larger impact on what grade of oat was produced than plant density (Figures 3, 4, 5 and 6). Plant density did influence hectolitre weight and screenings, but the effects were generally small and often not large enough to change the grade.
Carrolup was the poorest performing variety in this study.
Although Williams performed well in this study as a high yielding oat variety, its tendency for low hectolitre weight and high screenings, which is consistent with the observations of Troup et al. (2015), suggests that growers in lower rainfall areas should focus on growing Bannister. Williams did not make Oat1 regardless of sowing date or plant density and had a lower average return than Bannister across sites with early May seeding.
WA02Q302-9, when released, may be an another option where hectolitre weight is regularly the limiting factor (especially now that there is no feed oat grade) or for later sowing opportunities. With early June sowing WA02Q302-9 had the highest probability of meeting Oat1 due to its high hectolitre weight, the highest grain yield and the highest return per hectare.
In this study the optimum plant density (based on return per hectare) was between the target densities of 100 to 200 plants/m2 (Figure 7). This is in line with the recommendations of Malik et al. (2011), where the optimal seed rate suggested for sowing oats for grain production in low rainfall areas is 160 plants/m2. The seed rate that maximised return per hectare however varied by variety (Table 5).
Bannister differed in its sensitivity (based on return per hectare) to increasing seed rate than the other four varieties evaluated (Table 5). This study suggests that Bannister should be sown at a higher seed rate than Carrolup, WA02Q302-9, Williams and Yallara to maximise its return. This observation, however, needs testing across more seasons to confirm.
In this study sowing the crop at a plant density suitable for hay production (240 to 320 plants/m2, Malik et al. 2011) would not have optimised grain returns per hectare. The penalty was at least $40/ha with early May sowing and at least $20/ha with early June sowing; and bigger in Carrolup, WA02Q3029-9, Williams and Yallara than it was in Bannister.
References
Malik R, Paynter BH, Webster C and McLarty A (2011). Growing oats in Western Australia for hay and grain. Department of Agriculture and Food, Western Australia, Bulletin 4798.
Troup GM, Paynter BH and Malik R (2015). Bannister and Williams, how do the new oat varieties stack up? 2015 Agribusiness Crop Updates, Perth, WA, 24-25 February 2015
VSN International (2013). GenStat for Windows 16th Edition. VSN International, Hemel Hempstead, United Kingdom.
Key words
Oat, variety specific management, grain yield, grain quality, hay yield, hay quality
Acknowledgments
The author acknowledges the technical support of Helena O’Dwyer, Sue Cartledge, Rod Bowey, Michelle Sampson and the DAFWA Research Support Units at Northam, Merredin and Katanning. This research is supported by the Department of Agriculture and Food Western Australia with co-funding from the Grains Research and Development Corporation. A draft of this paper was reviewed by Mark Seymour, Department of Agriculture and Food, Western Australia.
GRDC Project Number: DAW00227
GRDC Project Code: GIA00004,
Was this page helpful?
YOUR FEEDBACK