The interaction between soil pH and phosphorus fertilizer is dynamic
Author: Dr Craig Scanlan, DAFWA | Date: 29 Feb 2016
Craig Scanlan, Ross Brennan, Mario D’Antuono and Gavin Sarre, Department of Agriculture and Food Western Australia.
Key messages
- An interaction between soil pH and phosphorus fertiliser is most likely when:
- There are no other major nutritional constraints to crop growth.
- A large change (>0.5 pH units) has been made to subsurface pH by lime application.
- When the two criteria above have been met, an interaction between soil pH and phosphorus fertiliser can lead to greater availability of soil phosphorus.
Aims
To determine whether increased soil pH improves soil phosphorus (P) availability to crops.
Method
Experimental design
All experiments had a split-plot design. Lime rate was the main treatment and nutrient rate was the sub-treatment. Lime treatments were applied in 2012. The Wongan Hills and Northam sites were managed as chemical fallows between 2012 and 2015 while the Doodlakine and Merredin sites were cropped each year.
Four field experiments done in 2015 examined the interaction between soil pH and P fertiliser (Table 1). The experiments included 2 designs: (1) soil pH x P fertiliser level x potassium (K) fertiliser level (soil pH x P x K) and (2) soil pH x P fertiliser level in 2015 (soil pH x P). There were 2 experiments for each design. The trials with Design 1 were single-year experiments and the trials with design 2 will be re-sown in 2016 to examine the effect of soil pH on the residual value of P fertiliser applied in 2015. For all experiments, the soil pH treatments were created by applying 0, 2.5 and 5 t of lime sand /ha in May 2012. Barley cv. LaTrobe was sown at all sites in 2015. A summary of agronomic management of the experiments is shown in Table 1. P treatments (Design 1: 0, 4, 8, 16, 32 kg P/ha, Design 2: 0, 5, 10, 20, 40 kg P/ha) were applied as double superphosphate (18% P) and K treatments (0, 80 kg K/ha) were top-dressed at seeding as muriate of potash (50% K).
Table 1: Summary of agronomic management of field experiments.
|
Design |
Location |
Sowing date |
Seed sowing rate (kg/ha) |
Nitrogen applied (kg N/ha) |
|
1. Soil pH x P x K |
Wongan Hills |
19th May |
80 |
30 |
|
|
Merredin |
27th May |
60 |
25 |
|
2. Soil pH x P |
Northam |
14th May |
80 |
50 |
|
|
Doodlakine |
28th May |
60 |
35 |
Basal applications of nutrients were applied to remove the effect of nutrients not included in the experimental design. A micronutrient compound fertiliser was applied at seeding to provide 2.75, 2.5, 0.5 and 0.25 kg/ha of manganese, zinc, copper and boron, respectively. At Wongan Hills and Northam, the P treatments and micronutrients were drilled 2 cm below the seed and at Merredin and Doodlakine the nutrients were placed on top of the furrow. At Wongan Hills and Merredin, 20 kg S/ha was applied as gypsum at seeding. At Northam, 80 kg K and 33 kg S/ha was applied at seeding and at Doodlakine 40 kg K and 17 kg S/ha were applied at seeding as sulphate of potash.
Soil nutrient levels.
The soils at the Northam and Wongan Hills sites were Tenosols and the Colwell P and K at these sites was above critical ranges for P (20 to 31 mg/kg) and K (32 to 52 mg/kg). The soils at the Merredin and Doodlakine sites were Kurosols (duplex soil with acidic B horizon) and the Colwell P and K at these sites were also above the appropriate critical ranges for P (20 to 25 mg/kg) and K (35 to 45 mg/kg). Compared to other sites, the nitrate N and ammonium N at Wongan Hills were high due to the chemical fallow for the 3 years and mineralised N that had accumulated during that period.
Table 2: Some soil chemical properties for depth 0 to 10 cm for the field sites. Data shown are means of 9 blocks (3 lime treatments x 3 replicates)
|
Location |
Soil type |
Colwell P (mg/kg) |
PBI |
Colwell K (mg/kg) |
Organic carbon (%) |
Nitrate N (mg/kg) |
Ammonium N (mg/kg) |
|
Wongan Hills |
Tenosol |
31 |
14 |
67 |
0.95 |
55 |
11 |
|
Merredin |
Kurosol |
38 |
77 |
71 |
1.52 |
11 |
4 |
|
Northam |
Tenosol |
37 |
20 |
47 |
0.38 |
12 |
1 |
|
Doodlakine |
Kurosol |
55 |
39 |
199 |
1.20 |
20 |
3 |
Results
Soil chemical properties for 2015 experiments
Lime applied in 2012 increased the soil pH in 2015 at all sites although the increase in soil pH (1.0 unit) was largest at Wongan Hills. At Wongan Hills, application of 2.5 t lime/ha increased soil pH at 0-10, 10-20 and 20-30 cm by 0.60, 0.33 and 0.33 units compared to 0 t lime/ha, respectively. Application of 5 t lime/ha caused a greater increase to a greater depth: soil pH at 0-10, 10-20 , 20-30 and 30-40 cm increased by 1.03, 0.60, 0.43 and 0.30 units compared to 0 t lime/ha, respectively. At Northam, application of 2.5 and 5 t/ha lime increased soil pH at 0-10 cm by 0.45 and 0.48 units compared to 0 t lime/ha, respectively. The greatest change in subsoil pH at Northam occurred at 20-30 cm; it increased by 0.35 pH units in the 5 t lime /ha treatment. At Doodlakine, application of 2.5 and 5 t/ha lime increased soil pH at 0-10 cm by 0.60 and 0.77 units compared to 0 t lime/ha, respectively. At this site, soil pH at 10-20 cm was increased by only 0.17 units by the 5 t/ha treatment. The smallest increase in soil pH 0-10 cm occurred at Merredin although it had the highest initial soil pH (5.8). Application of 2.5 and 5 t/ha lime increased soil pH at 0-10 cm by 0.27 and 0.47 units, respectively and by 0.23 pH units at 10-20 cm for the 5 t lime /ha treatment.
Table 3: Soil pH (CaCl2) measured March 2015. Soil samples could not be retrieved from depths below 20 cm at Merredin and Doodlakine. Values are means of 3 replicates. sed is the standard error of the difference between means.
|
|
Rate of lime applied in 2012 (t/ha) |
|||||||||||
|
Soil depth (cm) |
Wongan Hills |
Merredin |
Northam |
Doodlakine |
||||||||
|
0 |
2.5 |
5 |
0 |
2.5 |
5 |
0 |
2.5 |
5 |
0 |
2.5 |
5 |
|
|
0-10 |
4.37 |
4.97 |
5.40 |
5.80 |
6.07 |
6.27 |
5.50 |
5.95 |
5.98 |
5.33 |
5.93 |
6.10 |
|
10-20 |
4.07 |
4.40 |
4.67 |
4.37 |
4.40 |
4.60 |
4.97 |
5.05 |
5.18 |
4.33 |
4.40 |
4.50 |
|
20-30 |
4.20 |
4.53 |
4.63 |
|
|
|
4.70 |
4.85 |
5.05 |
|
|
|
|
30-40 |
4.80 |
4.93 |
5.10 |
|
|
|
4.97 |
5.05 |
5.25 |
|
|
|
|
40-60 |
5.63 |
5.57 |
5.73 |
|
|
|
5.37 |
5.45 |
5.55 |
|
|
|
|
sed |
0.15 |
0.13 |
0.16 |
0.34 |
||||||||
Shoot nutrient concentration for 2015 experiments
Shoot nutrient concentrations at anthesis were above critical levels for most nutrients at Wongan Hills but below critical levels for most nutrients at Northam, Merredin and Doodlakine (Table 4). Zinc was deficient at Northam, Merredin and Doodlakine which may be due to long dry periods limiting timely access to the micronutrient fertiliser that was applied.
Grain yield for all experiments (2012 to 2015)
A significant lime x P interaction occurred at Wongan Hills (P<0.1). The interaction between the P dose-response curves for the 0 and 2.5 t/ha lime treatments was negative; the differences were greatest at 0 P and the curves converged as P level increased. The interaction between the dose response curves for the 2.5 and 5 t/ha treatments was also negative. The most important difference in grain yield occurred at 0 kg P; it was 2029, 3376 and 3698 kg ha for the 0, 2.5 and 5 t lime/ha treatments, respectively. Lime rate, P rate and K rate all had significant main effects; the mean for the 0, 2.5 and 5 t of lime /ha was 2932, 3815 and 4316 kg/ha respectively. The mean for the 0, 4, 8, 16 and 32 kg P/ha were 3034, 3743, 3487, 3832 and 4344 kg/ha, respectively. The mean for the 0 and 80 kg K/ha treatments was 3570 and 3805 kg/ha, respectively.
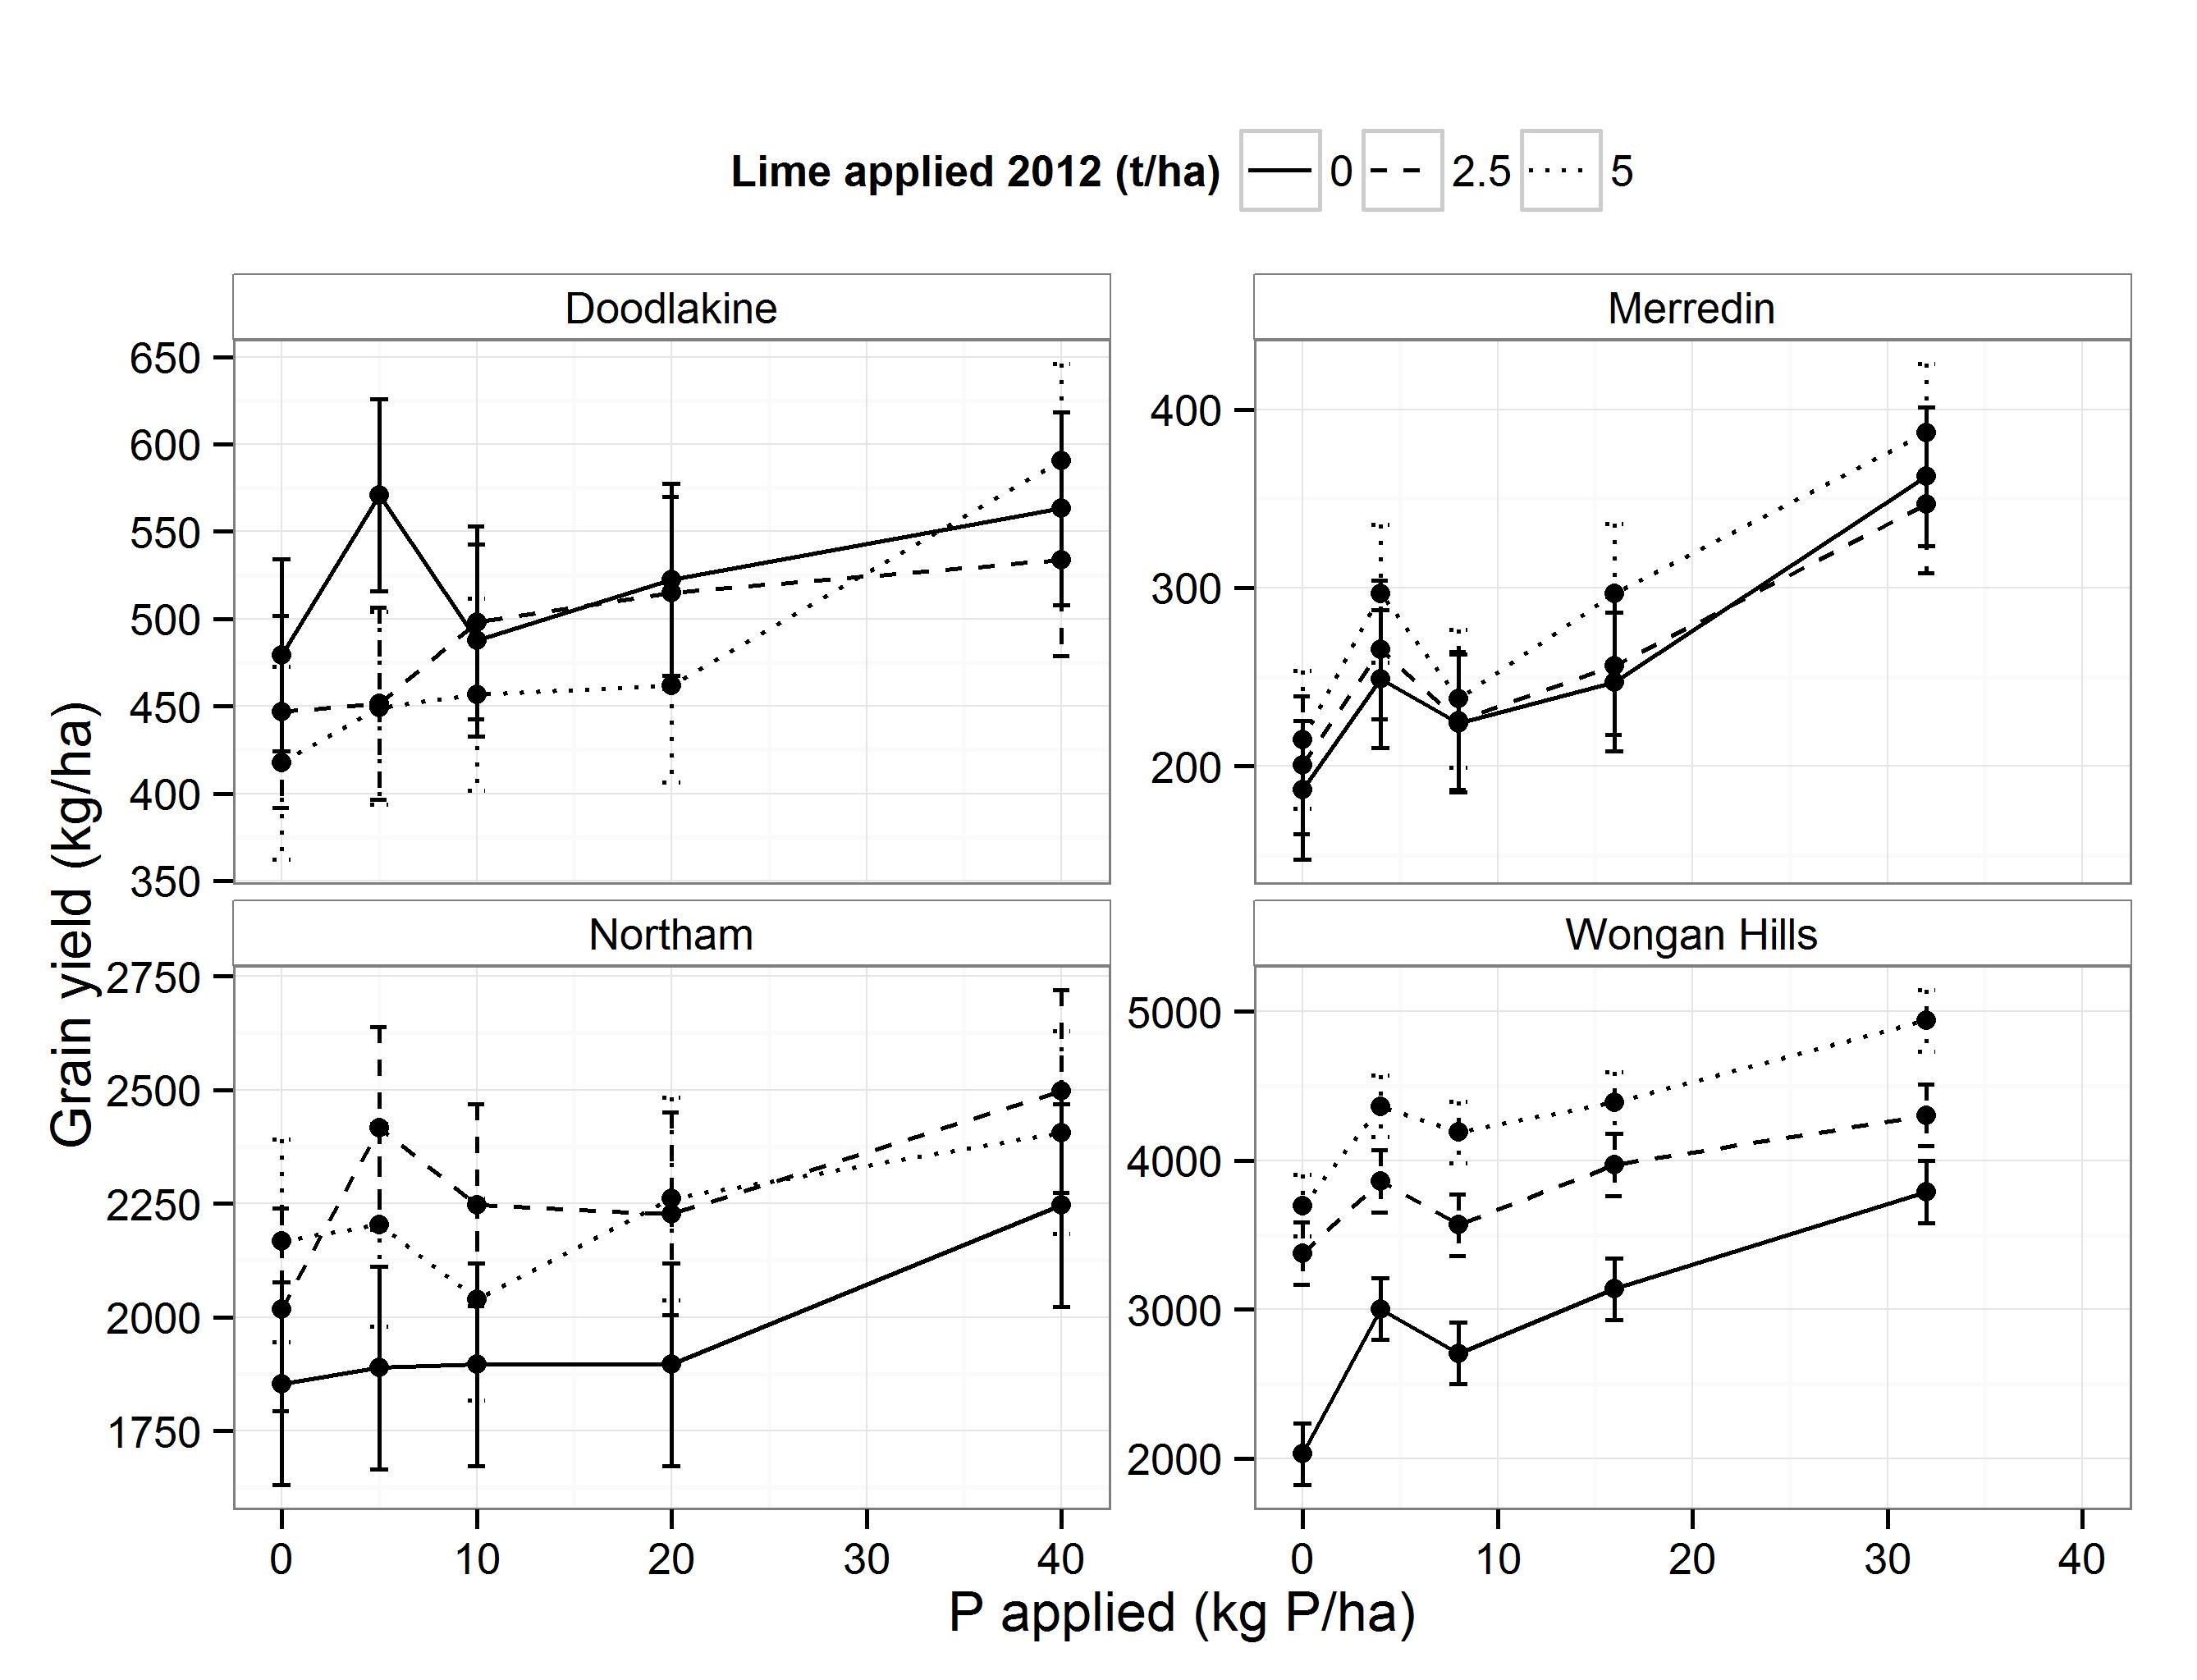
Figure 1: Grain yield response to phosphorus applied at seeding for field experiments in 2015. The figures for Wongan Hills and Merredin are the mean response of the 0 and 80 K treatments. Error bars are standard error.
Table 4: Summary of lime x phosphorus experiments, including experiments from 2012 & 2014 ordered by the level of interaction observed. The grain yield interaction is calculated as the difference in grain yield between the +lime and –lime treatments at 0 P minus the difference in grain yield between the +lime and –lime treatments at 32 P. Significance levels (Sig) of P<0.001, P<0.01, P<0.05 and P<0.1 are indicated by ***, **, * and – respectively. Adequate, marginal and deficient concentration of each nutrient at anthesis is indicated by ┴, ─ and ┬ respectively, based on mean concentrations at each site and critical values by Reuter and Robinson (1997).
At Merredin in 2015, there was a significant main effect of P and K and a significant P x K interaction. The mean grain yield for the 0, 4, 8, 16 and 32 kg P/ha was 201, 270, 229, 267 and 365 kg/ha, respectively. The mean grain yield for the 0 and 80 kg K/ha treatment was 233 and 299 kg/ha, respectively. There was also a significant, positive P x K interaction for grain yield; the 80 K treatment was 27 kg/ha higher than the 0 K when 0 P was applied and increased to a 102 kg/ha difference when 32 kg P was applied (data not shown).
P treatment had a significant effect on grain yield at Northam and Doodlakine. At Northam, the mean grain yield for the 0, 5, 10, 20 and 40 kg P/ha was 2012, 2169, 2060, 2128 and 2383 kg ha, respectively and at Doodlakine, the mean grain yield for the 0, 5, 10, 20 and 40 kg P/ha was 448, 490, 481, 499 and 563 kg/ha, respectively.
There was a common pattern of a decrease in grain yield when P fertiliser level was increased from 4 to 8 kg P/ha (Wongan Hills and Merredin) or from 5 to 10 kg P/ha (Northam and Doodlakine) although the decrease in grain yield was not always significant. This does not seem to be related to soil pH or lime treatment; at Northam there was no decrease in yield from 5 to 10 kg P in the 0t/ha lime treatment (pH 5.5) but there was a decrease in grain yield from 5 to 10 kg P/ha in the 0 t/ha lime treatment at Doodlakine. A comparison of soil chemical properties for each lime treatment at each site and the corresponding decrease in grain yield from 5 to 10 or 4 to 8 kg P/ha did not show any meaningful relationships. Our analysis of the yield loss at 8 or 10 kg P/ha is ongoing.
A comparison of the experiments shown in Table 4 suggests that a significant lime x P interaction for grain yield is dependent upon changes to soil pH by lime treatments and on zinc (Zn) nutrition (Table 3). In the 3 experiments where a significant lime x P interaction has occurred, there was a significant lime x depth interaction for soil pH (not shown here) and soil pH at 10-20 cm was >0.5 pH units higher in the +lime treatment compared to the –lime. Also, shoot Zn concentration was adequate or marginal where a significant lime x P interaction occurred but deficient at sites where the lime x P interaction was not significant. The occurrence of a significant increase in soil pH 10-20 cm and adequate Zn concentration in shoots is probably a coincidence and restricts our capacity to quantify how these factors interact. For example, it is likely that where shoot Zn concentration is deficient, the lime x P interaction for grain yield is constrained, but a combination of soil pH levels and Zn application levels are required to quantify this
Nitrogen and K supply affected the lime x P interaction for wheat in 2014 (not shown here). At Wongan Hills, soil K supply was reduced by lime application and there was no grain yield response to P application in the + lime treatments. By contrast, in the – lime treatments, there was no restriction to soil K availability and there was a grain yield response to P application. At Merredin, the type of lime x P interaction that occurred was dependent on the rate of N applied (data not shown). Where 0 kg N/ha was applied a cross-over interaction occurred; grain yield was higher in the + lime compared to – lime when 0 P was applied and was higher in the –lime when 32 kg P/ha was applied. When 15 kg N/ha was applied, a positive interaction occurred; the yield gap between the P response curves for the +lime and –lime increased as the level of P applied increased. Where 30 and 45 kg N/ha was applied, a negative interaction occurred.
Some important considerations are starting to emerge for making decisions about lime and P fertiliser rate. Soil pH in 10-20 cm appears to be an important factor; a shift from below ~ pH 4.5 to above this level increases yield potential and uptake of soil P. Our measurements of root growth and soil P availability in 2014 suggest that the soil pH x P interaction is being driven by changes to root growth in the subsoil rather than pH-induced changes to soil P. Also, we have observed a significant grain yield response to P fertiliser in our experiments where soil P (Colwell P) in the 0-10 cm layer was above critical ranges. Soil pH appears to be an important factor in the mismatch between predicted and observed response to P fertiliser; the difference between predicted response to P fertiliser and the actual response is greater at low soil pH.
Conclusion
Our work suggests that increasing soil pH can lead to a more efficient use of soil P and reduce level of yield response to P fertiliser. However, we suggest there are two important caveats to this conclusion. Firstly, the supply of all other plant essential nutrients needs to be non-limiting and secondly, the pH increase in the subsurface should be large (>0.5 pH units).
Key words
Phosphorus, soil pH, interaction, lime.
Acknowledgments
Thanks to the following DAFWA staff for their assistance with the field experiments: Shari Dougall, Bruce Thorpe, Rob de Gruci, Daron Malinowski, Adrian Cox, Glen Reithmuller and David Allen.
GRDC Project Number: DAW0022 More Profit from Crop Nutrition: Regional soil testing and nutrient guidelines – West.
References
Reuter, D.J., Edwards, D.G., Wilhelm, N.S., 1997. Temperate Crops, In: Reuter, D.J., Robinson, J.B. (Eds.), Plant Analysis - An Interpretation Manual, Second Edition ed. CSIRO Publishing, Collingwood, Australia, pp. 81-284.
GRDC Project Code: GIA00004,
Was this page helpful?
YOUR FEEDBACK