Why are WA farmers sowing earlier or dry sowing
Author: Andrew Fletcher, CSIRO Agriculture, Floreat WA, Cameron Weeks, Planfarm, Floreat WA, Roger Lawes, CSIRO Agriculture, Floreat WA | Date: 01 Mar 2016
Key messages
There has been a recent trend towards early and dry sowing in WA. Current practice is that 20% of farmers are sowing some crop area before ANZAC day and more than 50% are sowing some crop area dry.
Earlier/dry sowing has been largely driven by the need to establish large cropping programs in a timely manner.
Aims
Sowing date is a key agronomic management decision in a Mediterranean climate, such as in WA. If a crop is sown too early then it may suffer poor establishment, and the risk of frost is increased. If it is sown late then there will be insufficient growth before flowering to achieve high yield and the risk of terminal drought and heat stress during grain filling increases. The optimum sowing date strikes a balance between these factors. However, due to labour and machinery constraints not every crop can be sown on the optimum date and the amount of sowing to be done is an important consideration of when sowing should commence.
Traditionally farmers in WA have delayed sowing until there is sufficient soil moisture to ensure germination and emergence. There has also been a rule of thumb that sowing does not begin before ANZAC day (25 April). This has meant that the cereal crops have generally been sown in mid-May onwards in most locations. However, there is evidence that there has been a recent trend towards earlier and dry sowing. In a survey, Stephens and Lyons (1998) found that WA sowing dates moved earlier by 1.2 day/year between 1977 to 1990 with the final mid-point of sowing being ~27 May. However, there is little information about sowing date trends since then.
Quantifying the range of current sowing dates and industry trends allows targeted research investment, especially the trialling of crop varieties under sowing dates currently used on farm. This paper documents the current sowing dates in WA and quantifies recent trends towards earlier sowing or increased dry sowing. We also identify the location and farm management factors determining sowing date and amount of dry sowing.
Method
We analysed two data sets that quantified sowing date and amount of dry sowing in WA.
Sowing records of seven leading farmers.
Seven leading farmers from across the WA wheat belt interrogated their historical paddock records and provided us the date that they sowed their first cereal crop (wheat or barley). All farmers at least had records from 2007 onwards but a number were considerably longer. Rainfall data from nearby weather stations was used to determine whether the first cereal crop had been sown before or after the break of the season.
Data from industry survey (Planfarm)
Data were taken from four years (2011-2014) of a comprehensive industry survey of between 180 and 217 farmers per year covering all rainfall zones. Questions were asked about: first and last sowing date of the sowing program (2012-2014 only); total area of crop sown wet or dry (all years); and area of each crop sown dry (2012-2014 only). In addition the total crop area per farm was recorded for 2010 farms between 2005 and 2013.
Results
Historical changes in farmer sowing dates
For all seven farmers there was a clear trend towards earlier sowing of the first cereal crop on farm, particularly from 2010 onwards (Figure 1). In many situations, e.g. at Merredin (Figure 1 b), dry sowing before the break of the season has become an increasingly important practice. It is important to note that these data are for cereal (wheat and barley) crops only, and it is likely that lupin or canola crops may have been sown before this.
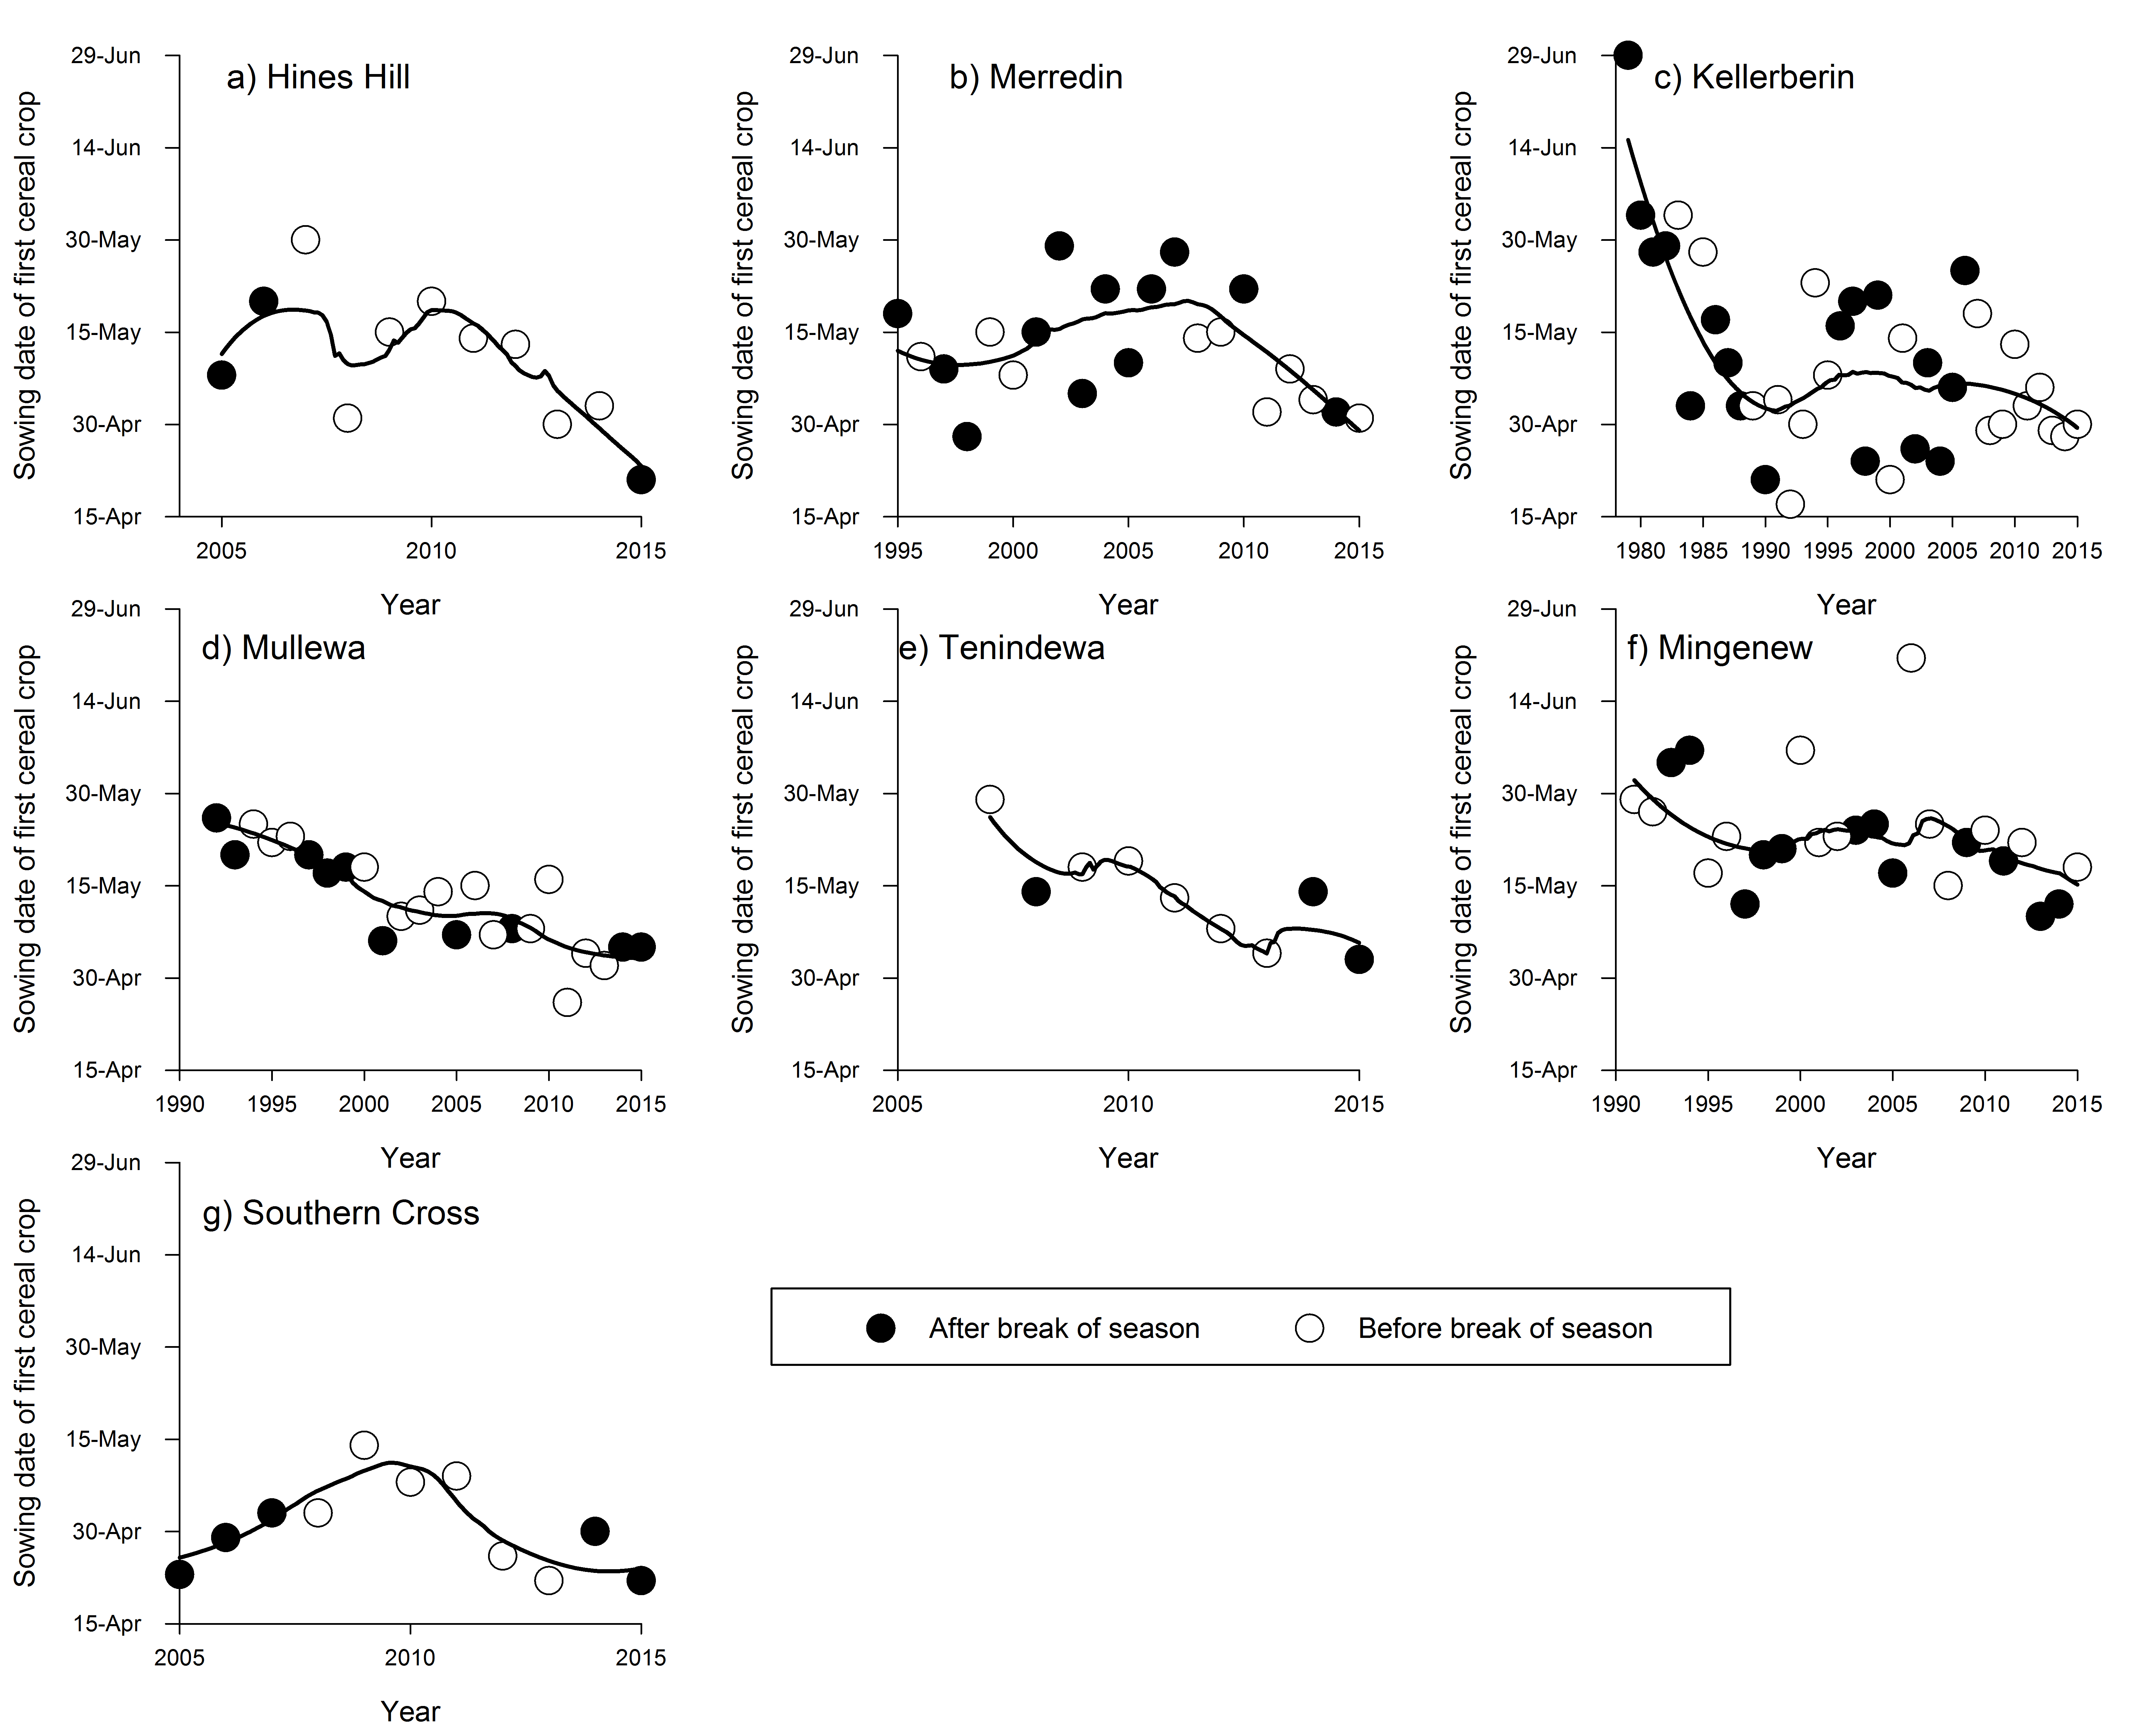
Figure 1. Historical changes in sowing date of first cereal crop for seven leading WA farmers. Solid points are sown after the break of the season and open points are before the break. The solid line is the loess smoothed relationship.
Sowing dates in Planfarm survey
On average across the farms survey and three years of data sowing began on 29 April in the low and medium rainfall zones and 3 May in the high rainfall zones. These dates are largely consistent with the data in Figure 1. However, there was much variation in the beginning and end of sowing in this data set (Figure 2). A large number of farmers began sowing on ANZAC day. However, there were also 20% of farmers who began sowing before this (Figure 2). On average sowing was completed on 2 June in the low rainfall zone, 4 June in the medium rainfall zone and 7 June in the high rainfall zone (Data not shown). Nearly all farmers finished sowing before the 30th June but 90% of farmers finished sowing by 17 June.
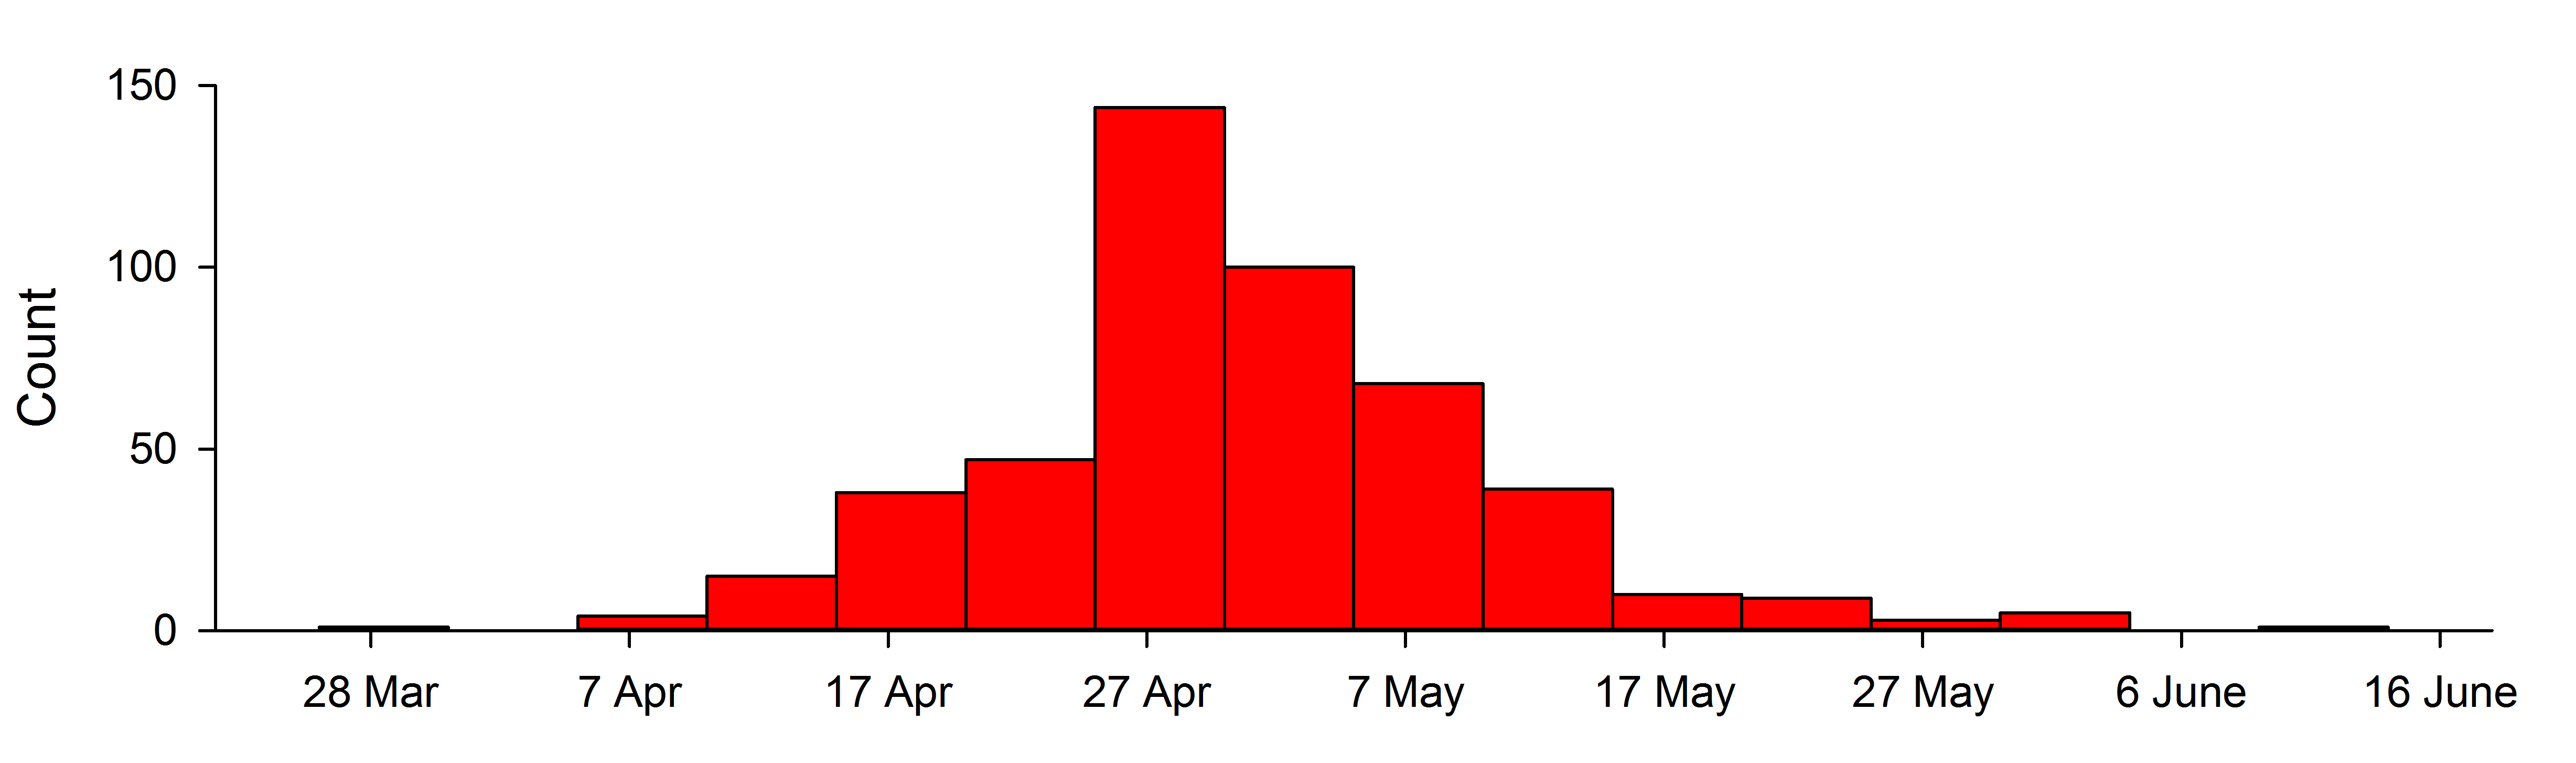
Figure 2. Histogram of first sowing date on farm. Data is combined for rainfall zones and years (2012-2014) (n= 484).
Farmers with larger cropped areas tended to begin sowing earlier (Figure 3). This relationship was consistent regardless of rainfall zone. Over 10 years from 2005 to 2014 mean crop area per farm increased by 164,114 and 65 ha/year for low, medium and high rainfall zones (Data not shown) (R2=0.98, p<0.001). This implies that at least part of the early sowing dates in Figure 1 was driven by increased crop areas.
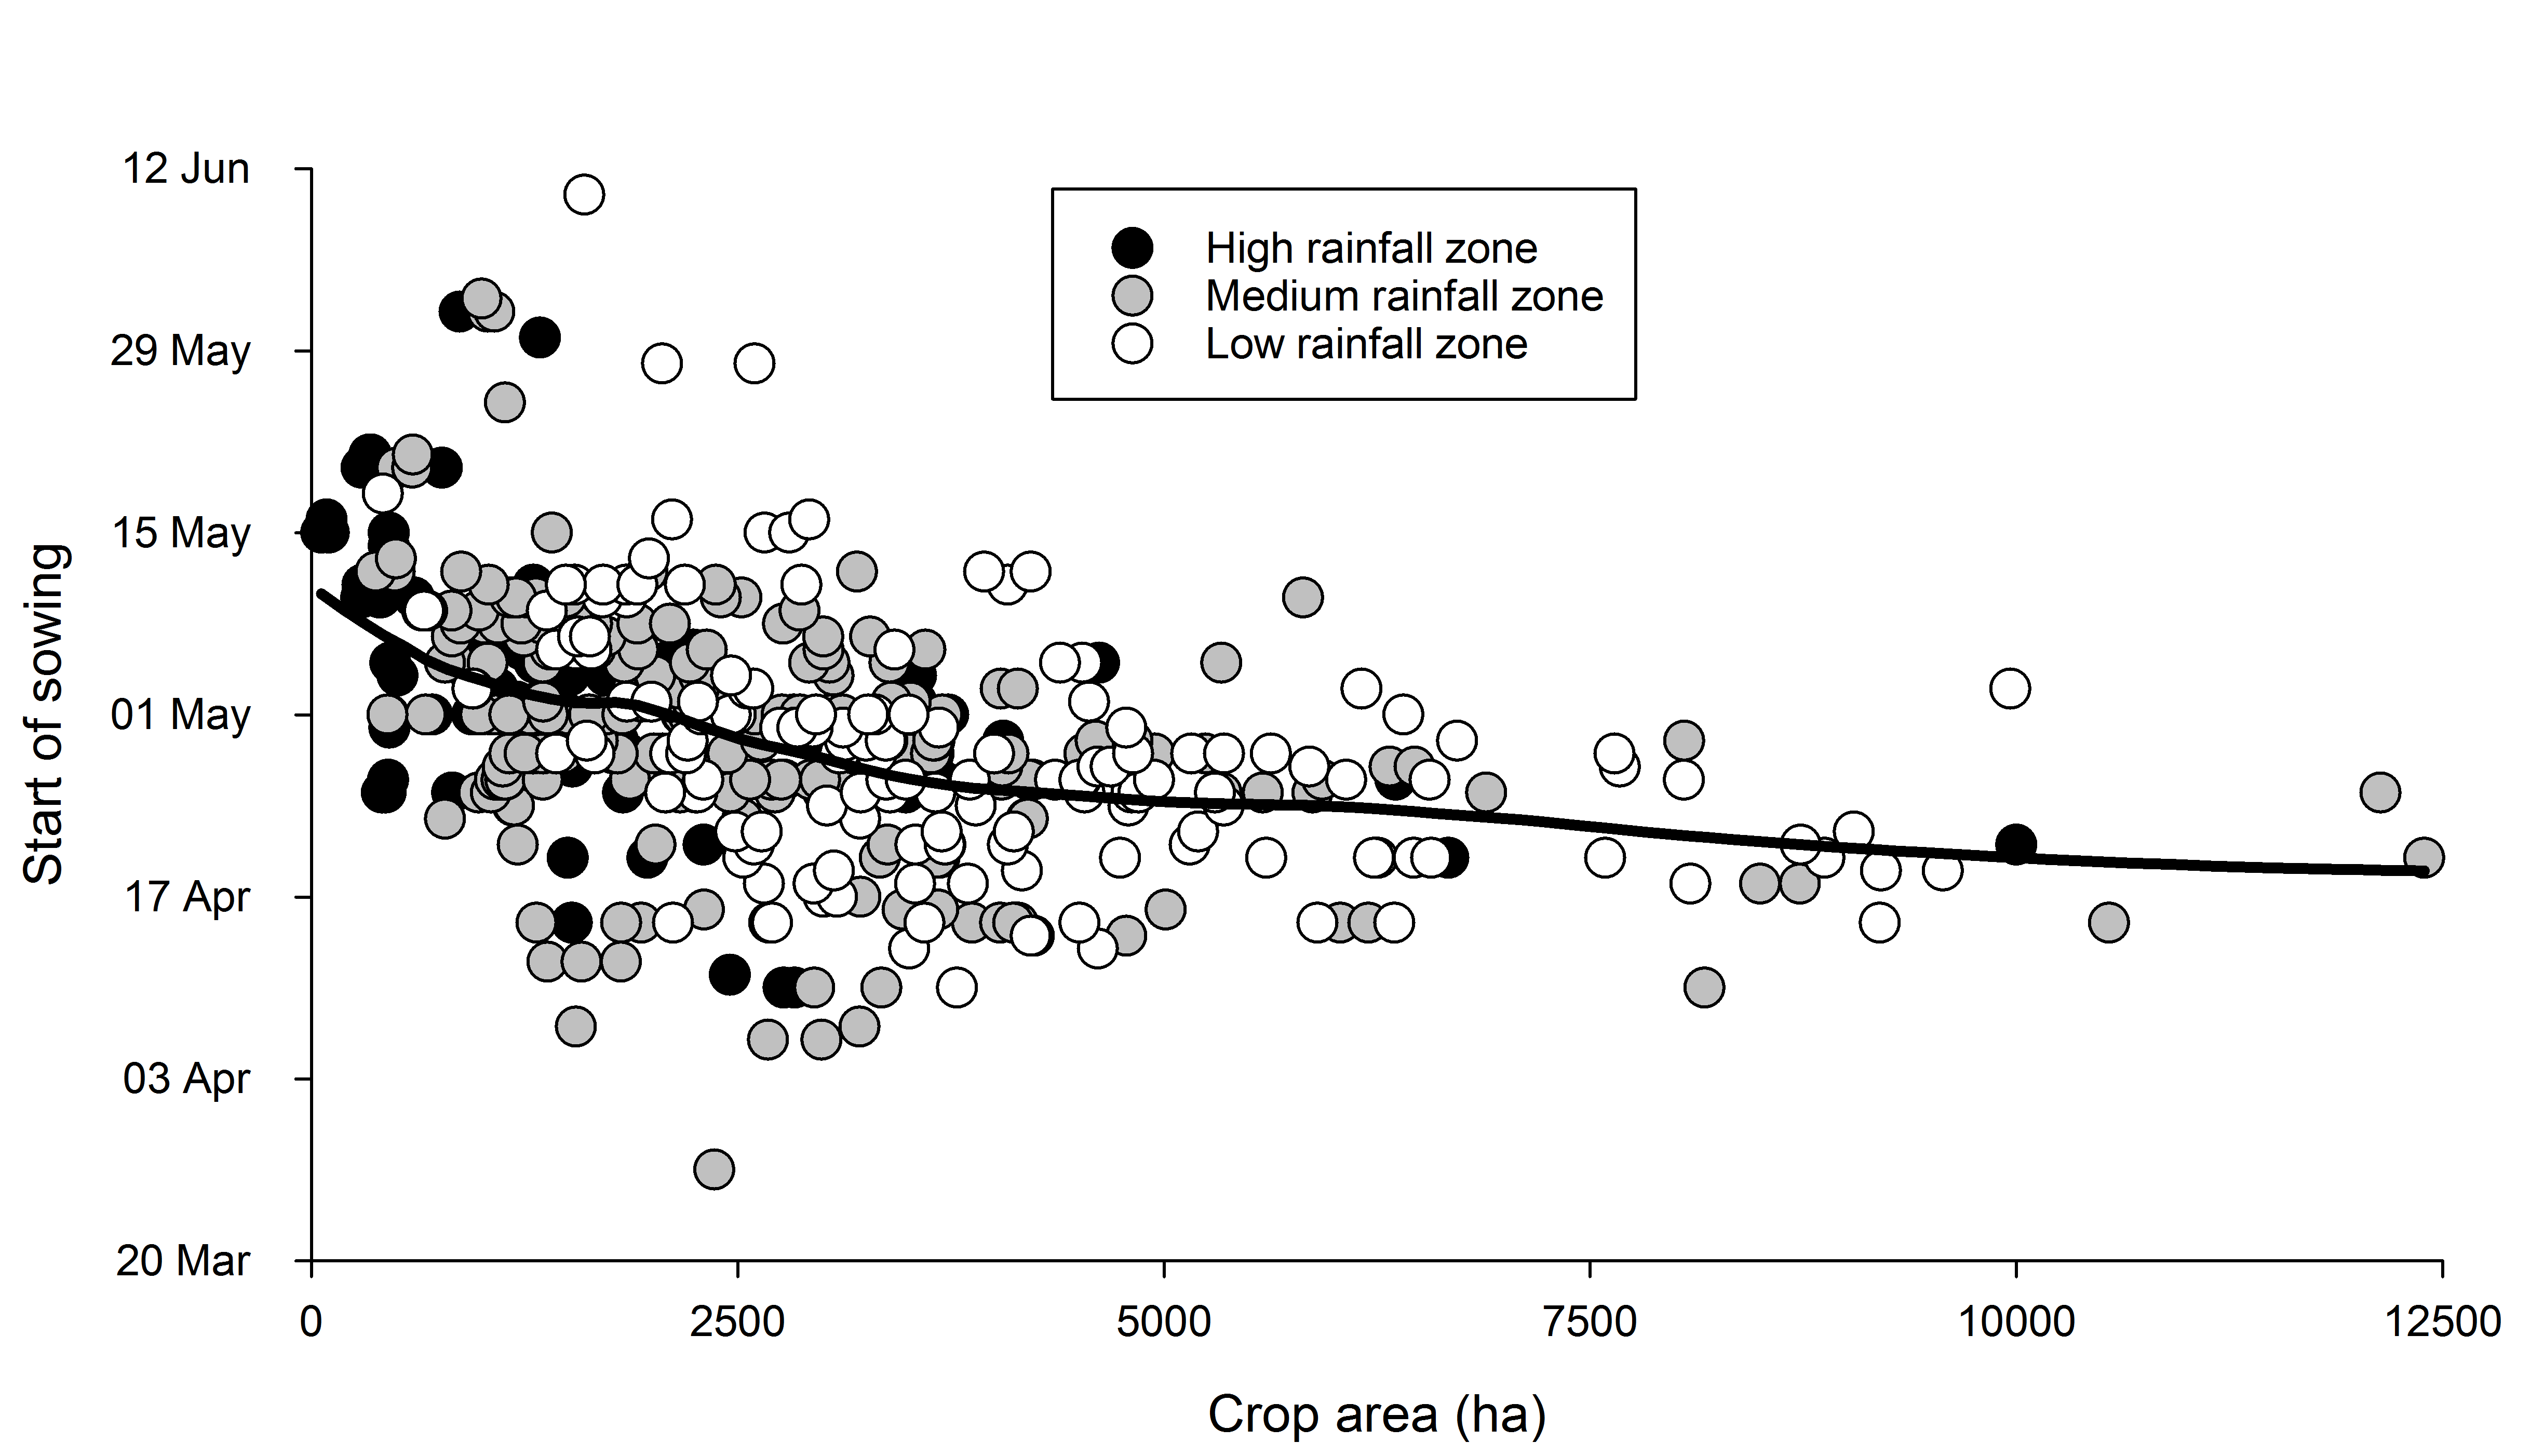
Figure 3. Area of crop and first sowing date for farms across WA (2012- 2014) (n=484). Solid line is the loess smoothed relationship.
Amount of dry sowing in Planfarm survey
More than 50% of farms practised some dry sowing (Tables 1 and 2). Both rainfall zone and season influenced the proportion of farms dry sowing some crop (p<0.001). In the low and medium rainfall zones 54% and 56% of farms undertook some dry sowing, respectively. In contrast only 32% of farms in the high rainfall zone undertook some dry sowing (Table 1). A greater proportion of farmers undertook dry sowing in 2013 and 2014 compared with 2011 and 2012 (Table 2). Farms that dry sowed tended to be larger than those that did not. Mean crop area for farmers that dry sowed some crop was 3290 ha and 2470 ha for those that did not (p<0.001).
Table 1. The effect of rainfall zone on the number of farmers dry or wet sowing. (Data are summed across years 2011-2014)
|
Rainfall zone |
N |
Y |
Total |
Proportion of farms practicing dry sowing |
|
High |
102 |
47 |
149 |
31.5% |
|
Medium |
121 |
153 |
274 |
55.8% |
|
Low |
177 |
205 |
382 |
53.7% |
|
All rainfall zones |
400 |
405 |
805 |
50.3% |
Table 2. The effect of year on the number of farmers dry or wet sowing. (Data are summed across rainfall zones)
|
Year |
N |
Y |
Total |
Proportion of farms practicing dry sowing |
|
2011 |
111 |
87 |
198 |
43.9% |
|
2012 |
132 |
85 |
217 |
39.2% |
|
2013 |
76 |
134 |
210 |
63.8% |
|
2014 |
81 |
99 |
180 |
55.0% |
|
All years |
400 |
405 |
805 |
50.3% |
Of those farmers who undertook some dry sowing the mean proportion of farm sown dry was 24%, although this depended on both rainfall zone and year (Table 3). Farmers in the low rainfall zone tended to have a larger proportion of their crop area dry sown than the medium rainfall zone and both were greater than the high rainfall zone. Farmers also tended to sow a greater proportion of their program dry in 2012 and 2013 than in 2011 and 2014. This was probably due to differences in rainfall patterns across seasons.
Table 3. The effect of year and rainfall zone on predicted mean proportion of farm dry sown (of farmers who dry sowed).
|
Year |
H |
M |
L |
|
2011 |
19 % |
22 % |
26 % |
|
2012 |
27 % |
32 % |
32 % |
|
2013 |
22 % |
25 % |
29 % |
|
2014 |
16 % |
19 % |
22 % |
Farmers tended to dry sow their canola and lupin crops in preference to either barley or wheat (Figure 4). Across the farms surveyed 43% of the canola area and 34% of the lupin area were sown dry. Whereas 16% of the wheat area and 10% of the barley area were sown dry. However, even though there was a lower proportion of wheat crops sown dry, the total area of dry sown wheat exceeded that for canola and lupin combined. This was due to the dominance of wheat in WA. Thus, wheat is the most important dry sown crop in WA.

Figure 3. Area of crop wheat, barley, canola and lupin sown dry or wet from Planfarm survey (data are the mean of 2012, 2013 and 2014).
Conclusion
WA farmers are starting their sowing programs earlier than ever before. This is partly driven by the need to complete longer sowing programs ‘on time’. Dry sowing is widespread and is used to get a head start on sowing programs. Farmers need management techniques to reduce the risks associated with early and dry sowing. In particular wheat varieties need to be tested under early and dry sown situations.
Acknowledgments
We thank the 7 anonymous farmers who provided their sowing records. We also thank GRDC for funding.
GRDC Project Number: WAN00021
Reference
Stephens, DJ, Lyons, TJ (1998) Variability and trends in sowing dates across the Australian wheatbelt. Australian Journal of Agricultural Research 49, 1111-1118.
GRDC Project Code: AGI00004,
Was this page helpful?
YOUR FEEDBACK