Using satellite and drones for water and nitrogen management decision making
Author: John Hornbuckle, James Brinkhoff, Carlos Ballester (Centre for Regional and Rural Futures, Deakin University, Griffith, NSW) and Sam North (NSW DPI, Deniliquin, NSW, 2680). | Date: 27 Jul 2016
Background
In the past 18 months, there has been a significant increase in the use of drones around the world. Major advances in drone technology are being rapidly commercialised and drones are becoming more common. Indeed, Apple stores now offer a range of DJI Phantom drones, which can be purchased alongside your next iPhone! This widespread use and adoption of drones for many applications is driving innovations allowing the collection of high resolution agricultural data across fields for management decisions as well.
Deakin University’s Centre for Regional and Rural Futures (CeRRF) has been investigating the use of these technologies for monitoring crop performance, with a view for using this technology to improve decisions on nitrogen use and water management.
Additionally, new satellite data from the recently launched Sentinel 2 satellite which incorporates a range of bands more suited to monitoring canopy nitrogen content, namely Red edge bands, have become freely available across Australia.
These two rapidly changing monitoring platforms offer the potential for grain growers to gain insights on their crops performance which have previously been unavailable.
Methodology
Drone Data
Figure 1 shows a DJI Inspire drone kitted out with its standard true colour camera at the front and additional multi-spectral and thermal cameras attached. Multi-spectral cameras for use on drones are rapidly decreasing in price, with options such as the Micasense Sequoia (Micasense website) now under the $2500US mark. While much can be done with a standard camera for investigating variability, crop impacts are best picked up with a multi-spectral camera, which can collect data such as Normalised Difference Vegetation Index (NDVI). Cameras, such as the Micasense Sequoia, also can collect Normalised Difference Red Edge (NDRE) data, which have been shown to be particularly useful in monitoring nitrogen in crops, when compared to standard NDVI images (Inoue et al., 2013).
Using drones has become extremely easy with tablet and phone based apps such as Drone Deploy, which automate the flying process. Figure 2 shows Drone Deploy (Drone Deploy website) being used to automate flights over a given field. It is as simple as clicking on field boundaries, setting the flight altitude and the app then takes over the control of drone, selecting the best flight paths to optimise image collection.
Once the drone lands, the captured images are downloaded from the camera, and uploaded to the internet. Cloud (internet) based apps such as Drone Deploy or Micasense Atlas then process the collected images, automatically stitching the multiple images together to provide a single high-resolution image of a whole field, and then automatically providing calibrated vegetation index images to the user. These images can then be shared between farmers and agronomists or other decision makers. Costs for these services are in the range of $30 per month, or can be based off a fee per ha, depending upon what best suits the user.
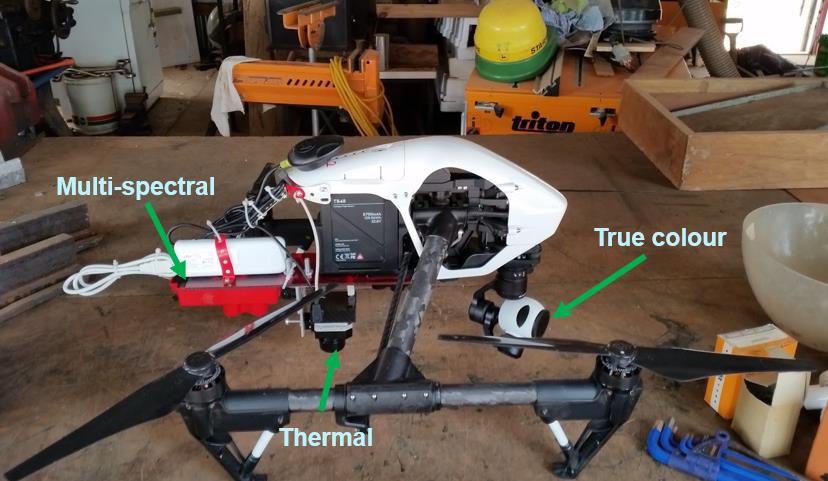
Figure 1: DJI Inspire carrying additional multi-spectral and thermal cameras.
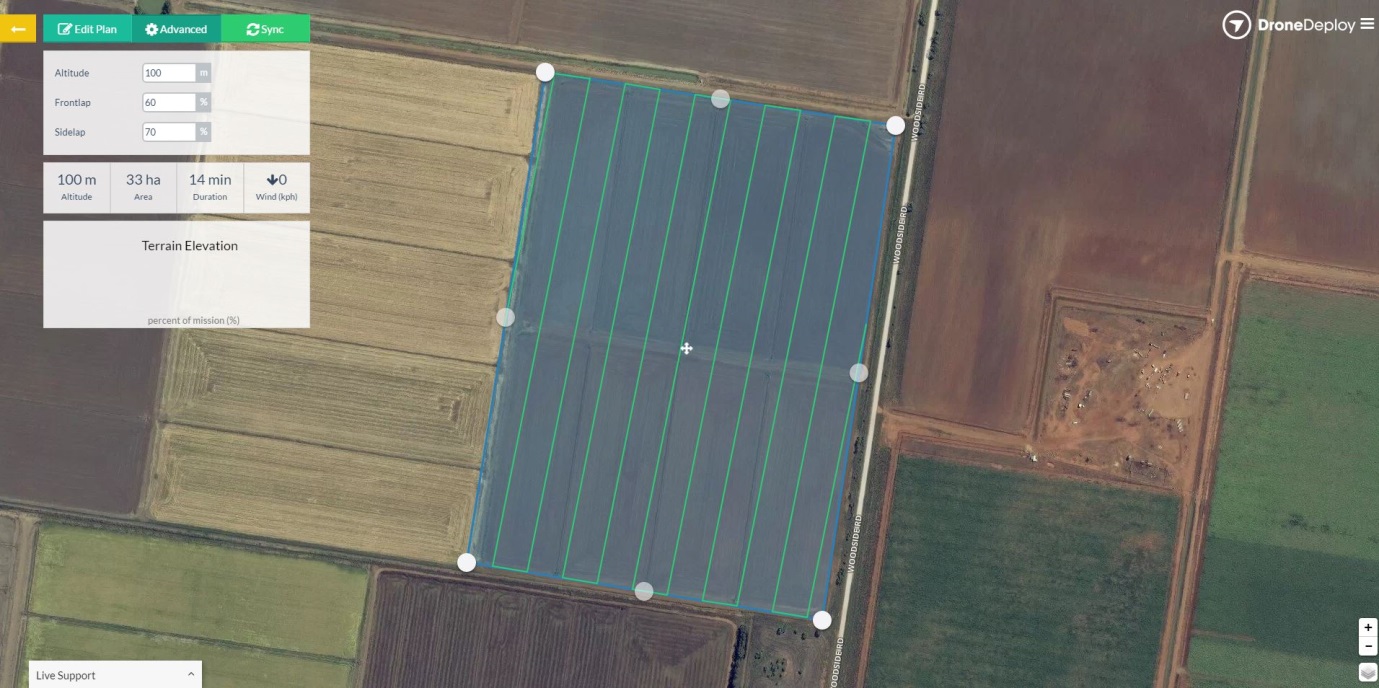
Figure 2: Collecting data is as simple as tracing out your paddock boundaries with apps such as Drone Deploy. The app then takes control of the drone and it flies over the indicated field collecting multiple images. These images are then uploaded to the cloud and the data is automatically processed. The result is high resolution information which can be used to make on-farm decisions.
Satellite Data
IrriSAT is a cloud based app using the Google Earth Engine to provide irrigation management information from remote sensing satellites across large spatial scales. The IrriSAT app automates satellite processing and information delivery of satellite data and provides irrigators with water management information across a range of scales to assist in irrigation scheduling and crop productivity benchmarking. IrriSAT calculates crop coefficients (Kc) from relationships with satellite (Landsat and Sentinel) derived Normalised Difference Vegetation Index (NDVI) data. Daily crop water use is determined by multiplying Kc and daily reference evapotranspiration (ETo) observations from a nearby weather station or ETo grid surfaces. A seven day forecast of ETo can also be used with the satellite data to produce a seven day forecast of crop water use. A beta version of the cloud based app is currently available at IrriSAT website .
The IrriSAT app allows growers to easily access satellite data from both the Sentinel and Landsat platforms at 10m and 30m resolution respectively across Australia free of charge.
Results and discussion
Using drones for decision making on nitrogen management
One of the major advantages of using a low-cost drone platform is the ability to take images when you want. You don’t have to wait for a scheduled plane flight or a satellite overpass. If you want an image before, during or after an irrigation, you have the ability to collect this data on the spot. The second major advantage is the high resolution of these images compared with traditional satellite or plane based platforms. Rather than traditional satellite images, which generally feature tens of metres resolution, drone-based data is generally around 5-10cm, allowing individual plant data to be collected. This has potential benefits for identifying weeds and allows impacts of events such as soil compaction from wet harvests to be seen in collected images. Additionally, cloud cover does not obscure image capture, which is sometimes an issue with satellite imagery.
Figure 3 shows an NDRE image collected from the drone-based platform shown in Figure 1. NDRE has been shown to be strongly related to chlorophyll concentration and therefore to plant nitrogen content. From this image, taken after topdressing, the effects of non-uniform spreading of urea from the spreader can be seen from the striping present in the image. Additionally, NDRE has the potential to be used to track plant nitrogen uptake across the season to see impacts it may have on yield by collecting regular images through the growing season.
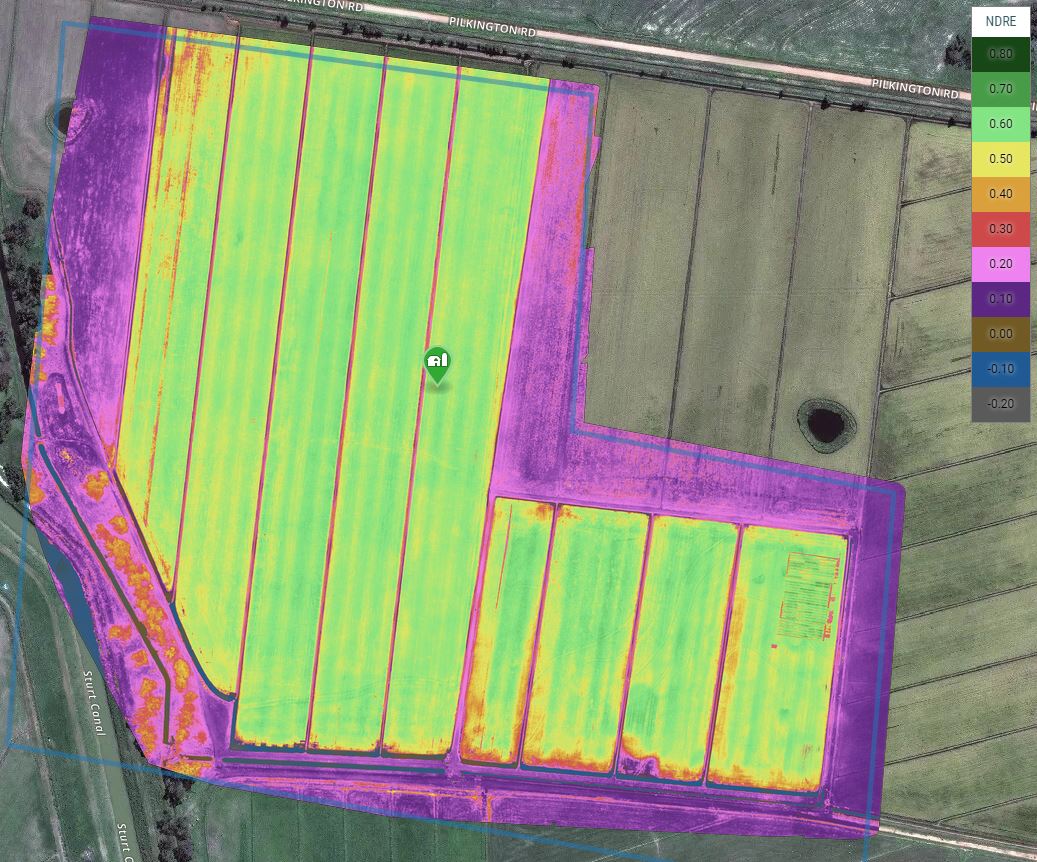
Figure 3: Normalised Difference Red Edge (NDRE) image showing effects of top-dressed nitrogen applied with a spreader. The non-uniform spreading pattern can be seen running across the bays.
Figure 4 shows late season NDVI crop images from the same block in Figure 3. The variable crop maturity across the block and bays can be seen, along with the impact of the variable urea spreading, which is still evident. This variability in maturity will have an effect on final yield and grain quality and can generally be traced back to previous management decisions or effects from fertiliser, layout, soil type and levelling. This variability data can be used to optimise farm management and rectify or address the variability in the future where it is economically viable to do so. Customised management input based on this variability assessment has the potential lead farmers to increase yields and farm profitability. As a side note, the impact of the old contour layout can also be seen in Figure 4, particularly in the lower right of the image. These areas are generally maturing faster. Insights such as these are difficult to see with coarse resolution images such as those from satellites.
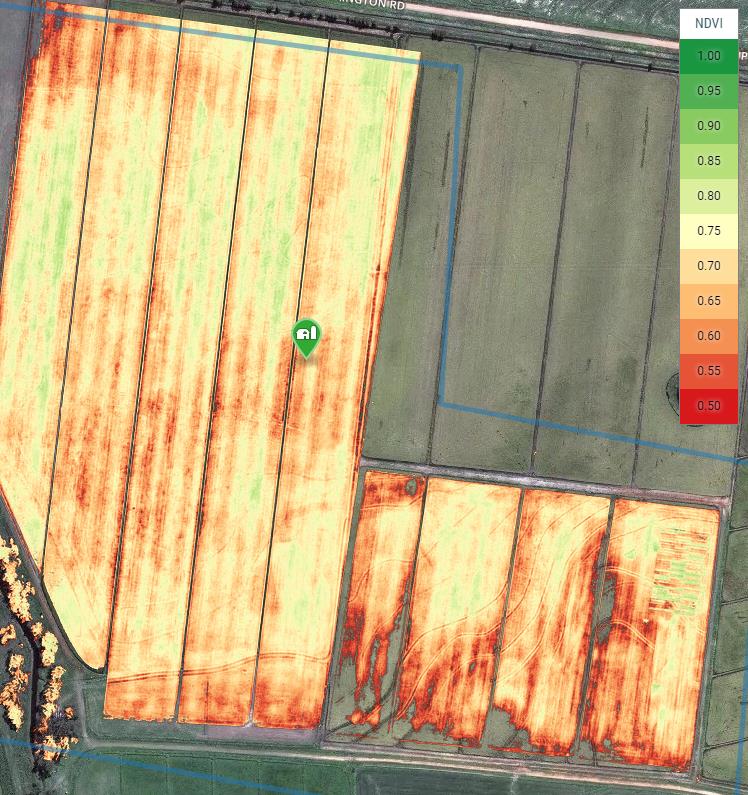
Figure 4: Late season crop NDVI taken from a drone, showing variable crop maturity, and also the effects of old contour layouts.
Using satellite data for water management decisions
Decisions on irrigation scheduling are well suited to courser resolution satellite data as generally irrigation systems in broadacre production systems are not capable of delivering variable water requirements at an individual plant level. A number of authors have found strong relationships between NDVI and crop coefficients for various crops in semi-arid areas. This approach allows NDVI values to be converted to a crop coefficient and hence produce a Kc map across the satellite image which is the approach used in IrriSAT. This allows crop water use maps to be developed across fields when combined with evapotranspiration data.
Reference crop evapotranspiration (ETo) is calculated from observations from a network of automatic weather stations. IrriSAT also allows the option to use gridded ETo surfaces and uses the SILO (Scientific Information for Landowners – Jeffrey et al. 2001) gridded ETo data to provide ETo coverage across Australia.
IrriSAT automatically combines both satellite data and on-ground weather station data and provides this information back to growers through an easy to use cloud based interface. This information is automatically updated daily and provides daily crop water use information to growers which can be used for irrigation scheduling and tracking total crop water use across a growing season (Figure 5).
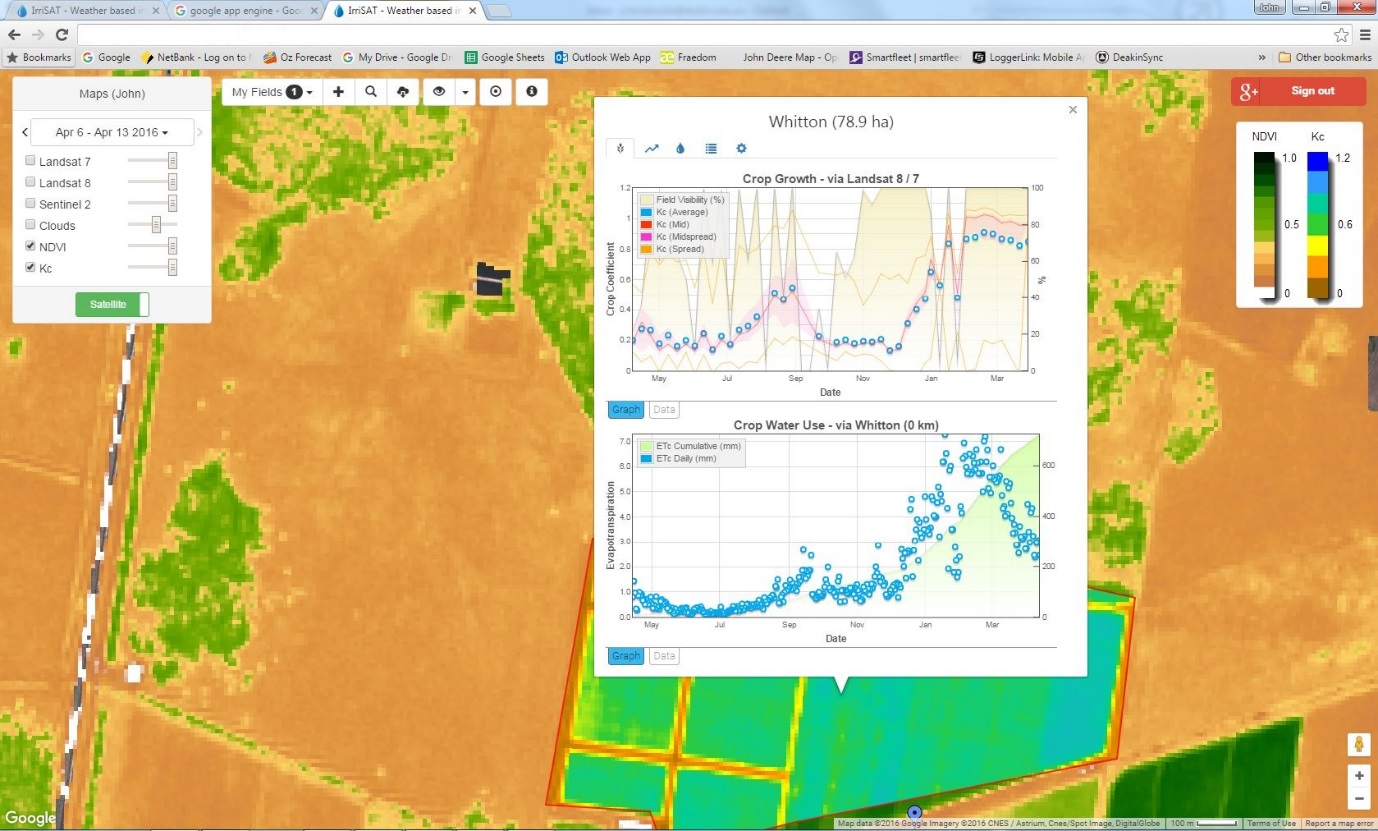
Figure 5: Daily crop water use information for whole field and spatial variability in crop water use being shown in the IrriSAT app cloud based interface.
Additionally, IrriSAT incorporates a seven day global ETo forecast using parameters from Forecast website.This allows a seven day crop water use to also be estimated to assist in planning irrigation activities and tracking when a defined irrigation deficit will be reached (Figure 6).
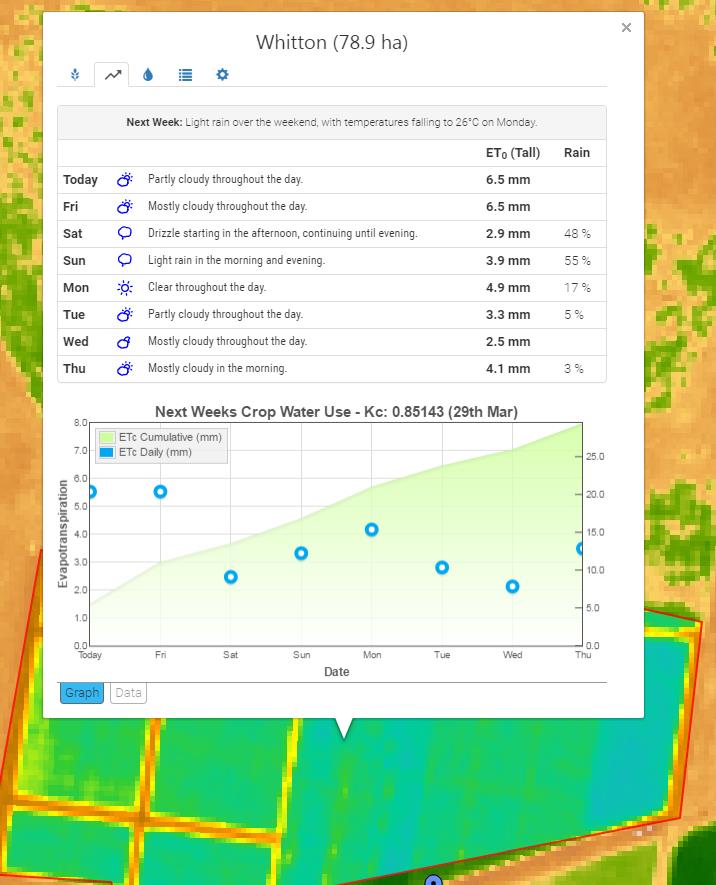
Figure 6: Seven day crop water use forecast available in IrriSAT.
Conclusion
As can be seen, the information collected from drone and satellite based platforms can be used to gain new insights into the effects of water and nitrogen management on plant growth. Strategies can be developed to maximise yields across the farm, based on analysing the best and worst performing areas. The technology is now at a price point that is affordable in the case of drone data and free in the case of satellite data. The automation and simplification of the data collection process on both platforms will allow greater uptake by growers in the coming years.
The IrriSAT app provides easy access to IrriSAT crop water use data, which coupled with weather and crop water use (ETc) forecasts, will enable irrigators to track their soil moisture deficit and better manage irrigation schedules. Spatial crop water use information determined by IrriSAT will allow users to investigate water use differences within and between fields.
For those who would like further information, please contact us. Additionally, consider registering for the Deakin Drone Day to be held by Deakin University in October, where a range of drones, sensors and software will be demonstrated. It will provide hands-on use of a range of drones and sensing platforms and discuss data processing and subsequent decision making.
Useful resources
A quick guide to the use of the cloud based IrriSAT app
Acknowledgements
The research undertaken as part of this project is made possible by the significant contributions of growers through both trial cooperation and the support of the GRDC, the author would like to thank them for their continued support.
Contact details
John HornbuckleCentre for Regional and Rural Futures
Research Station Road, Griffith, NSW, 2680
0429862920
j.hornbuckle@deakin.edu.au
@CeRRF_Griffith
GRDC Project Code: ICF00008,
Was this page helpful?
YOUR FEEDBACK