Does liming affect potassium fertiliser requirements?
Author: James Easton, CSBP | Date: 27 Feb 2017
Key Messages
- Liming does not appear to significantly affect yield response to potassium (K) fertiliser – at least within 5 years of application
- While lime did not alter availability of soil test K, longer term K requirements are likely to increase with ongoing responses to lime and therefore higher nutrient removal rates
- Soil test to ensure optimal allocation of lime and K fertiliser
Aims
Soil acidity is a major constraint to crop production across much of the West Australian grain belt. As a consequence, more than 2 million tonnes of lime are applied annually to increase soil pH.
Potassium (K) deficiencies have become increasingly widespread due to more intensive cropping of higher yielding crops, removal of hay and other crop stubbles containing large amounts of K, and application of lower than removal rates of K fertiliser.
Vast areas of the grain belt also have low soil K reserves.
The aim of this research was to determine whether liming has a significant effect on potassium fertiliser requirements.
Method
A field trial was established on a deep grey sand near Bolgart in 2011. The treatments were 4 rates of potassium (0, 15, 30 and 60 kg/ha), each applied with and without lime sand topdressed at 3.0 t/ha before seeding (Table 1). Potassium treatments were applied as K-Till Extra (15K) banded below the seed or muriate of potash (MoP) (30 and 60K) topdressed before seeding. Where K-Till Extra was not used, Agstar Extra was the seeding fertiliser. To match up nitrogen inputs, Flexi-N was banded at 56 and 50 L/ha to supply 38 kg N at seeding. The trial was a randomised block design with 3 replicates. Wheat was sown with a small plot cone-seeder with knife points on 22cm spacings.
The K fertiliser treatments applied in 2011 were reapplied in 2012, 2013, 2014 and 2016. Lime was reapplied at 2.6 t/ha in 2014. Wheat was sown in 2012, 2013 and 2014. The site was left to volunteer pasture in 2015 and barley was sown in 2016.
Table 1: Lime and potassium fertiliser treatments applied in 2011, 2012, 2013, 2014 and 2016.
2011 + 2014 | 2011, 2012, 2013, 2014, 2016 | Annual | ||
|---|---|---|---|---|
| Lime | Topdressed | Banded | K |
Trt | (t/ha) | (kg/ha) | (kg/ha) | (kg/ha) |
1 | - | - | 120 Agstar Extra | 0 |
2 | - | - | 140 K-Till Extra | 15 |
3 | - | 60 MoP | 120 Agstar Extra | 30 |
4 | - | 120 MoP | 120 Agstar Extra | 60 |
5 | 3.0 + 2.6 | - | 120 Agstar Extra | 0 |
6 | 3.0 + 2.6 | - | 140 K-Till Extra | 15 |
7 | 3.0 + 2.6 | 60 MoP | 120 Agstar Extra | 30 |
8 | 3.0 + 2.6 | 120 MoP | 120 Agstar Extra | 60 |
In the cropping years, Flexi-N was applied post seeding as supplementary nitrogen. Total N supplied to each crop was 76 kg N/ha (in 2011), 59N (2012), 59N (2013), 80N (2014) and 97N (2016).
In 2011, 2012, 2013 and 2016, plant tissue samples were collected between mid-tillering and stem elongation to assess nutrient status and treatment effects.
Each crop was harvested with a small plot header and sampled for grain quality.
In September 2013, ryegrass plants were counted from treatments 1, 4, 5 and 8 to quantify marked effects of lime and K on weed density.
In December 2016, soil pH, Colwell K and exchangeable cations were measured at five depths in the profile (0-10, 10-25, 25-50, 50-75 and 75-100cm) in treatments 1, 4, 5 and 8. Soil samples from 0-10cm were taken from each plot with a pogo stick (20 cores and then bulked) in each replicate. Soil samples from 10-25, 25-50, 50-75 and 75-100cm were taken with a sand auger with three profiles per plot collected and then bulked.
Annual rainfall from 2011 to 2016 ranged from 316 to 660mm (average 443mm) with growing season rainfall (April – October) varying from 243 to 456mm (average 361mm).
Results
Initial soil chemical analysis (2011)
Soil pH was 5.2 at 0-10cm and 4.2-4.3 from 20-40cm (Table 2). Colwell K was 25 mg/kg at 0-10cm and less than 20 mg/kg from 20-40cm.
Table 2: Chemical analysis of soil samples taken March 2011.
Depth (cm) | pH | OC (%) | Colwell P (mg/kg) | PBI | Colwell K (mg/kg) | Ex Ca cmol(+)/kg | Ex Mg cmol (+)/kg | Ex K cmol (+)/kg | Ex Na cmol (+)/kg | ECEC cmol(+)/kg | Ex Al% | Al (mg/kg) |
|---|---|---|---|---|---|---|---|---|---|---|---|---|
0-10 | 5.2 | 1.1 | 12 | 42 | 25 | 2.8 | 0.42 | 0.07 | 0.17 | 3.5 | 2 | 1 |
10-20 | 4.2 | 0.5 | 14 | 38 | 15 | 0.7 | 0.14 | 0.03 | 0.06 | 1.3 | 27 | 7 |
20-30 | 4.2 | 0.3 | 14 | 36 | 17 | 0.3 | 0.07 | 0.03 | 0.02 | 0.8 | 50 | 9 |
30-40 | 4.3 | 0.2 | 8 | 36 | 15 | 0.2 | 0.06 | 0.02 | 0.02 | 0.7 | 51 | 8 |
Grain yield (2011 -2016)
Potassium increased grain yield by 0.9 t/ha in 2011, 1.2 t/ha (2012), 1.4 t/ha (2013), 2.3 t/ha (2014) and 1.1 t/ha (2016) (Table 3). Lime increased yield by 0.14 t/ha in 2012, 0.26 t/ha (2014) and 0.95 t/ha (2016).
There was no significant interaction between lime and K treatments in any year (P<0.05), but in 2012 there was a significant interaction at a lower level of confidence (P<0.1).
Table 3: Grain yield from wheat grown in 2011, 2012, 2013, 2014, and barley in 2016. Lsd (P<0.05).
2011 + 2014 | 2011, 2012, 2013, 2014, 2016 | Annual | Yield (t/ha) | ||||||
|---|---|---|---|---|---|---|---|---|---|
Lime | April | Banded | K | Wheat | Wheat | Wheat | Wheat | Barley | |
Trt | (t/ha) | (kg/ha) | (kg/ha) | (kg/ha) | 2011 | 2012 | 2013 | 2014 | 2016 |
1 | - | - | 120 Agstar Extra | 0 | 1.72 | 1.82 | 1.06 | 1.01 | 3.28 |
2 | - | - | 140 K-Till Extra | 15 | 2.45 | 2.91 | 2.46 | 2.93 | 3.87 |
3 | - | 60 MoP | 120 Agstar Extra | 30 | 2.38 | 3.14 | 1.97 | 3.25 | 4.31 |
4 | - | 120 MoP | 120 Agstar Extra | 60 | 2.72 | 3.30 | 2.44 | 3.19 | 4.40 |
5 | 3.0 + 2.6 | - | 120 Agstar Extra | 0 | 1.86 | 2.28 | 1.23 | 1.16 | 4.28 |
6 | 3.0 + 2.6 | - | 140 K-Till Extra | 15 | 2.49 | 3.05 | 2.49 | 3.16 | 4.85 |
7 | 3.0 + 2.6 | 60 MoP | 120 Agstar Extra | 30 | 2.49 | 3.17 | 2.41 | 3.45 | 5.07 |
8 | 3.0 + 2.6 | 120 MoP | 120 Agstar Extra | 60 | 2.61 | 3.21 | 2.67 | 3.61 | 5.44 |
Lsd K | 0.16*** | 0.16*** | 0.25*** | 0.11*** | 0.26*** | ||||
Lsd Lime | ns | 0.11* | ns | 0.08*** | 0.18*** | ||||
Lsd K * Lime | ns | ns | ns | ns | ns | ||||
Grain quality (data not shown).
In each crop, K significantly increased hectolitre weights and reduced screenings.
Without K in 2011, 2013 and 2014, low hectolitre weights and high screenings would have resulted in the wheat being downgraded to GP1.
Lime increased hectolitre weights and reduced screenings in 2012 and 2016.
K uptake
Plant tests in 2011, 2012 and 2013 showed no significant effect of lime on K uptake.
However, in 2016, plant tests at 44 days after sowing showed that K uptake was significantly increased by the application of lime (P<0.01) (Figure 1). There was no significant interaction between lime and K.
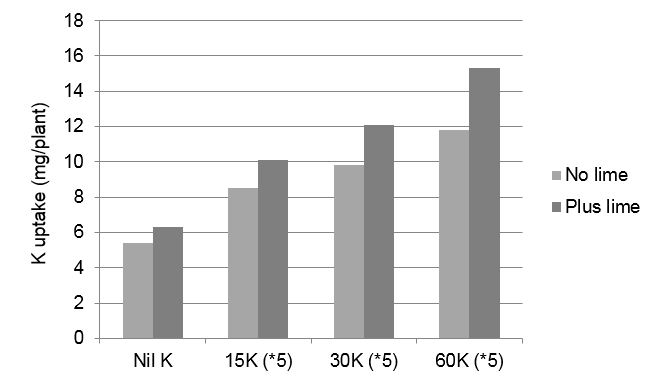
Figure 1: Potassium uptake by barley in 2016 (44 days after sowing). Lsd (5%) for all treatments is 3.0mg K/plant.
Soil chemical analysis (December 2016)
The application of 120 kg/ha MoP in 2011, 2012, 2013, 2014 and 2016 increased Colwell K to 75-100cm depth (Figure 2). There was some indication of K leaching to 50-75 cm depth in K fertilised plots.
There did not appear to be a significant effect of lime application on Colwell K down the soil profile.
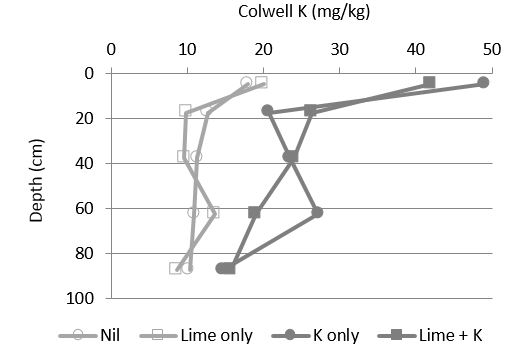
Figure 2: The effect of the application of 60 kg K/ha MoP (120 kg/ha MoP) in 2011, 2012, 2013, 2014 and 2016 on Colwell K (with and without lime applied in 2011 and 2014).
Ryegrass (2013)
In 2013, large effects of K supply on the ryegrass population were observed. The application of 120 kg/ha MoP in 2011, 2012 and 2013 reduced the ryegrass population by 60% (Figure 3). There was a small reduction in ryegrass population from lime but this was not statistically significant.
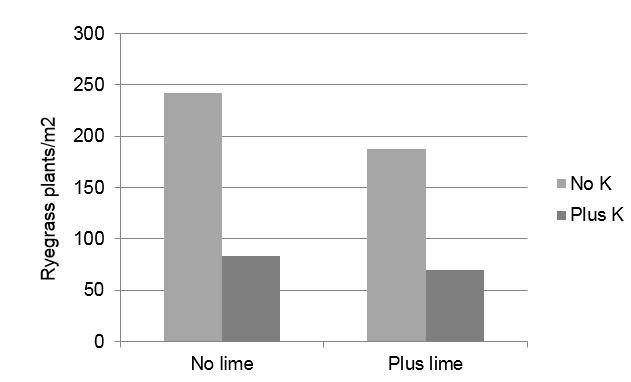
Figure 3: Ryegrass population assessed 26 September 2013 showing the effects of 3.0 t/ha lime applied in 2011 and 120 kg/ha MoP applied in 2011, 2012 and 2013. Lsd (5%) for K treatment is 60 plants/m2.
Conclusions
In the first four years of this trial, annual K fertiliser applications had a much greater effect on wheat grain yield than the application of lime. However, in the last two crops, yields were highest where lime was also applied.
In 2012, there appeared to be a greater response to lime where K was not applied. This indicates that lime may have improved access to soil K but this was not supported by plant test results in 2012, or repeated in any of the other years. In two other field experiments (Cascade and Coorow: data not shown) there was also no effect of lime on K response. Therefore there is no evidence that lime can replace K fertiliser inputs if the soil is K deficient. If the soil test indicates both low pH and low K, then both lime and K fertiliser are needed.
To realise the higher yield potential of limed plots in 2014 and 2016, high annual K fertiliser inputs were required.
Continued yield responses to lime will increase K removal rates and probably longer term K fertiliser requirements.
Soil analysis indicates a high residual K value on this soil type with most of the K applied being retained in the top 100cm, despite rainfall in 2016 that was 200 mm above the long term average.
The effect of crop response to K on reducing the ryegrass population highlights the importance of adequate crop nutrition to integrated weed management.
Acknowledgments
Robbie and Jule Burt (Host Farmers), Ryan Guthrie, Callen Syred, Cara Allan and Boston Whooley (all CSBP), Dean Diepeevan (DAFWA/Murdoch University - biometrician).
Paper reviewed by: Professor Richard Bell (Murdoch University)
Was this page helpful?
YOUR FEEDBACK