Influence of nitrogen and seed rate on the performance of plump grain barley varieties in lower rainfall areas (2005-2007)
Author: Blakely Paynter and Andrea Hills, Department of Agriculture and Food Western Australia | Date: 28 Feb 2017
Key messages
- Increasing the plant density (by increasing the seed rate) above 150 plants/m2 decreased return ($/ha) in this study, with no difference in return ($/ha) for target densities between 75 and 150 plants/m2.
- The three varieties sown, Hamelin, Stirling and Vlamingh, had similar responses to increasing seed rate, applied N and delayed seeding. The same target plant density would be suggested if they were still received and segregated for a malt end use.
- The optimum plant density for grain yield was not correlated with the site mean yield and was slightly higher but not largely changed with delayed seeding, similar to the observations of Paynter et al. (2016c).
- There was no evidence in this study in lower rainfall zones to suggest that the target plant density decreases as N supply increases, unlike Paynter et al. (2016a).
Aims
The aim of variety specific agronomy is to identify weaknesses and strengths of new malting varieties, benchmark these against established malt varieties and provide management options which maximise grain yield and delivery as malt. Barley seeding rates require a balance between sowing the appropriate number of plants to maximise grain yield but not too many that it results in the downgrading of malt barley to feed barley due to grain defects.
Paynter (2016) and Paynter et al. (2016a, 2016b, 2016c) reported on recent studies examining the influence of increasing seed rate, therefore increasing plant density, on agronomic performance, grain yield, grain quality and economic returns from growing barley. Those studies concluded that in environments with a yield potential above 1.5t/ha the target density for barley was between 110 to 180 plants/m2, varied according to the variety of malt barley being grown, did not change if the seeding date was delayed and decreased as nitrogen supply increased.
As the previous studies of Paynter (2016) and Paynter et al. (2016a, 2016b, 2016c) were largely conducted in medium to higher rainfall areas the questions remain – what happens in lower rainfall environments? This study reports the variation in plant height, grain yield and grain quality of three two-row malting barley varieties from a series of thirteen seeding rate experiments sown in lower rainfall parts of the Western Australian wheatbelt during the seasons of 2005, 2006 and 2007. The aim of this study was to determine firstly how date of seeding and nitrogen influence the response to increasing plant density and secondly the target density for malt barley in lower rainfall environments.
Table 1. Details for the thirteen barley agronomy time of sowing by nitrogen by seed rate experiments.
|
Trial number
|
Location
|
1st sowing date (date) |
2nd sowing date (date) |
May-Oct rainfall (mm) |
Soil pHCa (0-10cm) |
Organic C (%, 0-10cm) |
Soil type
|
|---|---|---|---|---|---|---|---|
|
05NO14 WH_1 |
Cadoux |
28-May-05 |
16-Jun-05 |
215 |
4.7 |
1.27 |
brown sandy earth |
|
05NO14 ME_1 |
Merredin |
12-May-05 |
26-May-05 |
240 |
5.1 |
1.61 |
yellow loamy earth |
|
05NO14 CG_1 |
Corrigin |
25-May-05 |
14-Jun-05 |
290 |
5.0 |
1.28 |
alkaline grey shallow loamy duplex |
|
05ES07 NE_1 |
Newdegate |
26-May-05 |
15-Jun-05 |
300 |
4.7 |
0.99 |
grey deep sandy duplex |
|
05ES07 SG_1 |
Salmon Gums |
30-May-05 |
14-Jun-05 |
233 |
7.6 |
0.42 |
red-brown non-cracking clay |
|
06NO10 WH_1 |
Cadoux |
23-May-06 |
22-Jun-06 |
177 |
5.0 |
1.17 |
alkaline grey shallow loamy duplex |
|
06NO10 ME_1 |
Merredin |
22-May-06 |
28-Jun-06 |
194 |
5.2 |
1.29 |
red-brown non-cracking clay |
|
06NO10 CG_1 |
Corrigin |
29-Jun-06 |
20-Jul-06 |
206 |
5.0 |
1.09 |
alkaline grey shallow sandy duplex |
|
06ES12 NE_1 |
Newdegate |
25-Jun-06 |
11-Jul-06 |
157 |
4.4 |
1.32 |
grey shallow sandy duplex |
|
06ES12 ES_1 |
Salmon Gums |
12-May-06 |
14-Jun-06 |
115 |
5.1 |
0.87 |
brown shallow sandy duplex |
|
07NO05 WH_1 |
Cadoux |
29-May-07 |
21-Jun-07 |
174 |
4.7 |
0.93 |
yellow-brown shallow sandy duplex |
|
07NO05 CG_1 |
Corrigin |
29-May-07 |
16-Jun-07 |
248 |
5.1 |
1.35 |
alkaline brown shallow sandy duplex |
|
07ES10 ES_1 |
Grass Patch |
22-May-07 |
12-Jun-07 |
155 |
6.2 |
1.21 |
red-brown shallow loamy duplex |
Method
Three two-row, spring malting barley varieties (Hamelin, Stirling and Vlamingh) were sown in a randomised split block design with two dates of planting (targeting three to four weeks apart) as the main plot and two rates of applied nitrogen (N) (20 and 60 kg N/ha, 20N and 60N) and three seeding rates (75, 150 and 300 plants/m2) randomised within varieties as the sub-plots. Each trial was sown over three replicates in two banks at thirteen sites from 2005-2007 (Table 1).
Each site was sprayed with a knockdown herbicide before seeding and direct-drilled into canola, barley or wheat stubble with a small plot air-seeder using knife points and on-row packing (press wheels). 1000 kernel weight for each variety was used to determine the weight of barley seed required to establish a target density of 75, 150 or 300 plants/m2. Each plot was 20m long, with seed being sown at 2-4cm depth over six rows at Grass Patch (24cm row spacing), Newdegate (25cm) and Salmon Gums (24cm) and eight rows at Cadoux (18cm), Corrigin (18cm) and Merredin (23cm). An NPK compound fertiliser was banded below the seed at 150kg/ha, supplying 20 kg N/ha, 17 kg P/ha and 6 kg K/ha. 60N treatments received an additional 40 kg N/ha (top dressed as urea) at mid tillering (4-6 weeks after sowing, WAS). Post-seeding herbicides were used to control grass and broadleaf weeds as required. Leaf diseases were controlled as required.
Barley establishment counts were recorded at 2-3 WAS. Plant height (cm to base of ear) and lodging scores (from 9, no lodging, to 0, completely lodged and effectively un-harvestable) were recorded close to harvest. Grain yields were recorded at harvest and cleaned (>1.5mm) samples were used to determine grain quality including 1000 kernel weight (mg, db), hectolitre weight (kg/hL), screenings (%<2.5 mm), grain protein concentration (%, db by NIR), grain brightness (‘L*’ by NIR) and grain hardness (SKCS units by NIR).
Data was analysed within Genstat (VSN International 2013) with a treatment design of 2 times of sowing (TOS) x 3 varieties x 2 N rate x 3 seed rate, a block structure of rep/TOS/variety/(N rate.seed rate) and treatment structure as TOS*variety*N rate*seed rate. The optimum plant population for grain yield was calculated for each time of sowing by N rate combination site (averaged across varieties) as per Paynter (2016) with the point of inflection at 1.5kg/ha of grain for each extra established plant/m2.
Results
Plant height, lodging and grain yield
Seeding dates for the first time of sowing were typically in mid to late May (except Corrigin and Newdegate in 2006), followed three to four weeks later with the second time of sowing (Table 1).
Establishment varied across sites averaging 71±2 plants/m2 for the 75 plants/m2 seed rate treatment, 127±4 plants/m2 for the 150 plants/m2 seed rate treatment and 210±8 plants/m2 for the 300 plants/m2 seed rate treatment (Figure 1). The average establishment over the 13 trials of the 150 and 300 plants/m2 seed rate treatments was lower than expected due to poor establishment of the crop in 2005. The average establishment in 2005 was 60±2 plants/m2, 99±3 plants/m2 and 151±6 plants/m2 respectively for the 75, 150 and 300 plants/m2 seed rate treatments versus 77±2 plants/m2, 145±3 plants/m2 and 247±6 plants/m2 for 2006 and 2007. In 50% of trials establishment varied slightly with variety and with seeding date, being higher in three trials at the first date of seeding, lower in four and the same in the rest.
Seed rate (plant density) was the only treatment that regularly influenced plant height (Table 2), with a decrease of about 3cm between the lowest and highest density in straw height to the base of the ear. Applied N occasionally influenced plant height, increasing it by 2cm where significant.
Variety was the main treatment that influenced straw strength (lodging), with Vlamingh having better straw strength than Hamelin and Stirling. The latter two varieties being similar to each other. In 50% of the trials there was a slight reduction in straw strength with increased N.
Delayed sowing decreased grain yield (2.10 versus 1.72 t/ha averaged across sites), but the difference in grain yield between the first and second date of seeding was only significant in five of the 13 sites. Varieties differed in their grain yield at 50% of sites. At sites where varietal differences were significant, Vlamingh did better than Hamelin and Stirling if the site potential was above 2.5t/ha and poorer than Hamelin and Stirling if the site potential was below 2.5t/ha (data not shown).
Applied N consistently influenced grain yield, with the three varieties responding similar to increasing N (Table 2). On average there was a 5±3% increase in grain yield when N was increased from 20 to 60 kg N/ha; with two sites showing a negative response (average decrease of 6±2%); two sites showing no response; and the other nine a positive increase (average increase of 10±3%) to N (data not shown). In 50% of trials the response to N was influenced by date of seeding, with the response to N generally larger with the first date of seeding than the second (average increase of 8% versus 3% respectively).
Seed rate consistently influenced grain yield (Figure 1). The three varieties responded similarly to increasing plant density (Table 2). On average there was a 5±1% increase in grain yield from increasing the target density from 75 plants/m2 to between 150 to 300 plants/m2. At only two sites was the yield for the 300 plants/m2 seed rate treatment lower than the 75 plants/m2 seed rate treatment, by 4% at Cadoux 2006 and 6% at Newdegate 2006 (or by 0.07 and 0.06 t/ha respectively). At the other 11 sites, the yield of the 300 plants/m2 seed treatment was above the yield of the 75 plants/m2 treatment at eight sites and the same at three. At the eight sites where there was a yield advantage with the highest density, the yield improvement was 8±2% compared to the 75 plants/m2 treatment. The increase in grain yield with increasing seed rate was only occasionally different at the first date than at the second date of seeding.
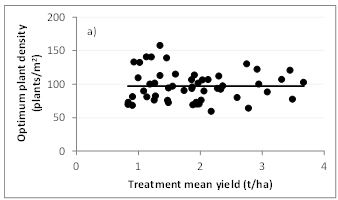
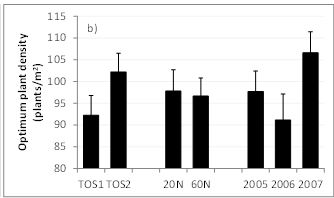
The optimum plant density for grain yield averaged 97±3 plants/m2 and was not correlated to grain yield (Figure 2). Across sites the optimum plant density varied slightly with season and with delayed seeding, but not with changes in N applied.
Table 2. Likelihood of time of sowing, N rate, seeding rate and their interaction being significant (p<0.05) on plant growth traits across thirteen trials. Significance: rarely = occurred in ≤20% trials, occasionally = 20-40% trials, 50% chance = 40-60% trials, often = 60-80% trials and consistently = ≥80% trials significant.
|
Trait |
Barley density |
Plant height |
Lodging |
Grain yield |
Grain yield |
|---|---|---|---|---|---|
|
Source |
(plants/m2) |
(cm, ear base) |
(9-0) |
(t/ha) |
(% 20N and 75 plans/m2) |
|
TOS (T) |
50% chance |
occasionally |
occasionally |
occasionally |
rarely |
|
Variety (V) |
50% chance |
occasionally |
often |
50% chance |
occasionally |
|
T x V |
occasionally |
occasionally |
occasionally |
occasionally |
occasionally |
|
N rate (N) |
rarely |
occasionally |
50% chance |
consistently |
consistently |
|
Seed rate (SR) |
consistently |
often |
occasionally |
consistently |
consistently |
|
T x N |
rarely |
occasionally |
occasionally |
50% chance |
50% chance |
|
V x N |
rarely |
rarely |
rarely |
rarely |
rarely |
|
T x SR |
often |
occasionally |
rarely |
occasionally |
50% chance |
|
V x SR |
occasionally |
rarely |
rarely |
rarely |
rarely |
|
N x SR |
rarely |
rarely |
occasionally |
rarely |
rarely |
|
T x V x N |
rarely |
rarely |
rarely |
rarely |
rarely |
|
T x V x SR |
rarely |
rarely |
occasionally |
rarely |
rarely |
|
T x N x SR |
rarely |
rarely |
rarely |
rarely |
rarely |
|
V x N x SR |
rarely |
rarely |
rarely |
rarely |
rarely |
|
T x V x N x SR |
rarely |
rarely |
rarely |
rarely |
rarely |
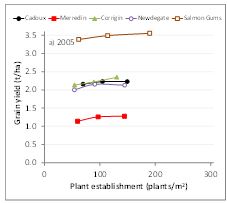
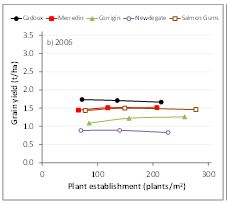
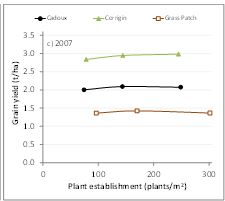
Figure 1. Grain yield response to increasing barley establishment density in a) 2005, b) 2006 and c) 2007.
Grain quality
Varietal differences in grain quality were observed in at least two out of every three trials (Table 3), but the ranking of varieties varied across sites. In 50% of trials the grain of the later sown barley had a lower hectolitre weight, higher screenings, higher grain protein, was brighter and harder than the grain of the barley sown three to four weeks earlier. The change in grain quality with delayed seeding was not influenced by variety.
Applied N influenced grain quality in at least two out of every three trials except for grain hardness (Table 3). The three varieties responded similar to increasing N (Table 3). On average there was a 0.9mg decrease in kernel weight, 0.6kg/hL decrease in hectolitre weight, 4% increase in screenings, 1.5% increase in grain protein, a <0.5“L*” decrease in grain brightness and a slight increase in grain hardness across sites when N was increased from 20 to 60 kg N/ha. Screenings was the only grain quality trait whose increase due to applied N was likely to be influenced by date of seeding. At sites where there was an interaction, the increase in screenings due to N was slightly larger at the second date of seeding than the first.
Seed rate influenced grain quality, with the three varieties responding similarly to increasing plant density (Table 2). On average increasing plant density decreased kernel weight (<2mg) and hectolitre weight (<1kg/hL), increased screenings (<5%), decreased grain protein (<1%) and slightly decreased grain brightness (<0.5‘L*’) with little effect on grain hardness. The change in grain quality was only occasionally influenced by when the crop was sown.
Table 3. Likelihood of time of sowing, N rate, seeding rate and their interaction being significant (p<0.05) on grain quality traits across thirteen trials. Significance: rarely = occurred in ≤20% trials, occasionally = 20-40% trials, 50% chance = 40-60% trials, often = 60-80% trials and consistently = ≥80% trials significant.
|
Trait Source |
Kernel weight (mg, db) |
Hectolitre weight (kg/hL) |
Screenings (% < 2.5 mm) |
Grain brightness ('L*') |
Grain protein (%, db) |
Grain hardness (SKCS units) |
Return ($/ha) |
|---|---|---|---|---|---|---|---|
|
TOS (T) |
occasionally |
occasionally |
often |
50% chance |
50% chance |
occasionally |
occasionally |
|
Variety (V) |
often |
often |
often |
Often |
consistently |
consistently |
occasionally |
|
T x V |
50% chance |
occasionally |
occasionally |
Occasionally |
occasionally |
occasionally |
occasionally |
|
N rate (N) |
consistently |
often |
consistently |
Consistently |
often |
50% chance |
consistently |
|
Seed rate (SR) |
consistently |
50% chance |
often |
Often |
50% chance |
rarely |
consistently |
|
T x N |
occasionally |
rarely |
50% chance |
Occasionally |
rarely |
rarely |
often |
|
V x N |
occasionally |
occasionally |
occasionally |
Occasionally |
rarely |
rarely |
rarely |
|
T x SR |
occasionally |
occasionally |
occasionally |
Rarely |
rarely |
rarely |
occasionally |
|
V x SR |
50% chance |
rarely |
occasionally |
Rarely |
rarely |
rarely |
rarely |
|
N x SR |
rarely |
rarely |
rarely |
Rarely |
rarely |
rarely |
rarely |
|
T x V x N |
rarely |
rarely |
rarely |
Rarely |
rarely |
rarely |
rarely |
|
T x V x SR |
rarely |
rarely |
rarely |
Rarely |
rarely |
rarely |
rarely |
|
T x N x SR |
occasionally |
rarely |
rarely |
Rarely |
rarely |
rarely |
rarely |
|
V x N x SR |
rarely |
rarely |
rarely |
Rarely |
rarely |
rarely |
rarely |
|
T x V x N x SR |
rarely |
rarely |
rarely |
Rarely |
rarely |
rarely |
rarely |
Economics of changes in crop management
An economic analysis calculating return (yield by price minus costs) was done for each time of sowing, variety, N rate, seed rate and site, using the assumptions in Table 4 and the 2016/17 GIWA Barley receival standards for Western Australia. The per cent of replicate samples meeting BFED1 receival specifications and average return ($/ha) across all 13 sites is presented in Figure 3 for each time of sowing, rate of applied N, seed rate, variety and season averaged across sites and Figure 4 for response to seed rate averaged across times of sowing, varieties and rates of applied N. It should be noted that these trials were not designed to determine the optimum N or plant density for each variety. The treatments chosen were designed to facilitate the discrimination of varietal performance rather than be economic rates of N application and seed rate. Operating costs do not take into account differences in disease control that may be required and the analysis assumes all varieties can be delivered to the same bin. On average (across all replicate samples), 30% of samples met Malt1, 13% of samples Malt2 and 57% of samples were downgraded to feed. Across years, 63% of samples were received as malt (Malt1 + Malt2) in 2005, only 20% in 2006 and 52% in 2007 (Figure 3).
Table 4. Assumptions used in the economic analysis of the thirteen agronomy trials.
|
Indicative cash price ($/t)
|
EPR ($/t) [malt/feed]
|
1000 seed weight (g)
|
Seed rate (kg/ha) to achieve
|
|||||
|---|---|---|---|---|---|---|---|---|
|
Variety
|
Malt 1
|
Malt 2
|
Feed
|
75 plants/m2
|
150 plants/m2
|
300 plants/m2
|
||
|
Hamelin
|
$250
|
$220
|
$210
|
$3.00/$1.00
|
45
|
41
|
86
|
197
|
|
Stirling
|
$250
|
$220
|
$210
|
-/-
|
45
|
41
|
86
|
197
|
|
Vlamingh
|
$250
|
$220
|
$210
|
$3.50/$1.50
|
45
|
41
|
86
|
197
|
|
Establishment per cent
|
85%
|
80%
|
70%
|
|||||
|
Barley receival + BAMA
|
$12.50
|
$/t
|
|
|
||||
|
Freight: farm to port
|
$22.50
|
$/t
|
farm to bin + bin to natural port
|
|
|
|
||
|
Seed cost
|
$350
|
$/t
|
|
|
|
|
|
|
|
Seed dressing cost
|
$61
|
$/t
|
|
|
|
|
|
|
|
Germination per cent
|
98
|
%
|
|
|
|
|
|
|
|
Operating costs
|
$150
|
$/ha
|
fuel, P fertiliser, weed control, foliar fungicides
|
|
|
|||
|
Urea cost
|
$420
|
$/t
|
|
|
|
|
|
|
|
Urea spreading cost
|
$10
|
$/ha
|
|
|
|
|
|
|
|
R&D levy
|
1.02%
|
farm gate value
|
|
|
|
|
|
|
|
Note: cash price for Hamelin, Stirling and Vlamingh assumed to be the same.
|
||||||||
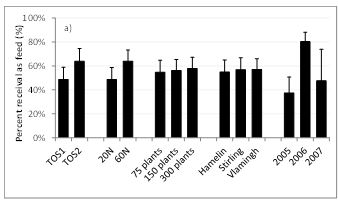
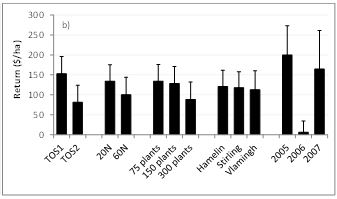
Figure 3. a) per cent of replicate samples meeting BFED1 specifications; and b) average return (yield by price minus costs) for each time of sowing, rate of applied N, seed rate, variety and year averaged across sites.
There was a trend towards lower returns when seeding was delayed (Figure 3), but the difference in return between the first and second date of seeding was only significant in four of the 13 sites (Table 3). This reduction in return was associated with a lower grain yield and a higher proportion of the samples downgraded to feed. Varietal returns were generally similar across sites and varietal return was not influenced by date of seeding. Receival as malt barley was similar across varieties, across treatments and varied with season (Figure 3).
Applied N consistently influenced return, with the three varieties responding similarly to increasing N (Table 3). Despite the small yield response to applied N, return decreased with increasing N due to the lower receival as malt barley (Figure 3) and the extra cost of the additional N. The decrease in return with increasing N was generally larger with the second date of seeding than the first (data not shown).
Seed rate consistently influenced return (Figures 3 and 4), with the three varieties responding similar to increasing plant density (Table 3). Seed rate did not influence the per cent of samples received as malt (Figure 3). The increased yield associated by doubling the target density from 75 to 150 plants/m2 in this trial series was offset by the increased cost of the seed, resulting in a similar return for the 75 and 150 plants/m2 seed rate treatments and a similar per cent received as malt (Figure 3). Increasing the target density above 150 plants/m2 did not increase yield, did not influence the per cent of samples received as malt, but increased costs (due to the extra seed) and resulted in a lower return (Figures 3 and 4).
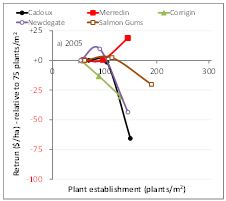
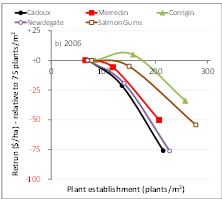
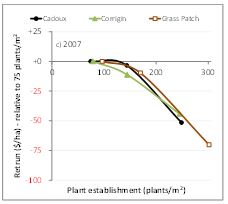
Figure 4. Change in return ($/ha) as the target density increases above the 75 plants/m2 seed rate treatment in a) 2005, b) 2006 and c) 2007 averaged across times of sowing, rates of applied N and variety.
Conclusion
In this lower rainfall study the optimum plant density that maximised return was achieved by targeting an establishment density between 75 and 150 plants/m2 (Figures 2 and 4). This is similar to and slightly lower than the optimum plant density for malt barley varieties suggested by Paynter (2016) and Paynter et al. (2016a, 2016b, 2016c) in higher rainfall areas. Sowing to establish more than 150 plants/m2 resulted in lower returns in this study.
The three varieties sown did not differ in how they responded to increasing seed rate (Table 2 and 3). Therefore the same target density would be recommended for Hamelin, Stirling and Vlamingh if they were still in commercial production for delivery as malt varieties. The suggested target density for those varieties in this study would be 90 to 110 plants/m2.
The optimum plant density for grain yield was not correlated with the site mean yield and was slightly higher but not largely changed with delayed seeding (Figure 2). This is similar to the observation of Paynter et al. (2016c) and indicates that growers do not need to change their target density (therefore seeding rate) if seeding is delayed by two to four weeks. In saying that, delayed seeding influenced hectolitre weight, screenings, grain protein concentration and grain brightness more than seed rate (data not shown). As a consequence delayed seeding rather than increased seed rate was more likely to cause downgrading to feed (Figure 4). So whilst growers don’t have to adjust the seeding rate, any delay in seeding date from May to June will likely impact on profitability.
Applied N regularly affected grain yield (often increasing it), grain quality (increasing the per cent of grain received as feed) and return (mostly decreasing profit) (Tables 2 and 3; Figure 4) but did not influence the optimum plant density for grain yield (Figure 2) or influence the response to increasing plant density (Tables 2 and 3). Paynter et al. (2016a) suggested, however, that the optimum plant density for grain yield decreased with increasing N, although the N rate that maximised returns was 30 kg N/ha, not 0 or 90 kg N/ha. In this study the extra yield generated did not compensate for the extra fertiliser cost and the increased downgrading to feed.
Whilst this study reports on the performance of three malt varieties that are no longer segregated in Western Australia, the DAFWA barley agronomy team with co-funding from the GRDC is undertaking new studies with current or potential malt varieties (ie. Compass and La Trobe) in lower rainfall areas. Unfortunately the early autumn and higher growing season rainfall received in 2016 resulted in grain yields (if not affected by frost) higher than our target grain yield of <1.5t/ha. The 2016 low rainfall seed rate series is to be repeated in 2017. In the meantime, the target plant density for malt barley growers in lower rainfall areas (<1.5t/ha) should be at or above 100 plants/m2. Whilst lower target densities achieved a similar return in this study, lower densities have been shown to decrease the yield potential of barley in other studies (Paynter 2016 and Paynter 2016a, 2016b, 2016c) and decrease the competitiveness of barley with weeds (Paynter and Hills 2009), without enhancing the prospects of meeting malt barley specifications significantly. The method for calculating the seed rate in kg/ha based on the 1000 kernel weight of the seed batch and the chosen target density is found in Table 5.
|
|
Target plant density (plants/m2) |
||||||
|---|---|---|---|---|---|---|---|
|
50 |
100 |
120 |
150 |
200 |
300 |
||
|
1000 seed weight |
Seeding rate (kg/ha) |
||||||
|
35 |
g |
21 |
45 |
54 |
67 |
89 |
153 |
|
40 |
g |
24 |
51 |
61 |
77 |
102 |
175 |
|
45 |
g |
27 |
57 |
69 |
86 |
115 |
197 |
|
50 |
g |
30 |
64 |
77 |
96 |
128 |
219 |
|
germination per cent (%) |
98% |
98% |
98% |
98% |
98% |
98% |
|
|
establishment per cent (%) |
85% |
80% |
80% |
80% |
80% |
70% |
|
|
|
|
|
|
|
|
|
|
|
Seeding rate (kg/ha) = |
(1000 seed weight x target density) |
||||||
|
|
|
(germination % x establishment % x 100) |
|||||
References
Paynter BH (2016). Compass and La Trobe: head to head from 25 to 400 plants/m2 at York in 2014. 2016 GRDC WA Grains Research Update, Perth WA, 29 Feb and 01 Mar 2016.
Paynter BH, Graham N, Malik R and Hills AL (2016a). National barley agronomy trial series (2012-2014) – Western Australian observations on the interaction between variety, nitrogen and seed rate. 2016 GRDC WA Grains Research Update, Perth WA, 29 Feb and 01 Mar 2016.
Paynter BH and Hills AL (2009). Barley and rigid ryegrass (Lolium rigidum) competition is influenced by crop cultivar and density. Weed Technology 23:40–48.
Paynter BH, Hills AL and Malik R (2016b). How much does seed rate (changing from 50 to 400 plants/m2) influence barley’s performance? 2016 GRDC WA Grains Research Update, Perth WA, 29 Feb and 01 Mar 2016.
Paynter BH, Hills AL and Malik R (2016c). How much is the seed rate (changing from 50 to 400 plants/m2) response of barley influenced by date of seeding? 2016 GRDC WA Grains Research Update, Perth WA, 29 Feb and 01 Mar 2016.
Acknowledgments
Technical support was provided by Sue Cartledge, David Dodge and the DAFWA Technical Support Units at Wongan Hills, Merredin, Katanning and Esperance. This research was located at the farms of Mike Kalajzic, Cadoux; Bruce Mills, Corrigin; Lawry Pitman; Corrigin; Rory Graham, Salmon Gums; Geoff Sanderson, Grass Patch and the DAFWA research farms at Merredin and Newdegate. DAFWA funded this research with co-funding from the GRDC. Rick Graham, NSW DPI and Dion Nicol, DAFWA provided feedback on a draft of this paper.
Was this page helpful?
YOUR FEEDBACK