Myth busting the frost tolerance of oats
Author: Georgie Troup, Stacey Hansch, Ben Biddulph, Mark Seymour, Blakely Paynter and Raj Malik | Date: 27 Feb 2017
Key Messages
- Oats are not tolerant to frost – they will get frosted, albeit less than wheat or barley.
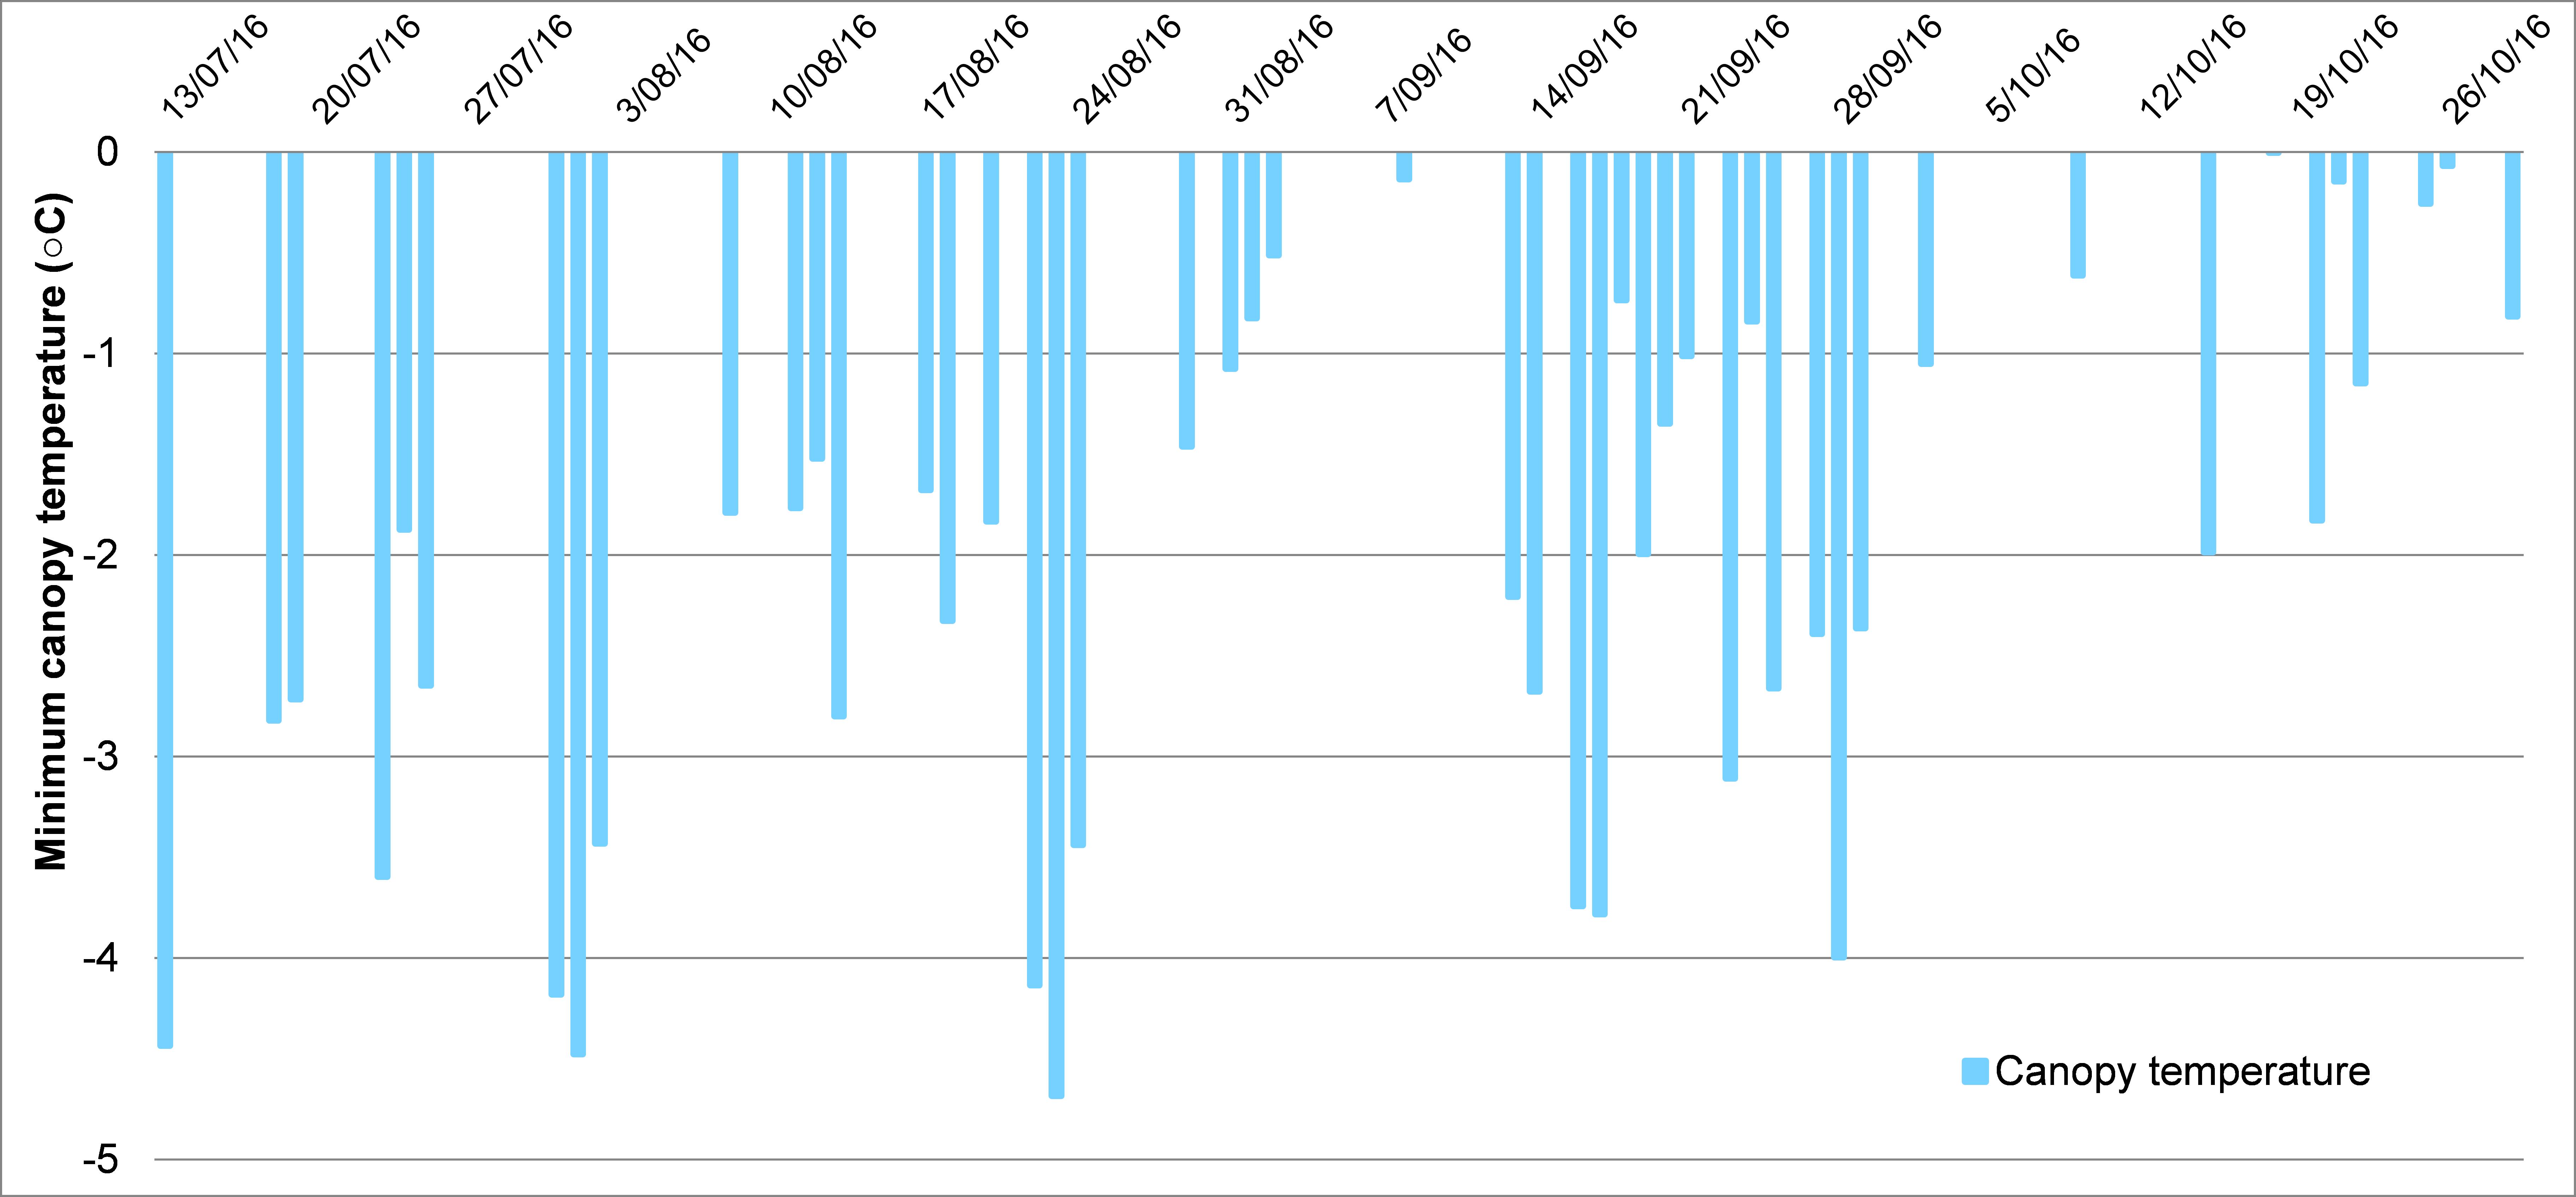
- Stem frost, pre-flowering frost, flowering frost, and grain filling frost damage were observed in this study corresponding to 47 days below 0°C.
- Species selection is more critical than variety selection when seizing an early sowing opportunity in a frost risk area with oats providing more frost tolerance than barley then wheat
Background
Oat production in Western Australia has increased rapidly in recent years. As the area sown to oats has expanded into inland areas the frequency of observed frost effects on oats has increased. In 2016, multiple frost events provided an opportunity to assess the effects of frost on cereal species including oats from an existing trial at Muresk. This trial initially aimed to evaluate which cereal– wheat, barley or oats, is a better option for seizing early sowing opportunities (Malik et al 2017).
Aim
The aim of this study was to evaluate frost sensitivity of barley, wheat and oat varieties in relation to sowing date.
Method
In 2016, one study at Muresk evaluated six wheat varieties, six barley varieties and six oat varieties that were sown in mid-April, early-May and late-May (Table 1). The varieties were selected on the basis of their maturity. The trial design was blocked by seeding date (TOS) and species, with variety randomised within each block. Wheat and barley were randomised within each seeding date (TOS) while the oats were separated for ease of crop management. The trial was sown in six banks, with two banks per replicate, three replicates per treatment.
Table 1. Varieties included in the study and their maturity.
Barley | Oat | Wheat |
|---|---|---|
Compass (mid) | Bannister (mid to mid-long) | Cutlass (mid to long) |
La Trobe (mid) | Carrolup (mid) | Mace (short to mid) |
Flinders (long) | Durack (short) | Magenta (mid to long) |
Granger (long) | Kojonup (mid to mid-long) | Trojan (mid) |
Rosalind (mid) | Yallara (mid) | Wylah (Winter) |
Urambie (very long) | Williams (mid) | Yitpi (mid to long) |
All plots were given the same nutrition of basal fertiliser at seeding; 100kg/ha Summit GUSTO treated with Uniform (40ml/L) banded below the seed, and 250kg/ha of NPK Blue Special, supplying a total of 40kg N/ha, 25kg P/ha and 49kg K/ha. Additional nitrogen (N) was applied as 48L/ha of Flexi-N at 6WAS. Seed was sown into canola stubble and direct-drilled with a small plot air-seeder with on-row packing press wheels.
A growth stage that could be accurately determined was selected for each species (Z49-awn peep for barley, Z65-flowering for wheat and Z71-watery ripe for oat), and the date at which each plot reached that stage was recorded (data not presented in this paper). Tiny tag temperature loggers (TGP4017) were installed to record ambient canopy temperature within each species at each time of sowing.
Sterility was assessed by sampling 30 spikes per plot at random at maturity. Samples were frozen and later assessed by measuring yield potential per head; this was done by counting the number of florets that would have produced a grain if unaffected by frost. The percentage of sterility was determined by counting the number of florets that produced viable grain, and subtracting this from the yield potential. For oats, frost damage could be isolated into either a) pre-flowering (see photo), or b) flowering sterility, by visual inspection of the physical differences in florets. The ability of a species or variety to re-tiller and compensate for yield loss as a result of severe frost damage was not measured in this study. Evidence of compensation was observed but could not be accurately accounted for.
Stem frost damage was also observed in all three crop types but not assessed in these trials.
Grain yields (t/ha) were recorded at harvest and cleaned samples (sample >1.5 mm) were used to assess grain quality based on receival specifications. Only the grain yield is presented in this paper.
Data was analysed using ANOVA within Genstat (VSN International 2013) with a block structure of (rep+block)/colrep and a treatment structure of sowing date*species/variety for wheat and barley, and sowing date*variety for oats.
Due to the trial management requirement for the oat plots to be separated from the wheat and barley, grain yield of wheat and barley cannot be statistically compared to the oats. For this reason the results below have been split into 1) wheat and barley grain yield, 2) oat grain yield. In contrast, the sterility % of the three species can be statistically compared (Van Burgel pers. com.).
Site
The trial site was located at Muresk (Table 2), on a low-lying paddock alongside the Avon River. The trial was sown into sufficient moisture for germination at each of the three seeding dates; 15th April, 4th May and 30th May 2016. Temperatures were mild until early May when it cooled suddenly, and this was reflected in the observed time to emergence and early growth rate of the second and third sown treatments.
Table 2. Location, soil type, growing season rainfall (May-Oct), and soil test (0-10 cm) data.
Location | Seeding dates | May-Oct rainfall (mm) | Organic C (%) | pHCa (0-10cm) | Soil type |
|---|---|---|---|---|---|
Muresk | 15/4/16 4/5/16 30/5/16 | 284 | 0.70 | 5.5 | Grey brown sandy duplex |
Results
Barley and Wheat grain yield
Barley and wheat differed in their grain yield, barley out-yielded wheat at all seeding dates producing 3.3t/ha and 1.4t/ha respectively. This low wheat grain yield can be attributed to the effect of frost, with all treatments affected by multiple frost events during the growing season (Figure 1). When sown on 15th April, barley out-yielded wheat by 2.3t/ha, this yield advantage reduced as seeding date was delayed, with barley out-yielding wheat by 1.6t/ha when sown on 30th May.

Figure 1. Muresk WA, 2016. Events when ambient temperature was below 0°C (unshielded T-type thermocouple at canopy height).
Oat grain yield
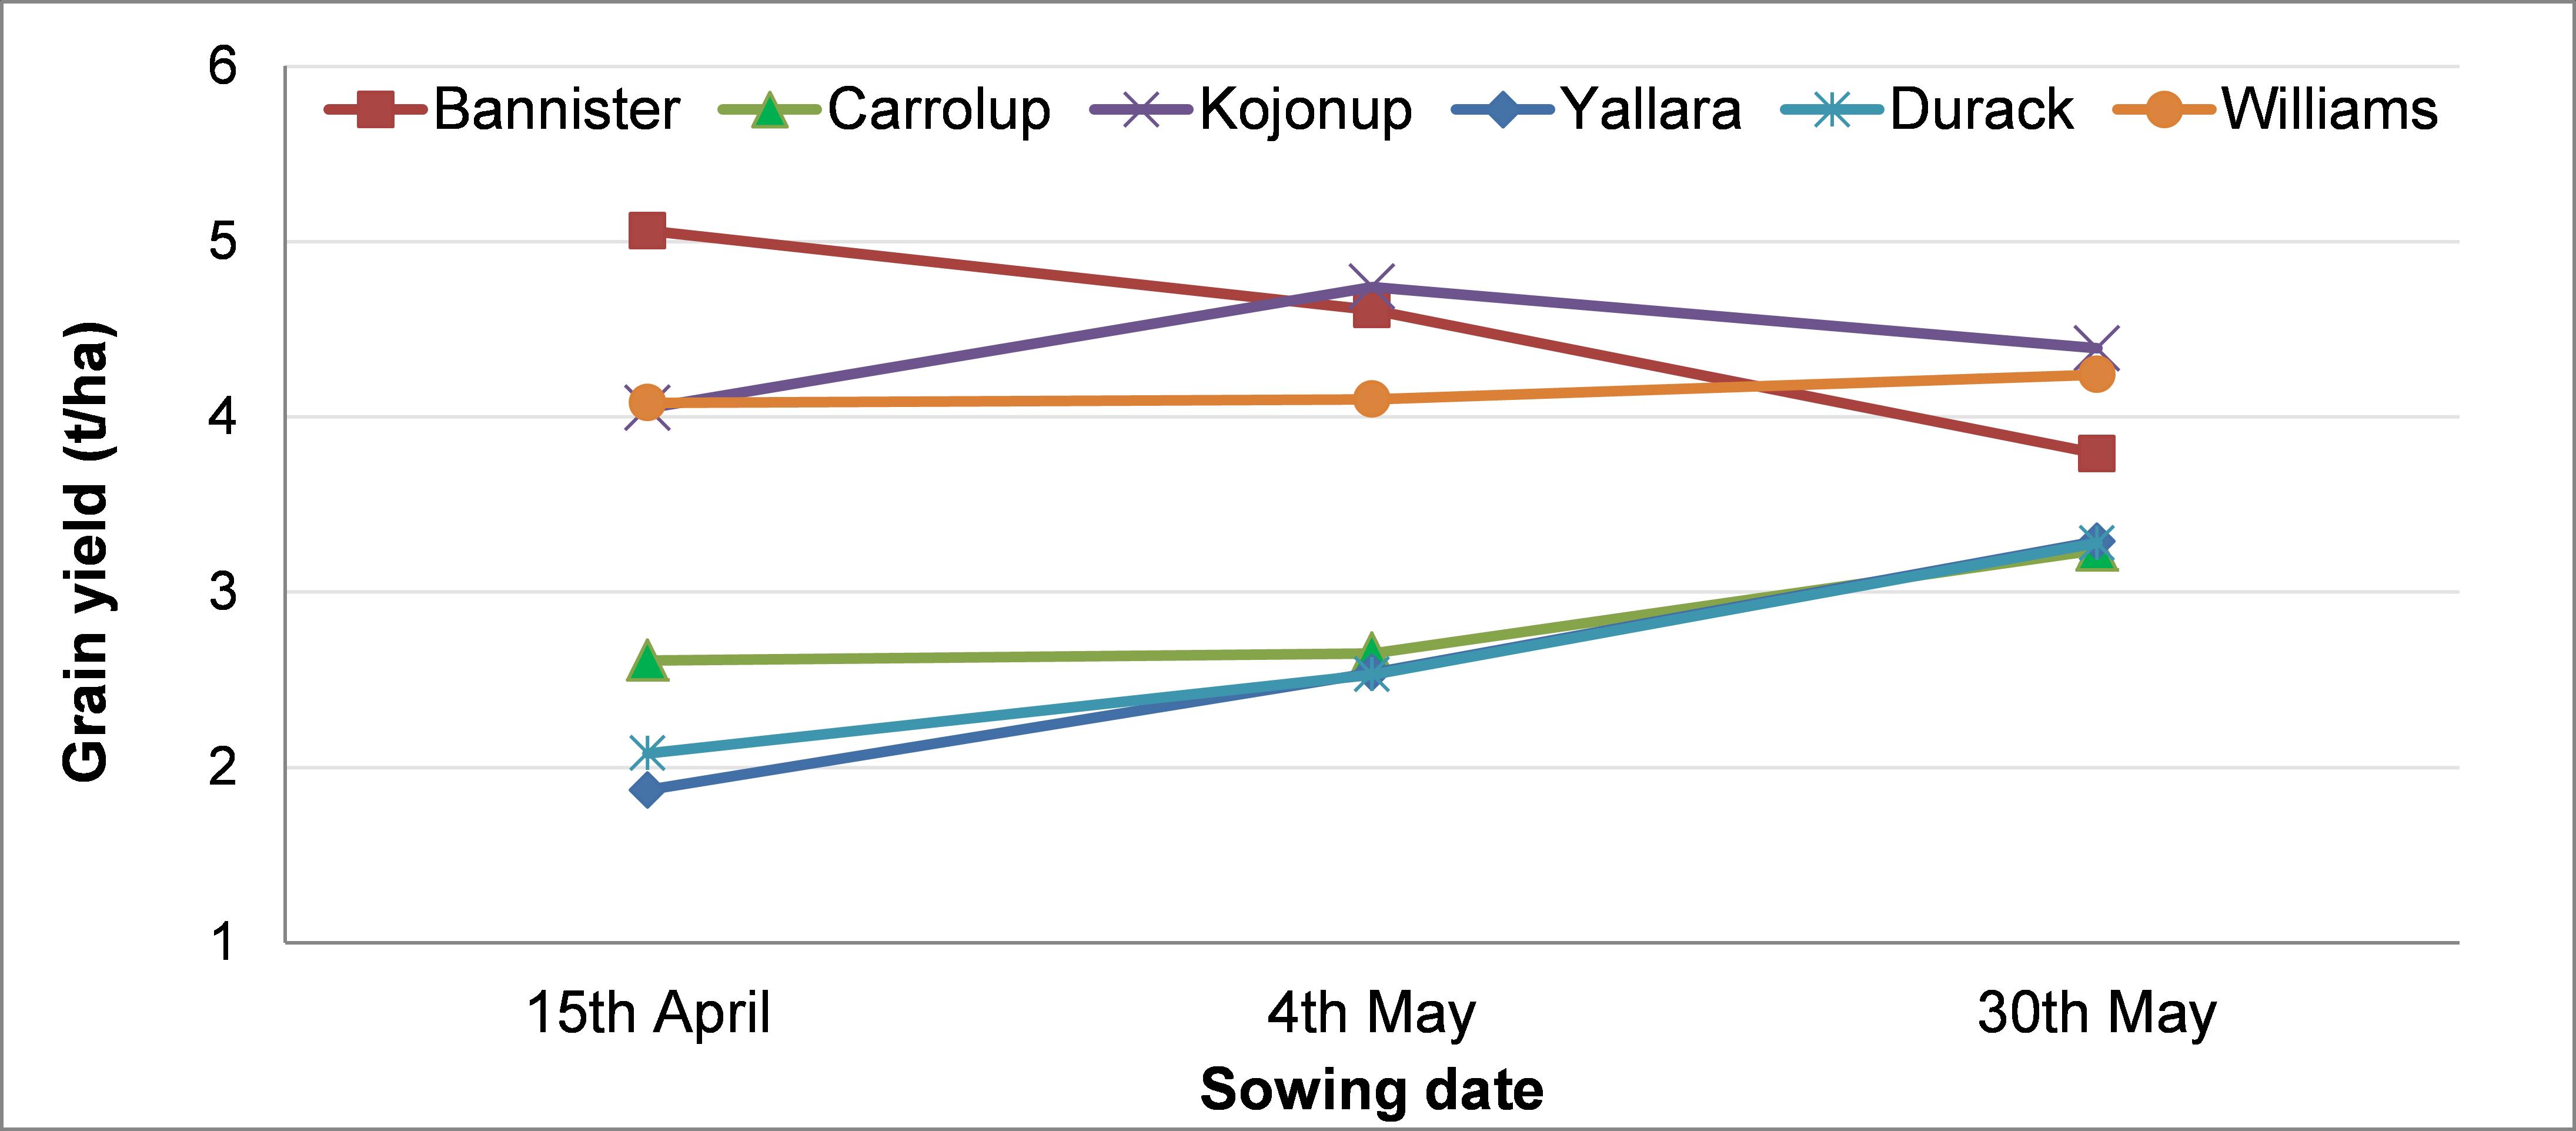
Mean oat grain yield in this study was 3.5t/ha. Mean grain yield ranged from 3.3t/ha when sown in mid-April to 3.7t/ha when sown in late-May. Variety selection had a greater impact on grain yield when sown early, than it did when sowing was delayed (Figure 2). Bannister, Kojonup and Williams out-yielded Carrolup Yallara and Durack when sown mid-April and early-May. Varieties differed in their grain yield, and their ranking was affected by seeding date.

Figure 2. Mean grain yield of six oat varieties at three sowing dates; 15th April, 4th May, and 30th May 2016. Lsd (P = 0.05) = 0.55 t/ha when comparing means with the same seeding date.
Sterility
Wheat had a higher percentage (%) of sterile florets per head than barley or oat (Figure 3). Sterility of wheat and barley consistently reduced as sowing was delayed from mid-April to late-May (mean sterility ranged from 92% to 30% in wheat, and 44% to 7% in barley). Sterility of oats was more stable than wheat and barley, with mean sterility ranging from 17% when sown in mid-April to 13% when sown in late-May.
Figure 3. Total sterility (% sterile florets per head) of wheat, barley, and oats.
Oat varieties differed in their sterility, and the ranking of varieties was affected by sowing date (Figure 4). Mid-season variety Yallara had significantly higher sterility than the other varieties evaluated when sown in mid-April, with greater flowering frost damage driving this overall sterility increase. The sterility ranking of varieties does not correlate with their maturity, with multiple frost events attributing to the sterility recorded in this study. New short-season variety Durack had mid-range levels of sterility when compared to the other oat varieties in this study.
Delaying sowing of oats from 15th April until 4th May did not reduce flowering sterility, however delaying sowing until 30th May did reduce flowering sterility. This delay in sowing date reduced the variation in grain yield between varieties, and overall had no negative effect on mean oat grain yield.

Figure 4. Total sterility (% sterile florets per head), pre-flowering sterility (%) and flowering sterility (%) of six oat varieties. Letters denote significance (P= 0.05).
Relationship between sterility and grain yield
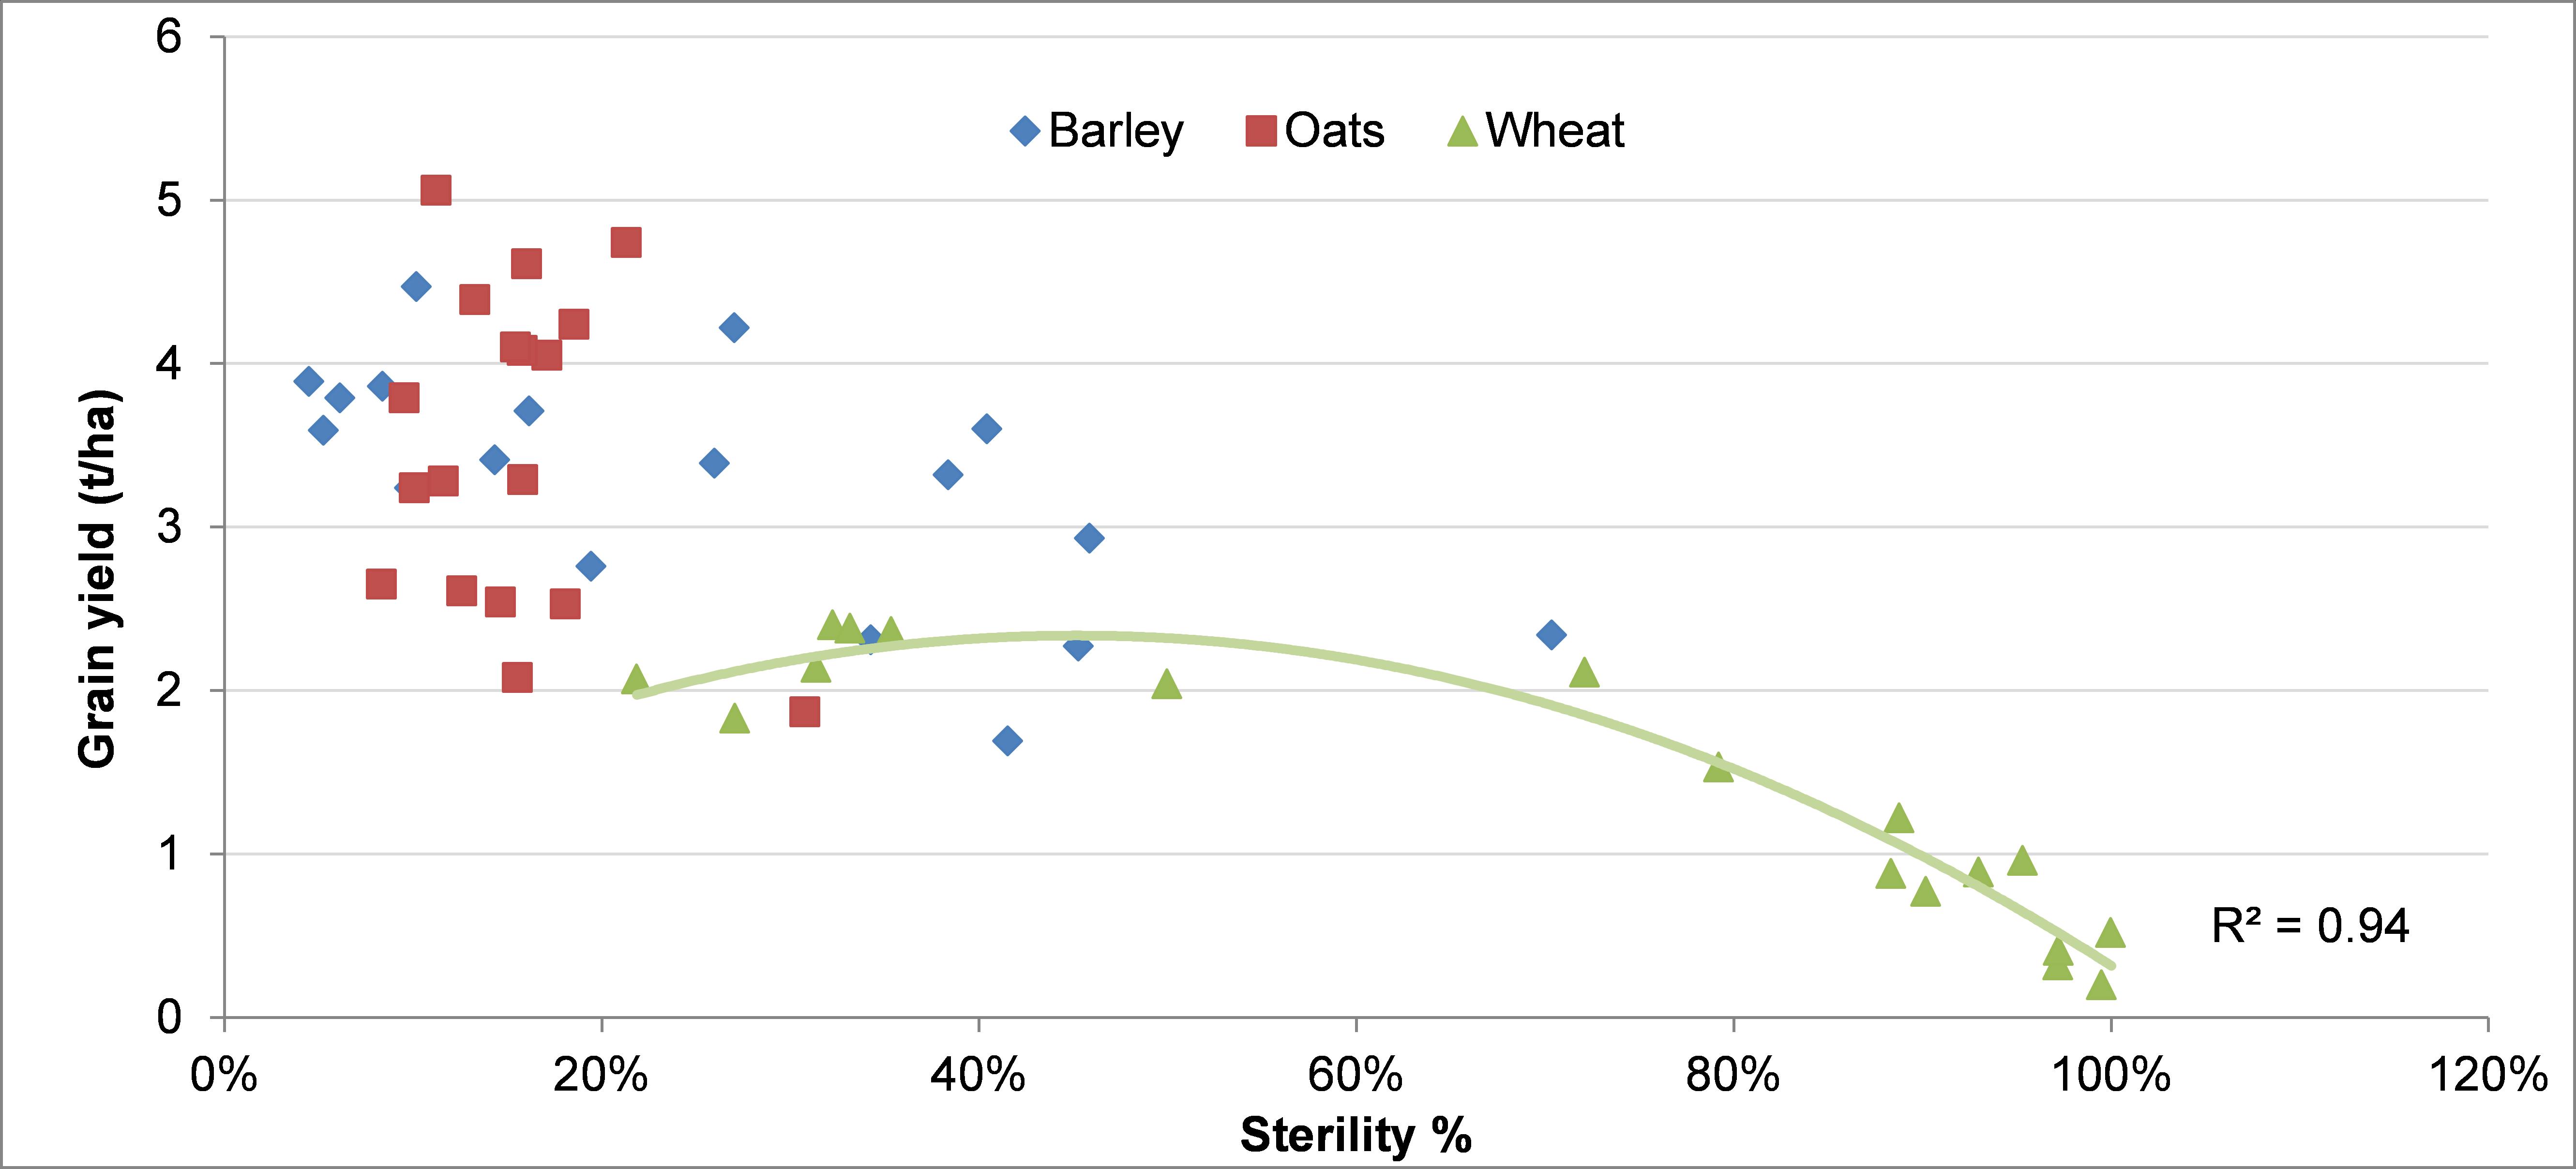
A regression analysis to determine if a relationship existed between grain yield and sterility of each of the species identified that there was a) no relationship between oat grain yield and sterility (R² = 0.17), b) there was a slight relationship between barley grain yield and sterility (R² = 0.44), and c) there was a relationship between wheat grain yield and sterility (R² = 0.94).
The polynomial relationship that exists between the grain yield and sterility of wheat suggests that the plant is capable of compensating for gain yield loss from sterility due to frost events until this sterility exceeds 75%, once this threshold is exceeded the ability of the plant to compensate is compromised (Figure 5). This relationship was evident when grain yield from all sowing dates was interpreted, and will differ when sowing dates are considered individually.

Figure 5. Relationship between total sterility (%) and grain yield (t/ha) of oat, wheat and barley.
Conclusion
The study determined that oats are susceptible to frost damage, albeit to a lesser extent than barley or wheat. Wheat is significantly more frost sensitive than barley (Biddulph et al. 2013). Species selection was more critical than variety selection when preparing to seize an early sowing opportunity in a high frost risk environment. Grain yield differences between the highest and lowest yielding varieties of wheat, barley and oats were greater when sown early than when sowing was delayed.
The high sterility (up to 100%) of some wheat varieties when sown early was attributed to the sensitivity of wheat during its flowering stage (Z65) compared to barley and oats. Consistent varietal differences in frost sensitivity of wheat and barley have been found in WA (Biddulph et al. 2013) supporting the observations in this trial. Sterility was not consistently related to grain yield in all species, this may be attributed to their differing ability to compensate for frost damage.
Evaluating sterility in oats required the development of an assessment protocol to determine the sterility percentage that occurred at pre-flowering, or flowering. Mid-season oat variety Yallara had significantly higher sterility than other varieties evaluated when sown mid-April, and its grain yield was lower than expected, this may be attributed to the variety’s inability to compensate for the greater reduction in grain number by frost. This observation will require validation from further research to confirm the observations made in 2016.
References
Biddulph B, Height N, March T, Laws M, Eckerman P, Reinheimer J, and Eglington J (2013) Update on frost pre-breeding research. 2013 WA Crop Updates, Perth, WA.
VSN International (2013). GenStat for Windows 16th Edition. VSN International, Hemel Hempstead, United Kingdom.
Acknowledgments
The author acknowledges the research support of Brenton Leske, and technical support of Helena O’Dwyer, Pam Burgess and Rod Bowey, statistical support provided by Karyn Reeves and Andrew Van Burgel, and the DAFWA Research Support Units at Northam, Merredin, Esperance and Katanning.
GRDC Project Number: DAW00227 and DAW00241
Paper reviewed by: David Ferris
GRDC Project Code: DAW00227 and DAW00241,
Was this page helpful?
YOUR FEEDBACK

