UAV mapping of rhizoctonia bare patch for targeted treatment
Author: Andrea Hills, DAFWA, Phil Goulding, DAFWA, Daniel Huberli, DAFWA, Geoff Thomas, DAFWA, and Lachlan Beveridge, ThinkSpatial | Date: 28 Feb 2017
Key messages
Rhizoctonia patches can be easily identified on both normal (RGB) and NDVI images captured by UAV.
Mapping shows the pattern of patch distribution across a paddock, highlighting areas of crop with high and low levels of rhizoctonia patches.
Maps can be used to determine the best fungicide treatment approach for susceptible crops such as blanket applications or zoning to optimise economic returns.
Background and aims
Rhizoctonia bare patch or rhizoctonia root rot is a fungal root disease cause by Rhizoctonia solani and affects mainly cereals and some pulses such as lupins (faba beans and field peas are fairly resilient). This fungus causes crop damage by pruning roots creating a spear-tipped appearance, which can occur from emergence onwards. Patches form from damage done at the seedling stage. However rhizoctonia damage can also appear as uneven crop growth. Yield loss within patches ranges from less than ten per cent, where patches form minor dish shaped depressions in crops, to 100% yield loss (no or few surviving plants that do not produced viable grain). Seasonal conditions influence whether affected plants can access sufficient nutrients and moisture to produce grain despite their damaged root system.
Although individual patches are relatively small, commonly ranging in size from 3 to 30m2, thousands of unevenly distributed patches can occur in a single paddock and yield losses across the paddock are in direct relation to the total area of crop affected.
Growers are generally aware that some sections of a paddock are affected by rhizoctonia more than others (often in association with a sandy soil), but to our knowledge mapping at a paddock scale has never been done since it is a highly laborious task due to the size and number of patches. In the past there has also been no need for mapping as amelioration options such as in-furrow fungicides have only recently become available.
Historically rhizoctonia management has been through agronomic methods which reduce the level of inoculum in the soil (cultivation, rotation and by removing volunteer grasses using herbicides or cultivation) and improve early root growth (cultivation below the seed, early sowing into warm soil, good nutrition, avoiding sulfonyl urea herbicides). Rotations away from cereals and lupins also reduce inoculum levels as other crops such as canola are less susceptible to rhizoctonia.
In the past few years seed dressings registered to suppress rhizoctonia became available and in 2015, Uniform® fungicide became available to control rhizoctonia, applied in-furrow or on treated fertiliser (Uniform only).
While the Uniform label states the need for an integrated approach to achieve rhizoctonia control, this product (containing active ingredients azoxystrobin and metalaxyl) has shown positive yield and gross margin results when applied to paddocks planted to wheat and barley with high levels of rhizoctonia inoculum (Hüberli et al., 2015). However the cost to apply Uniform at sowing can be prohibitive as the rates required cost from $19 – 25 per hectare, which is a substantial upfront investment if blanket applications are made over a whole paddock. Only rhizoctonia control is considered in this paper – the benefit from other diseases that this product is registered to suppress or control is not considered here.
Therefore, can images captured by an unmanned aerial vehicle (UAV) accurately show where rhizoctonia patches occur? How can we use these images to formulate a treatment approach to use when applying fungicide at sowing in the next wheat, barley or lupin crop?
Method
Paddocks affected with rhizoctonia bare patch were flown at various stages of growth by our project collaborators, ThinkSpatial using a RTK enabled fixed wing UAV (eBee) with attached camera with normal red, green, blue (RGB) lenses and a NIR lens. Still images were stitched together to produce a single, rectified normal and normalised difference vegetation index (NDVI) image of each paddock. The GIS platform Geomedia was used to analyse images. ThinkSpatial designed and is developing the experimental software RhizoDetector to automate the mapping of rhizoctonia patches.
Ten sites sown to wheat or barley (and one lupin crop) were monitored between 2014 and 2016 in the Esperance and South Stirlings district. In 2015, sites were flown three times from late July to late September. At each site, five rhizoctonia patches of a range of severities were ground-truthed with root disease assessments and Predicta B results confirming that patches were primarily caused by Rhizoctonia solani (AG8), although root lesion nematodes were also present at five out of ten sites. At maturity, hand cuts were taken from the monitored patches, threshed and used to estimate grain yields and quality.
The maps shown in this paper are from a study paddock located near Cascade, 70km north-west of Esperance, WA (Figure 4) which was chosen for its high incidence of rhizoctonia. It is under a crop rotation of canola, wheat, barley, of which the wheat and barley are susceptible to rhizoctonia. The 40ha section of paddock was mapped by UAV to produce RGB and NDVI images in 2014 (wheat) and 2015 (barley).
Results and Discussion
Paddock mapping of rhizoctonia bare patches
Rhizoctonia could be clearly identified in both the normal and NDVI UAV images produced for each paddock (Figure 1). All images identified patches within the crop and there was no particular month /crop growth stage that consistently produced better images – weather, especially wind at the time of the flight was more important to obtain good clarity of patches in images. Other agronomic constraints that affect crop growth can be distinguished on the basis of size (Figure 2) or the type of edge patches have, for instance straight or jagged (Figures 2 and 3) versus rhizoctonia’s rounded edges (Figure 1). Visually rhizoctonia can usually be distinguished from most other patch causing pathogens or pests such as nematodes or other root rots from the growth habit of the plants within the patch.
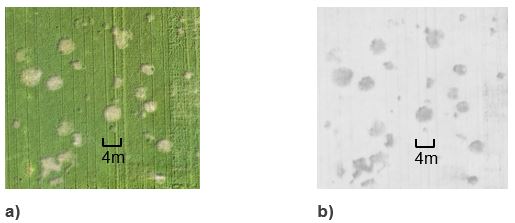
Figure 1. UAV image close ups of a cluster of rhizoctonia patches; they range from <1- 4m in diameter. a) normal RGB image and b) NDVI image
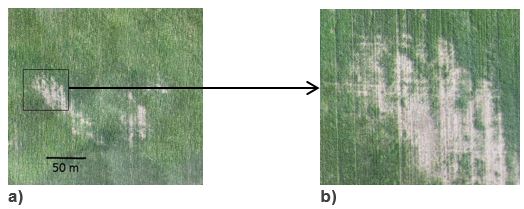
Figure 2. Crop growth affected by a soil constraint other than rhizoctonia. a) The size of this patch makes it extremely unlikely to be a result of rhizoctonia b) a closer look at the boxed area shows jagged edges with some normal crop growth within it and both are uncharacteristic of rhizoctonia.
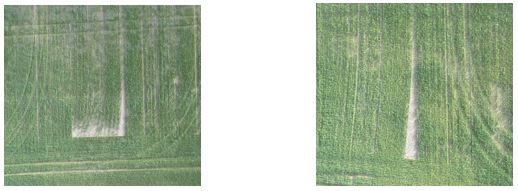
Figure 3. Not rhizoctonia bare patch: the early turn off for the end of a sowing run can produce jagged or straight edges neither of which is similar to rhizoctonia.
Images produced showed how levels of rhizoctonia and density of patches varied substantially within paddocks. In the study paddock there was a variable distribution of patches across the study area (Figure 4). In this paddock the incidence of rhizoctonia increased from 1.5% in 2014 (wheat) to 2.5% in 2015 (barley). Barley is known to be more susceptible than wheat to rhizoctonia. The distribution pattern of patches in 2014 and 2015 was similar (Figure 5) and areas with low levels of rhizoctonia in 2014 remained low in 2015. Almost 30% of the rhizoctonia present in 2014 reappeared in precisely the same location in 2015.
In this paddock zoning for treatment applications (discussed below) at sowing in 2015 would have been useful in managing rhizoctonia. In other paddocks with a greater area of bare patches and uniform distribution, a blanket application of fungicide is likely to give a better economic return.
Mapping rhizoctonia patches manually in a GIS program is arduous and our project collaborators, ThinkSpatial are developing software to automate this process which will give growers and consultants a useful tool. The program “RhizoDetector” uses images to identify where bare patches in the crop are and quantify the area affected by rhizoctonia, simplifying the process of identifying which paddocks are worth treating. The output is a shape file that can be uploaded to produce zoned treatment applications.
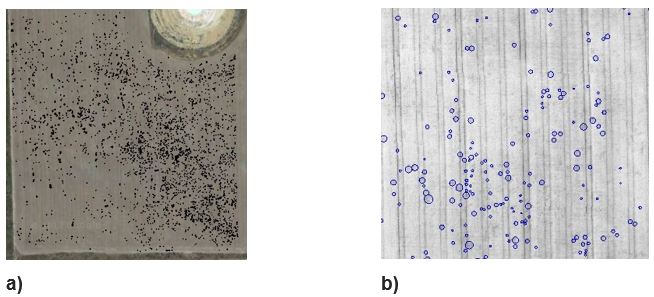
Figure 4. The variable distribution of rhizoctonia patches in 2015 (shown in black) can be seen across a) the 40ha study area and b) a 2ha close up.
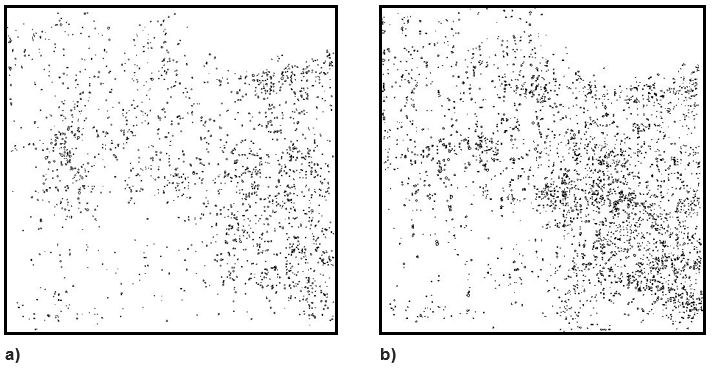
Figure 5. Comparison of rhizoctonia incidence across the study paddock in a) 2014 and b) 2015.
Yield loss
Grain yield losses within the monitored patches ranged from 9 – 96%; the average yield penalty across eight sites was 60% in 2015. However, hand cuts underestimate the losses from machine harvesting as many tillers lodge and/or have very light grains that would be blown out the back of a machine. There were also significant declines in barley grain quality with increased 2.5mm screenings and decreased grain and hectolitre weights. It is estimated that in most rhizoctonia patches yield loss would be close to 100% as it is unlikely the affected plants would produce harvestable yield.
Likelihood of economic return
Returns from treating rhizoctonia vary with potential yield, the degree of losses within patches, and the improvement in grain yield from treating patches (Tables 1 and 2). Incorporating potential economic returns into mapping rhizoctonia distribution can help guide paddock zoning for treatment by identifying the most profitable sections of a paddock to treat.
We expect that rhizoctonia patch density (as a percentage of an area) needs to be at a threshold level for treatment to generate economic returns to growers. To start with, the density of patches can be calculated at a paddock level to determine if a blanket application is the optimum approach. Table 1 indicates that in a 2t/ha yield potential paddock, with 80% yield loss in patches and 75% yield response to fungicide in patches, a blanket application of fungicide is likely to be profitable if it has a patch density of 11%. This is a very high density of patches and unlikely to occur across a whole paddock except in the most extreme situations, but we can use this threshold (11%) to identify the sections within the paddock that have a patch density at or above this level and apply fungicide to just those portions.
Table 1. Threshold density (% area) of rhizoctonia patches to achieve breakeven return on investment (ROI) with the application of 400mL/ha Uniform ($25/ha) at different levels of grain yield (1 – 5t/ha), assuming 80% yield loss in untreated patches, 75% yield response to fungicide in patches and with wheat price of $200/t.
|
Effect of yield on patch density needed for breakeven ROI |
||||||
|---|---|---|---|---|---|---|
|
Yield (t/ha) |
1.0 |
1.5 |
2.0 |
3.0 |
4.0 |
5.0 |
|
Patch threshold (% area) |
21% |
14% |
11% |
7% |
5% |
4% |
Ground-truthing of economic returns from zoned applications of fungicide is the focus of this activity in 2017 and these tables are provided as preliminary estimates based on a desktop study.
Table 2 shows how an increasing density of patches affects the likely returns and could be used to guide a grower's decision for what density of patches to treat. Some may wish to treat break-even as well as profitable portions of a paddock (≥11%) while others may restrict treatment to areas where a return is more likely (eg 15%).
Table 2. Effect of patch density (patch as % of treated area) on estimated returns ($/ha) from the application of 400ml/ha Uniform at sowing ($25/ha) assuming 80% yield loss in untreated patches, 75% yield response to fungicide in patches, wheat price of $200/t and predicted yield of 2t/ha.
|
Effect of patch density on fungicide ROI |
|||||
|---|---|---|---|---|---|
|
Patch density (% area) |
5% |
10% |
15% |
20% |
30% |
|
ROI from fungicide treatment |
-$12.80 |
-$0.80 |
$11.20 |
$23.20 |
$47.20 |
Treatment maps
Treatment maps can be as simple or complex as the grower desires. Hand drawn zones around the densest areas of rhizoctonia patches suffice to avoid applying fungicide in areas with little or no rhizoctonia and minimises input costs.
At its most precise, growers with sectional control on their seeding bars could apply fungicide directly where the mapped patches are and incorporate a buffer to capture potential patch movement and continued growth of rhizoctonia beyond the edge of patches. Buffers can be added using the SMS AgLeader program. MacNish (1993) studied two conjoining rhizoctonia patches over five years and found the annual expansion was 2m at most. In the 40ha study paddock a total of 1ha is directly affected by patches and a 2m buffer around each rhizoctonia patch would result in a total of 7.6ha being treated (Figure 6). If a 3m buffer was used this would result in 11.8ha being treated.
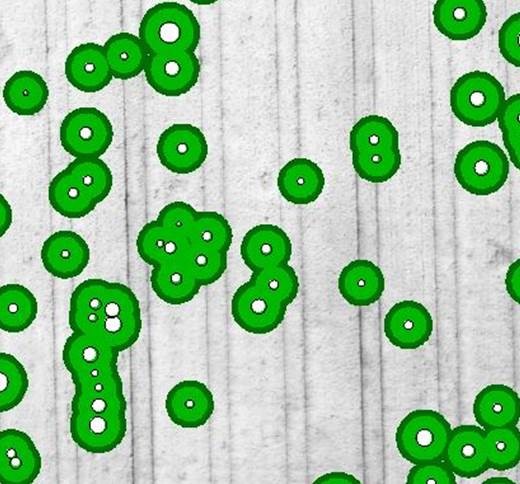
Figure 6. Rhizoctonia patches (white) with a 2m (bright green) and 3m (dark green) buffer applied.
Another approach that doesn’t rely on sectional control (just on/off liquid application) is to grid paddocks based on their sowing runs and determine the density of rhizoctonia patches within each grid. For example if a 12m wide grid (seeding bar width) with an arbitrary length of 5 metres is placed over a paddock, the density of rhizoctonia in each grid can be mapped based on severity (Figure 7).The decision of which areas to treat can be made from the output (Figure 7).
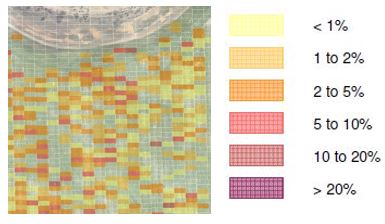
Figure 7. Example of gridding (12 x 5m) applied to the study paddock with rhizoctonia categorised according to density.
In 2015 the average grain yield in the study paddock was 3.1t/ha, which Table 1 suggests has a breakeven point of 7% rhizoctonia. Using Figure 7, if the grids where rhizoctonia makes up more than 5% of the area have fungicide applied then 3.5ha of the 40ha paddock will be treated; greater than 10% density would result in only 0.9ha being treated. Grid categories could be adjusted to whatever values (eg breakeven density, > $X/ha density etc) the grower wants to use.
Conclusion
UAV images are an ideal way to look at the incidence of rhizoctonia across paddocks and study their distribution with a view to determining the best treatment approach. Patches of poor growth not caused by rhizoctonia can usually be easily distinguished from rhizoctonia patches.
There are often areas of a paddock with quite low levels of rhizoctonia, possibly as the soil is more suppressive or due to a change in soil type as rhizoctonia is known to prefer sandy soils. These are the areas that mapping aims to eliminate from unnecessary treatment. High concentration areas can be targeted for treatment, either by fungicide or through cultural approaches such as deep cultivation.
Progress in automating the mapping of patches using the program RhizoDetector will give consultants or growers the opportunity to manipulate images further. The likelihood of economic returns will depend on the amount of rhizoctonia present and the potential yield of the paddock. Further ground-truthing is required, but desktop calculations suggest that there is good potential for returns or at least to minimise a paddock’s input costs.
References
Hüberli D, M Connor, S Miyan, W McLeod, J Desbiolles, P Bogacki and A McKay (2013) Integrated disease management options to control rhizoctonia bare-patch in cereals. GRDC Crop Research Updates, Perth WA
Hüberli D, M Connor, S Miyan, W McLeod, R Battaglia, L Forsyth, B Parkin, T Klein, M Clarke, G Robertson, R Correll, J Desbiolles, P Bogacki and A McKay (2015) Rhizoctonia solant AG8: New breakthroughs in control and management. GRDC Crop Research Updates, Perth WA
MacNish (1993) The use of zymogram and anastomosis techniques to follow the expansion and demise of two coalescing bare patches caused by Rhizoctonia solani AG-8. Aust. J. Agric. Res., 1993, 44, 1161-73.
Acknowledgments
ThinkSpatial pilot Rain Liu. Thanks to growers who hosted sites; M & H Adams, N & P Blumann, EDRS, N & B Hunt, D Lay, D & N Moir, P & T Piggott, M & P Woods. Thanks to DAFWA Technical staff Miriam Connor and Stuart Vincent for assistance with root and soil disease assessments. This project was jointly funded by DAFWA and GRDC as part of the project “Improving grower surveillance, management, epidemiology, knowledge and tools to manage crop disease.” The research undertaken as part of this project is made possible by the significant contributions of growers through both trial cooperation and the support of the GRDC; the authors would like to thank them for their continued support.
Paper reviewed by: Svetlana Micic
® Registered trademark
GRDC Project Code: DAW00229,
Was this page helpful?
YOUR FEEDBACK