Variety specific agronomy requirements of recently released oat varieties: Durack, Bannister and Williams
Author: Georgie Troup, Mark Seymour and Raj Malik, DAFWA | Date: 28 Feb 2017
Key Messages
- Varieties differ in their yield, quality and response to changes in plant density.
- Bannister was the best performing variety in 2016 as it out-yielded the other varieties evaluated and met Oat1 quality standards at all sites. However, Bannister should be sown to achieve a higher plant density than Carrolup.
- Grain quality of newly released, short season variety Durack was not consistent with previous studies.
- Choosing to grow more than one variety will maximise the strengths, and mitigate the weaknesses of oat varieties.
Background
In 2016, the milling oat production in Western Australia increased by 81% from 2015 tonnages (GIWA February Crop Report), this increase in production was also coupled with a decline in the market price for milling grain, and a greater price differential between Oat1 and Oat2. Variety specific agronomy requirements and variability in market price for milling grain, emphasises the importance of research that supports growers to select the right variety and apply the right agronomy, in order to: build confidence, meet milling specifications, capture forward contract opportunities, and be a price maker rather than a price taker at harvest.
Strong uptake of high yielding varieties Williams and Bannister by growers, coupled with fluctuations in grain quality during recent seasons, and new research which identified that these varieties had an increased sensitivity to crop management has reduced grower confidence in their ability to meet milling oat market requirements (Troup et al 2015, and 2016). For example, Bannister appears to respond more to increased plant density than other varieties whilst Williams has been shown more likely to lodge under high N inputs, be more sensitive to dry Springs, and more likely to have higher screenings than other varieties. Clearly oat varieties differ in their sensitivity to management inputs and this directly influences their probability of being received as Oat1 or Oat2 in the bulk handling system. Subject to pricing, this sensitivity then affects their likely adoption. Durack, a new short season variety which will undergo commercial milling evaluation early in 2017, is expected to increase the likelihood of growers meeting milling specification due to its significantly higher hectolitre weight and lower screenings (Troup et al 2015 and 2016). Its performance in this trial series in 2016 provides a new perspective in comparison to previous trials, including the National Variety Trial program.
Aims
The aims of this study are to:
(1) compare the responses of four milling oat varieties to changes in nitrogen and seeding rates
(2) determine if there are significant variety x nitrogen x seeding rate interactions between oat varieties
(3) develop variety specific management guidelines for growers and industry on new oat varieties.
Method
In 2016, six sites were established to compare the performance of four milling oat varieties x four plant densities x three nitrogen rates. At the higher rainfall sites (Kojonup West, Pingelly and Muresk), varieties Bannister, Carrolup, Kojonup and Williams were sown. At the lower rainfall sites (Grass Patch, Varley and Merredin), varieties Bannister, Carrolup, Durack (previously tested as WA02Q302-9), and Yallara were sown. The seed rate (kg/ha) to establish the four target plant densities of 80, 160, 240 and 320 plants/m2 varied for each variety and was adjusted based on their grain weight and germination percentage. A seed rate of 80 plants/m2 = 27 to 36kg/ha, 160 plants/m2 = 57 to 76kg/ha, 240 plants/m2 = 98 to 129kg/ha, 320 plants/m2= 130 to 173kg/ha was used. Plant establishment was determined at 4 weeks after seeding (WAS) by counting the number of plants in 2 rows x 1m x 2 locations per plot. The three nitrogen (N) rates differed based on rainfall zone: in the lower rainfall environment 10, 30 and 60kg N/ha was applied; while in the higher rainfall environment 30, 60 and 90kg N/ha was applied.
Trials were sown as a split plot cyclic design with variety and nitrogen as whole plots and density randomised as subplots within a variety + nitrogen combination. Seed was sown into canola stubble and direct-drilled with a small plot air-seeder with on-row packing press wheels. Basal fertiliser comprised of Summit GUSTO compound fertiliser which was treated with Uniform (40ml/L) and banded below the seed at 100kg/ha, supplying a total of 10kg N/ha, 12kg P/ha and 14kg K/ha.
Grain yields (t/ha) were recorded at harvest and cleaned samples (sample >1.5 mm) were used to assess grain quality based on GIWA Oat receival specifications. Only the grain yield, hectolitre weight and screenings data are presented in this paper. Data was analysed within Genstat (VSN International 2013) with a block structure of (rep+colrep)/(Nitrogen applied + Variety and a treatment structure of nitrogen applied x variety x plant density).
Results
Site and variety
Growing season rainfall (May-October) ranged from 421mm at Kojonup West) to 172mm at Varley (Table 1). The site mean grain yield ranged from 3.03t/ha (Grass Patch) to 4.27t/ha (Kojonup West). Grain quality was generally within the Oat1 limits (hectolitre weight ≥51kg/hL and screenings ≤10%) with a few exceptions. At Pingelly and Kojonup West, group B resistant ryegrass was uniformly distributed across the trial area.
Table 1. Location, soil attributes, growing season rainfall, seeding dates and site mean yields for the six trials.
|
Site No. |
Location |
Organic C (%) |
SYN* (kg N/ha) |
pH CaCl2 (0-10cm) |
Soil type |
May-Oct rainfall (mm) |
Seeding date |
Site mean yield (t/ha) |
|---|---|---|---|---|---|---|---|---|
|
16ES24 |
Grass Patch |
0.83 |
54 |
5.8 |
Brown-grey loam |
229 |
17-May-16 |
3.03 |
|
16KA07 |
Kojonup West |
4.2 |
205 |
5.3 |
Brown deep sandy duplex |
421 |
16-May-16 |
4.27 |
|
16ME09 |
Merredin |
0.86 |
56 |
5.0 |
Brown sandy duplex |
225 |
4-May-16 |
4.09 |
|
16NO04 |
Muresk |
0.67 |
44 |
5.5 |
Grey brown sandy duplex |
284 |
28-April-16 |
4.09 |
|
16NO05 |
Pingelly |
2.21 |
132 |
5.3 |
Grey brown sandy duplex |
283 |
6-May-16 |
4.23 |
|
16KA06 |
Varley |
1.16 |
74 |
4.7 |
Dark yellow loamy gravel |
172 |
27-April-16 |
3.11 |
*SYN – estimate of N available in the paddock
Table 2. Analysis of variance for main effects (variety, density and seeding date) and their interactions at six trial sites. Significance: *** = p<0.001, ** = p<0.01, * = p<0.05 and n.s. = not significant.
Grain yield |
|||||||||||||||||
|---|---|---|---|---|---|---|---|---|---|---|---|---|---|---|---|---|---|
|
Muresk |
Pingelly |
Kojonup West |
Varley |
Grass Patch |
Merredin |
||||||||||||
|
Variety (V) |
*** |
n.s. |
*** |
*** |
*** |
*** |
|||||||||||
|
Plant density (D) |
*** |
n.s. |
*** |
*** |
*** |
** |
|||||||||||
|
Applied N (N) |
* |
n.s. |
n.s. |
*** |
*** |
*** |
|||||||||||
|
V x D |
n.s. |
* |
*** |
*** |
*** |
n.s. |
|||||||||||
|
V x N |
n.s. |
n.s. |
n.s. |
*** |
n.s. |
n.s. |
|||||||||||
|
N x D |
n.s. |
n.s. |
* |
n.s. |
n.s. |
n.s. |
|||||||||||
|
V x N x D |
n.s. |
n.s. |
** |
n.s. |
* |
n.s. |
|||||||||||
|
Hectolitre weight (kg/hL) |
Screenings (% < 2.0 mm) |
||||||||||||||||
|
Muresk |
Pingelly |
Kojonup West |
Varley |
Grass Patch |
Merredin |
Muresk |
Pingelly |
Kojonup West |
Varley |
Grass Patch |
Merredin |
||||||
|
V |
*** |
*** |
*** |
*** |
*** |
*** |
*** |
*** |
*** |
*** |
** |
*** |
|||||
|
D |
*** |
** |
n.s. |
n.s. |
** |
n.s. |
*** |
*** |
*** |
n.s. |
*** |
n.s. |
|||||
|
N |
*** |
*** |
n.s. |
n.s. |
n.s. |
*** |
*** |
** |
n.s. |
n.s. |
n.s. |
** |
|||||
|
V x D |
n.s. |
n.s. |
n.s. |
* |
*** |
n.s. |
n.s. |
n.s. |
*** |
n.s. |
** |
n.s. |
|||||
|
V x N |
n.s. |
n.s. |
n.s. |
n.s. |
n.s. |
n.s. |
n.s. |
n.s. |
n.s. |
n.s. |
n.s. |
* |
|||||
|
N x D |
n.s. |
n.s. |
n.s. |
n.s. |
n.s. |
n.s. |
n.s. |
n.s. |
* |
n.s. |
** |
n.s. |
|||||
|
V x N x D |
n.s. |
n.s. |
n.s. |
n.s. |
n.s. |
n.s. |
n.s. |
n.s. |
n.s. |
n.s. |
n.s. |
n.s. |
|||||
Grain yield
Bannister was the highest yielding variety overall, out-yielding Carrolup by 1.1t/ha averaged across six sites and out-yielding Williams by 0.23t/ha where they were sown together at the higher rainfall sites. For the three high rainfall sites (Kojonup West, Muresk and Pingelly), average yields relative to the site mean were: Bannister +0.44t/ha, Carrolup -0.60t/ha, Kojonup -0.06t/ha, and Williams +0.21t/ha (Figure 1a). For the three lower rainfall sites (Grass Patch, Varley and Merredin), average yields relative to the site mean were: Bannister +0.95t/ha, Carrolup -0.14t/ha, Durack -0.68t/ha, and Yallara -0.12t/ha (Figure 1b).
Plant density influenced grain yield at all sites except Pingelly where group B resistant ryegrass was uniformly distributed across the trial area. The relationship between grain yield and plant density at Grass Patch, Kojonup West, Merredin and Varley supports the current recommended plant density of 160 plants/m² for the lower rainfall area and 240 plants/m² for the higher rainfall area (Figure 2a). However, the grain yield of Bannister was maximised at a higher density than for Carrolup, Durack, and Yallara at Grass Patch and Varley with a similar trend observed at Kojonup West (Figure 2b). This supports previous research (Troup et al 2016) suggesting Bannister should be sown to achieve a higher target density than those varieties. At Muresk, grain yield was optimised between 80 and 160 plants/m2, lower than the current recommended target density of 240 plants/m2 (Figure 2a).
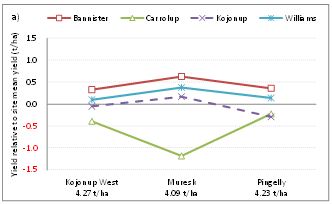
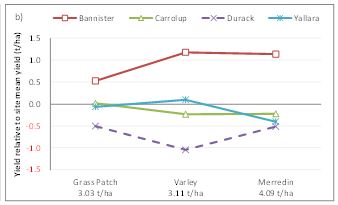
Figure 1. Yield of four oat varieties at six sites relative to the site mean yield. a) at the three high rainfall sites Kojonup West, Muresk and Pingelly b) at the three lower rainfall sites Grass Patch, Varley and Merredin.
Applied nitrogen (N) fertiliser influenced grain yield at all sites except Pingelly and Kojonup West, both of which had high background levels of nitrogen in the soil (Table 1). Grain yield responded similarly to increasing applied N at Merredin, Varley and Grass Patch, increasing grain yield by 20% when applied N increased from 10 to 60kg N/ha. Grain yield decreased when N increased from 60 to 90kg N/ha at Muresk. At most sites there was no interaction between variety and N; however, at Varley, Durack was not responsive to increasing applied N, whereas the grain yield of Bannister, Carrolup and Yallara increased out to 60kg N/ha.
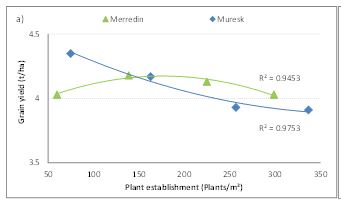
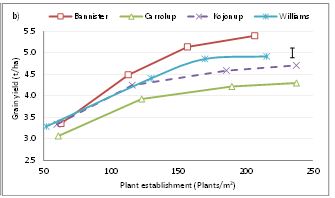
Figure 2. a) Mean grain yield (t/ha) response to changes in plant density (plants/m²) at Merredin, Lsd (P = 0.05) = 0.09t/ha, and Muresk, Lsd (P = 0.05) = 0.24t/ha, and b) Mean grain yield (t/ha) response of four oat varieties to changes in plant density (plants/m²) at Kojonup West in 2016. Vertical bar indicates Lsd at P = 0.05.
Hectolitre weight
All varieties met the Oat1 minimum hectolitre weight of 51kg/hL when averaged across sites. Nevertheless there were some notable trends. Carrolup and Bannister had higher hectolitre weight than Durack and Yallara when averaged across the three lower rainfall sites. Carrolup had higher hectolitre weight than Bannister, Williams and Kojonup when averaged across the three higher rainfall sites (Table 3).
Applied nitrogen (N) influenced hectolitre weight at Muresk, Merredin and Pingelly, increasing applied N decreased hectolitre weight (Figure 3a). At Kojonup West, Varley and Grass Patch increasing applied N had no significant effect on hectolitre weight. Varieties responded similarly to increasing applied N, and there were no interactions between applied N and plant density.
Plant density influenced hectolitre weight at Muresk, Grass Patch and Pingelly. However, the response to increasing plant density on hectolitre weight was inconsistent. At Muresk, increasing plant density from 160 to 240 plants/m² reduced hectolitre weight by 0.72kg/hL; at Grass Patch, increasing plant density from 80 to 240 plants/m² increased hectolitre weight by 0.5kg/hL; and at Pingelly increasing plant density had a slightly negative effect on hectolitre weight.
Table 3. Varietal differences in hectolitre weight (kg/hL) and screenings (% <2.0mm) averaged across 2016 trial sites.
|
Variety |
Hectolitre weight (kg/hL) |
Screenings (%<2.0mm) |
Oat receival grade |
|---|---|---|---|
|
Averaged across trial sites located at Merredin, Varley and Grass Patch |
|||
|
Bannister |
60.8 |
1.8 |
1 |
|
Carrolup |
61.0 |
2.0 |
1 |
|
Durack |
58.1 |
2.1 |
1 |
|
Yallara |
59.4 |
2.5 |
1 |
|
Lsd (p=0.05) |
1.16 |
0.3 |
|
|
Averaged across trial sites located at Muresk, Pingelly and Kojonup West |
|||
|
Bannister |
57.4 |
5.4 |
1 |
|
Carrolup |
59.1 |
7.3 |
1 |
|
Kojonup |
56.6 |
3.5 |
1 |
|
Williams |
56.9 |
11.5 |
2 |
|
Lsd (p=0.05) |
0.7 |
1.8 |
|
Varieties differed in their response to plant density at Grass Patch, and Varley (Figure 3b). Hectolitre weight of newly released short season variety Durack plummeted as plant density increased at Varley. Frost damage was observed in this trial, and at the neighbouring barley trial. Durack was exposed to more frost events than other varieties while flowering and during early grain filling. The rapid decrease in hectolitre weight may be due to the effect of increasing plant density on the growth stage of the plot; as plant density increases so does plant growth stage synchronicity resulting in more florets being at a critical growth stage when a frost event occurs (Paynter pers. comm.).
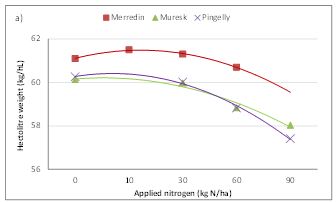
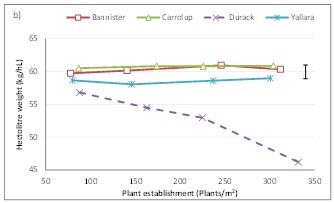
Figure 3. Average hectolitre weight (kg/hL) response a) to applied N at Merredin, Lsd (P = 0.05) = 0.28kg/hL, Muresk, Lsd (P = 0.05) = 0.57kg/hL, and Pingelly, Lsd (P = 0.05) = 0.81kg/hL, and b) of four oat varieties to increasing plant density at Varley. Vertical bar indicates Lsd at P = 0.05.
Screenings
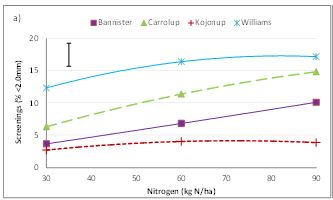
Variety influenced screenings more than plant density or applied nitrogen. Williams had the highest screenings: it was the only variety that exceeded the Oat1 maximum screenings limit of 10% when averaged across sites (Table 3), and at Pingelly it exceeded the limit in all treatments (Figure 4).
Increasing applied N consistently increasing screenings at all sites. Varieties did not differ in their response to applied N, except at Merredin where Bannister and Yallara were more sensitive to increasing applied N than Carrolup and Durack.
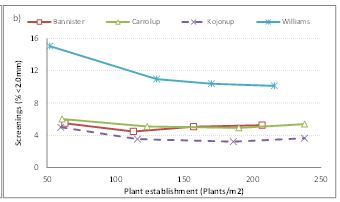
Increasing plant density from 80 to 320 plants/m² increased screenings at Pingelly and Muresk by 1.8% and 1.9% respectively, while at Grass Patch increasing plant density decreased screenings by 0.9%. The ranking of varieties was influenced by plant density at Grass Patch and by the application of nitrogen at Merredin (Table 2).
Varieties differed in their response to plant density at Kojonup West, where screenings of Williams and Kojonup were more sensitive to increasing plant density from 80 to 160 plants/m² than Bannister or Carrolup (Figure 4b).
Conclusion
Bannister was the best performing variety in this study, it consistently out-yielded other varieties evaluated, and met Oat1 quality standards at all sites. Bannister continued to respond to a higher plant density than the current recommended density at 50% of sites, supporting previous research suggesting Bannister should be sown to achieve a higher plant density than Carrolup, Yallara or Durack in these environments (Troup et al 2016). The ability to sow at higher density may assist in alleviating the challenges associated with limited weed control options available in oat crops.
The performance of Bannister in the lower rainfall environment in 2014 and 2015 (Troup et al 2015 and 2016) has led to an increased adoption of this variety in the central and eastern wheatbelt. Its performance in this study supports the increased adoption of Bannister, encroaching on the area sown to previous benchmark variety Carrolup. Bannister has been observed to have issues with grain staining in the higher rainfall environment (Knell pers. comm. 2015) where oat-on-oat rotations are more commonplace increasing the disease pressure on the crop, and where pre-harvest rainfall is more likely. Due to these observations, the increased adoption of Bannister in the higher rainfall environments is to be coupled with a risk mitigation strategy of: a) growing Bannister in low Septoria risk situations and, b) having two oat varieties in the rotation to combat the weaknesses that individual variety can exhibit, with the second variety to have improved disease resistance e.g. Williams.
The grain quality advantages that Durack exhibited in previous seasons was not observed in this study. Durack’s short season maturity coupled with an early-May sowing date led to undeliverable grain due to very low hectolitre weight in high applied N and in high density treatments at the frost affected Varley site. Durack’s hectolitre weight exhibited greater sensitivity to increasing plant density at Varley than other varieties evaluated (5.5kg/hL lower than the site mean hectolitre weight). This indicates growers should be careful not to sow Durack too early in their sowing program if they are hoping to use it to ‘shandy’ up other grain for delivery.
Williams tendency to produce narrower grains than other varieties led to it exceeding the Oat1 screenings limit of 10% <2.0mm. This trait of Williams has been consistent during 2014, 2015 and 2016 oat agronomy trials (Troup et al 2015 and 2016). A conservative approach to applied N will improve the probability of meeting the Oat1 grade with Williams as its screenings % will reduce and its hectolitre weight will improve. This response is consistent across all varieties as Williams did not exhibit greater sensitivity to applied N or plant density than the other varieties evaluated.
Carrolup had higher hectolitre weight than Bannister, Williams and Kojonup when averaged across all higher rainfall sites (Muresk, Pingelly, Kojonup West), and it had higher hectolitre weight than Durack and Yallara when averaged across all lower rainfall sites, in contrast to its performance in 2015 (Troup et al 2016) where it was the poorest performing variety in the study. Perhaps this different response between seasons was due to the cool Spring which allowed varieties to express their differences.
References
Malik R, Paynter BH, Webster C, and McLarty A (2011) Growing oats in Western Australia for hay and grain. Bulletin 4791. Department of Agriculture and Food, Western Australia, South Perth, Western Australia.
Troup GM, Malik R, Seymour M, Paynter BH, Dhammu, H, and Butcher T (2016) Milling oat variety guide for Western Australia 2017. Bulletin 4880. Department of Agriculture and Food, Western Australia, South Perth, Western Australia.
Troup GM, Paynter BH and Malik R (2016). Bannister and Williams response to sowing date and plant density. 2016 GRDC Research Updates, Perth, WA, 29 February 2016
Troup GM, Paynter BH and Malik R (2016). Bannister and Williams response to sowing date and plant density. 2016 GRDC Research Updates, Perth, WA, 29 February 2016
Troup GM, Paynter BH and Malik R (2015). Bannister and Williams, how do the new oat varieties stack up? 2015 Agribusiness Crop Updates, Perth, WA, 24-25 February 2015
VSN International (2013). GenStat for Windows 16th Edition. VSN International, Hemel Hempstead, United Kingdom.
Acknowledgments
The author acknowledges the research support of Blakely Paynter, and technical support of Helena O’Dwyer, Pam Burgess and Rod Bowey and the DAFWA Research Support Units at Northam, Merredin, Esperance and Katanning.
The research undertaken as part of this project is made possible by the significant contributions of growers through both trial cooperation and the support of the GRDC, the author would like to thank them for their continued support.
Varieties displaying this symbol beside them are protected under the Plant Breeders Rights Act 1994
Paper reviewed by: David Ferris
|
Hectolitre weight (kg/hL) |
Screenings (% < 2.0 mm) |
||||||||||||||||
|
Muresk |
Pingelly |
Kojonup West |
Varley |
Grass Patch |
Merredin |
Muresk |
Pingelly |
Kojonup West |
Varley |
Grass Patch |
Merredin |
||||||
|
V |
*** |
*** |
*** |
*** |
*** |
*** |
*** |
*** |
*** |
*** |
** |
*** |
|||||
|
D |
*** |
** |
n.s. |
n.s. |
** |
n.s. |
*** |
*** |
*** |
n.s. |
*** |
n.s. |
|||||
|
N |
*** |
*** |
n.s. |
n.s. |
n.s. |
*** |
*** |
** |
n.s. |
n.s. |
n.s. |
** |
|||||
|
V x D |
n.s. |
n.s. |
n.s. |
* |
*** |
n.s. |
n.s. |
n.s. |
*** |
n.s. |
** |
n.s. |
|||||
|
V x N |
n.s. |
n.s. |
n.s. |
n.s. |
n.s. |
n.s. |
n.s. |
n.s. |
n.s. |
n.s. |
n.s. |
* |
|||||
|
N x D |
n.s. |
n.s. |
n.s. |
n.s. |
n.s. |
n.s. |
n.s. |
n.s. |
* |
n.s. |
** |
n.s. |
|||||
|
V x N x D |
n.s. |
n.s. |
n.s. |
n.s. |
n.s. |
n.s. |
n.s. |
n.s. |
n.s. |
n.s. |
n.s. |
n.s. |
|||||
GRDC Project Code: DAW00227,
Was this page helpful?
YOUR FEEDBACK