Crown rot yield loss response curves
Author: Clayton Forknall (DAFQ, Toowoomba), Steve Simpfendorfer (NSW DPI, Tamworth) and Alison Kelly (DAFQ, Toowoomba) | Date: 09 Mar 2017
Take home message
- Response curves provide an additional tool to aid growers in varietal selection decisions to maximise returns in the presence of disease.
- An experiment conducted near Macalister in 2015 revealed variation in the yield response of varieties to crown rot, along with their resistance to this disease.
- The variety Suntop, although displaying crown rot symptoms similar to that of a susceptible variety, demonstrated a greater ability to maintain yield in the presence of disease than other varieties considered (tolerance).
- The selection of varieties based purely on current resistance categories may be overlooking genetics with improved tolerance, such as the variety Suntop.
Background
Production losses due to disease are a major financial constraint to the production of cereal crops in Australia, with annual losses in wheat alone estimated at $913 million.
Given the demonstrated constraint disease poses to the grains industry, the Grains Research and Development Corporation (GRDC) funded the Yield Response Curves (YRC) project (DAW00245) with the aim of better understanding and quantifying the potential production losses incurred from foliar, crown and root diseases through the development of response curves. Response curves relate a measure of productivity, namely grain yield, to a measure of disease and are constructed for a range of varieties differing in resistance levels, across a number of locations and years, for an array of priority pathogens identified to affect the grains industry both at a regional and national level.
One such pathogen is crown rot, caused predominantly by the fungus Fusarium pseudograminearum (Fp). Crown rot has been identified to affect winter cereal crops grown throughout Australia, with an estimated cost to growers of $97 m annually. As such, a module of the YRC project, led by the New South Wales Department of Primary Industries, has been dedicated to the construction of response curves to explore the impact of crown rot on production losses.
Crown rot infection is characterised by a honey-brown discolouration at the base of infected tillers. Yield loss is related to the expression of whiteheads which are induced by water and/or temperature stress during flowering and grain-filling. These prematurely ripened spikes contain either no grain or shrivelled grain depending on the timing of stress relative to crop development. All winter cereal crops host the crown rot fungus.
This paper summarises the results from a single experiment conducted near Macalister in 2015, presenting response curves for the five wheat varieties considered in the experiment, along with exploring the types of information that can be gathered from the response curves for each variety.
Methods
An experiment conducted near Macalister in 2015 was selected as a case study for the purposes of this paper. The experiment consisted of four bread wheat varieties (Sunguard, Suntop, EGA Gregory and Lincoln) and one durum wheat variety (Caparoi), where each variety was exposed to six rates of crown rot inoculum in order to measure the response in yield and quality attributes as a result of increasing crown rot pressure. The six rates of inoculum, being 0, 0.25, 0.5, 1.0, 2.0 and 4.0 grams of inoculum per metre row (g/m row), were applied at sowing and represent a plausible range in crown rot inoculum that could be left by residues of previously infected crops. Treatments were randomised according to a split-plot design, where each treatment combination, that is the combination of variety and inoculum rate, were replicated three times.
The crown rot index, a visual measure of crown rot impact based on the incidence and severity of browning of infected tillers, was calculated on a plot basis using a sample of 25 plants per plot. Yield and grain quality were obtained from samples collected using plot harvesters.
The data was analysed using random regression techniques to estimate the yield potential (intercept) and yield response (slope) of each variety in the experiment. Yield potential provides an estimate of the ability of a variety to yield in the absence of disease, while the yield response demonstrates the rate at which yield is lost per unit increase in disease pressure.
Results
Figure 1 presents the response curves for each variety at the Macalister 2015 experiment. From the figure, it can be seen that varieties vary in both their yield potential in the absence of crown rot and yield response due to crown rot infection. Although named “curves” the relationship between grain yield and crown rot index was found to be linear in this case.
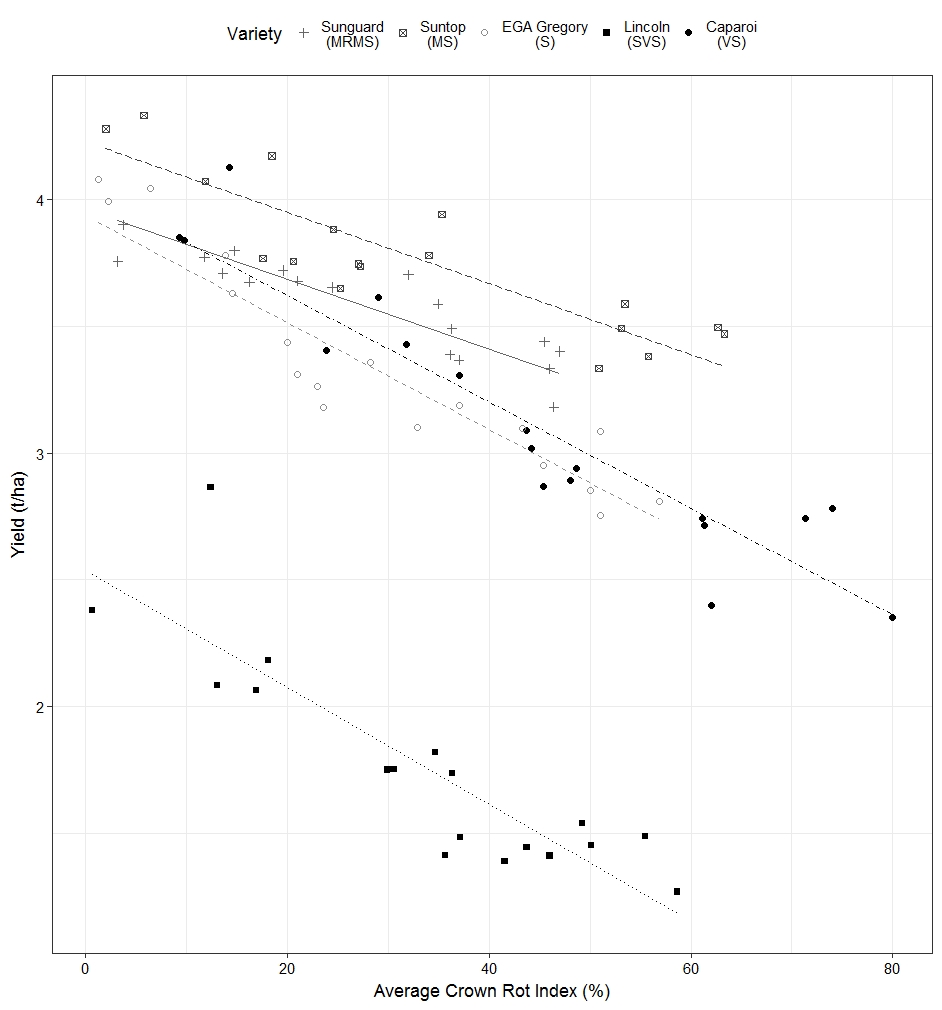
Figure 1. Response curves describing the response in yield of five wheat varieties to crown rot at an experiment near Macalister in 2015. Coloured symbols and line types correspond to different varieties. Variety resistance categories provided beneath variety names.
Discussion
Using the response curves presented in Figure 1, a comparison of a series of traits can be conducted for each of the varieties.
Yield potential
An estimate of the yield potential, or the ability of a variety to yield in the absence of crown rot, is provided by the intercept of the response curve for each variety. In this case it can be see that the variety Suntop had the greatest yield potential in the Macalister environment in 2015, yielding approximately 4.2 t/ha in the absence of crown rot. On the other hand, Lincoln has the lowest yield potential in the environment (approximately 2.5 t/ha). However, the yield potential of Lincoln in this experiment was severely compromised by the presence of the root lesion nematode, Pratylenchus thornei (Pt), which was identified to be present in medium numbers (5.5 Pt/g soil 0 – 30 cm) by a PreDicta B® test prior to sowing.
Also evident from the response curves is the low background level of crown rot inoculum present at the experimental location, with little disease present in those treatments where no crown rot inoculum was applied. The selection of experimental locations plays a substantial role in the success of these experiments, as high levels of background inoculum and the subsequent infection of plants without the addition of inoculum, prevent the accurate estimation of the yield potentials of varieties.
Resistance
The resistance of varieties to disease can also be assessed using response curves. In the case of crown rot, this is achieved through a comparison of the maximum crown rot index values measured; a variety displaying a greater maximum index is more susceptible to the disease. Using the response curves in Figure 1, the variety Caparoi can be seen to display the highest crown rot index value (approx. 80%), followed by the variety Suntop (approx. 63%). Conversely, the variety Sunguard exhibits the least amount of disease symptoms (maximum value approx. 47%). A comparison of the variety rankings according to maximum crown rot index with the resistance categories assigned by the National Variety Testing (NVT) system reveals a direct correspondence in terms of varietal resistance to crown rot, except in the case of the variety Suntop. Suntop is rated as a moderately susceptible (MS) variety, however displays a maximum crown rot index value second only to the very susceptible (VS) durum wheat, Caparoi, in this experiment. This anomalous behaviour of Suntop has also been witnessed in other experiments conducted across the northern grains region (data not shown).
Yield response and tolerance
The yield response of each variety to crown rot is provided by the slope of the response curves; the greater the slope, the more yield is lost per unit increase in crown rot pressure. From a comparison of the responses in Figure 1, the varieties Suntop and Sunguard are seen to have near equivalent yield responses to the disease, losing approximately 0.01 t/ha per unit increase in crown rot index. In the case of the varieties EGA Gregory, Lincoln and Caparoi, the rate of change in yield was doubled, with the varieties losing approximately 0.02 t/ha per unit increase in crown rot index.
Of particular note is the response of the variety Suntop. In this case, and at numerous other experiments conducted across the northern grains region (data not shown), the level of disease expressed by Suntop is not indicative of the yield losses incurred by the variety; given the extent of symptoms exhibited, greater yield loss would be expected. This ability to maintain yield in the presence of disease implies the variety has some level of improved tolerance to crown rot.
Yield performance – maximising profitability
The response curves presented in Figure 1 can also be used to determine the point at which growing one variety becomes more profitable than another under crown rot pressure. This comparison involves not only the yields observed, but also the price of grain offered for the different crop types and quality categories. With the higher price recently offered for durum wheat grain relative to bread wheat grain, growers can use the response curves to determine the cross over point in terms of crown rot pressure where it is still more profitable to produce durum wheat (e.g. Caparoi), even though it has poorer resistance and tolerance levels relative to some bread wheat varieties (Sunguard and Suntop).
Outcomes and implications
Response curves provide an additional tool to aid growers in varietal selection decisions to maximise returns in the presence of disease. Response curves describing the impact of crown rot on yield were presented in this paper, however the same approach is being applied by the YRC project to describe yield and grain quality responses to root lesion nematodes, along with foliar diseases of wheat and barley on a national level.
When considering the selection of varieties under crown rot conditions, the response curves presented in Figure 1 pose a number of potential options to growers;
- Consider chasing the superior yield performance of a variety with a high yield potential, that demonstrates improved tolerance to the disease (Suntop), but may potentially result in more inoculum remaining in the system for future rotations, or
- Grow a more resistant variety (e.g. MRMS) that may result in less inoculum in the system (Sunguard); however incur a penalty in terms of lower yield potential.
- Only target production of varieties with reduced tolerance to crown rot (Caparoi and EGA Gregory) in paddocks which are known to have low inoculum levels (e.g. PreDicta B testing or paddock history).
- The response curves can be used to determine the point at which it is more profitable to produce one variety or crop type over another under crown rot pressure (e.g. durum wheat vs bread wheat).
Although measured in this experiment but not presented here, grain quality (protein and screenings) is also an important consideration in the above scenarios, especially given that screenings can be dramatically exacerbated in the presence of crown rot infection in some varieties.
Also demonstrated by this experiment is the impact that other soil-borne pathogens can have on the performance of varieties. In this case, the presence of the root lesion nematode, Pratylenchus thornei (Pt), severely compromised the performance of the variety Lincoln, a known intolerant and susceptible variety to Pt. Therefore, when making varietal selection decisions, it is important to select varieties with desirable defences against target diseases, but also balance the risk associated with other potential pathogens in the system. PreDicta B offers a useful service to identify and quantify the risks associated with measured levels of inoculum of soil-borne pathogens, such as crown rot and Pt, in the cropping system.
Finally it should be emphasised that variety selection is not the sole solution to crown rot. Even though varieties in this experiment demonstrated improved levels of resistance (Sunguard) or tolerance (Suntop and Sunguard), which bettered their yield performance in the presence of crown rot infection, significant yield losses still occurred compared to when no crown rot inoculum was applied. Under the highest disease pressure, Suntop still had a 17% (0.7 t/ha) yield loss when compared to the no applied inoculum treatment, while Sunguard lost 12% (0.5 t/ha). An integrated approach to the management of crown rot is still required to minimise losses from this disease, with the selection of varieties with improved tolerance and resistance only one component of an integrated disease management system.
Acknowledgements
The research undertaken as part of this project is made possible by the significant contributions of growers through both trial cooperation and the support of the GRDC, the author would like to thank them for their continued support. We thank Douglas Lush (DAFQ) for sowing and managing the Macalister experiment and the grower Rob Taylor for kindly providing the trial site.
Contact details
Clayton Forknall
Queensland Department of Agriculture and Fisheries
13 Holberton Street, Toowoomba QLD
Ph: 07 4529 1218
Email: clayton.forknall@daf.qld.gov.au
Steven Simpfendorfer
New South Wales Department of Primary Industries
4 Marsden Park Road, Tamworth
Ph: 02 6763 1261
Email: steven.simpfendorfer@dpi.nsw.gov.au
Alison Kelly
Queensland Department of Agriculture and Fisheries
13 Holberton Street, Toowoomba QLD
Ph: 07 4529 1272
Email: alison.kelly@daf.qld.gov.au
® Registered trademark
GRDC Project Code: DAW00245,
Was this page helpful?
YOUR FEEDBACK