At what stages are wheat, barley, canola, chickpea and field pea most sensitive to temperature and water stress?
Author: M. Fernanda Dreccer (CSIRO Agriculture and Food), Jeremy Whish (CSIRO Agriculture and Food), Francis C. Ogbonnaya Grains Research and Development Corporation (GRDC), Victor Sadras (South Australian Research and Development Institute | Date: 28 Feb 2018
Call to action/take home messages
- Analysis of Australian national variety trials demonstrates impact of climate on wheat, barley, canola, chickpea and field pea grain yield.
- In all crops, higher temperature in the non-stressful range is associated with yield reduction when it occurs before flowering in the north, east and south and in all regions after flowering.
- In cereals, yield loss was greater when high temperature or water stress occurred during stem elongation.
- In canola and pulses, yield loss was greater when high temperature or water stress occurred from shortly before flowering and into pod filling.
- Canola was overall the most sensitive to water stress.
- The interaction between temperature and water stress had a regional pattern.
Background
The purpose of this study was to explore the relationship between weather and grain yield in the Australian cropping belt and identify the stages of vulnerability of winter sown crops with emphasis on temperature and water stress. This paper was part of a GRDC initiative aiming to inform research investment to breed more resilient crops in the face of higher temperatures (2017 third warmest year on record, annual national mean +0.95°C above average), increasing frequency of heat events and declining growing season rainfall (e.g. 11% since the mid-1990s in the southeast), Bureau of Meteorology.
Our work aimed to fill two gaps. First, we focused not only on wheat, but also on crops that have received little attention including barley, canola, chickpea and field pea. Second, we used a comparative approach to illuminate aspects that are overlooked in single-crop studies about the adaptive potential of crops as they are exposed to a variety of weather and soil conditions across the continent in comparable stages of development. Here we present a summary of a full paper.
What we did
We asked the question: which weather variables can help differentiate high vs low yielding situations (90th and 10th yield percentile respectively) in wheat, barley, canola, chickpea and field pea and at which crop stage by region?
To answer this question we linked three sources of information:
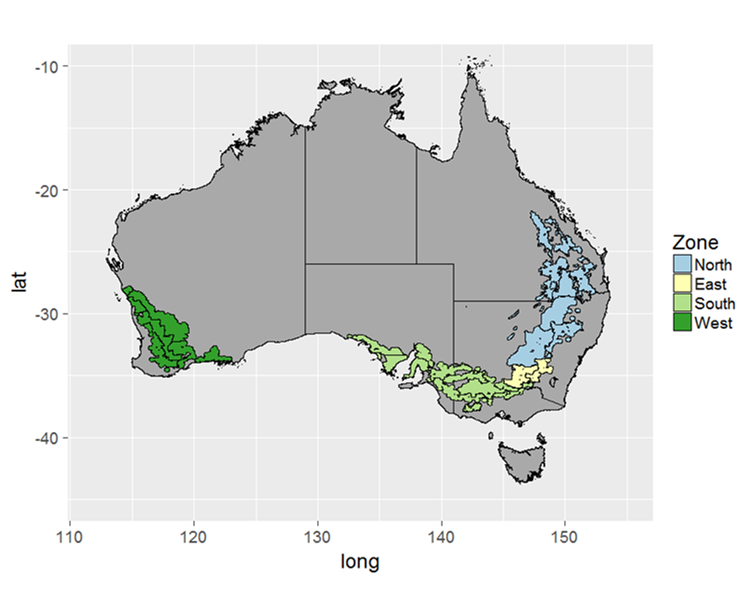
- Grain yield (oil yield for canola) measured in Australia’s national variety trials between 2009 and 2013 in the north, east, south and west regions (Figure 1),
- weather records (Bureau of Meteorology) and
- flowering time for a mid-season maturity type predicted by the crop simulation model APSIM2.
The weather variables studied in relation to temperature were average, maximum (Tmax) and minimum (Tmin) temperature (°C), number of days with potential for damage by frost (Days<=0°C) or heat (Days>=30°C). In relation to water availability, we considered rainfall (mm), vapour pressure deficit (VPD, kPa), which encapsulates how dry and hot the air is, and the water supply vs. demand ratio, or water stress index, based on the plant-soil water balance 3.

Figure 1. Geographical regions as defined in http://www.nvtonline.com.au/
Linking yield and weather using chronological time does not allow us to exploit our current knowledge on the physiology of crops regarding the definition of yield components, therefore, we used degree days (°Cd). Degree days are the units of the plant biological clock, combining time and temperature into a single number. Using this basis allows us to compare weather events in relation to crop stages across regions of widely different temperature regimes. For example, a 100°Cd interval will last 10 days if the average temperature is 10°C and half that time at 20°C, but at the end of the 100°Cd period the crop would have achieved the same developmental stage.
What we found
Is it OK to work with NVT data to learn about crop adaptation?
GRDC National Variety Trials (NVT) are an extensive source of data (combination of years and sites) that can be used to explore the relation between recently released germplasm and vulnerability to weather conditions because, as a whole, they represent relevant conditions in the cropping belt, even when timely operations can be challenging in particular locations. We found that in the 2009-2013 period, the sowing dates did not significantly differ between the lowest (10th percentile) and highest (90th percentile) yields, except for wheat in the west and canola in the south. This makes more reliable the interpretation of the influence of climate variables. In addition, the range of yields in each crop (Table 1) was consistent with reported agronomy yield gap studies. The magnitude of yield variation between trials far outweighed the genotypic variation within a trial; therefore we used site averages to represent a site, except for canola and chickpea, where the average of the best germplasm type for a particular site (e.g. desi instead of kabuli chickpea) was used. Crop presence in a region represents current practices. Note that the number of NVT trials varies per crop and region, wheat and barley and south and west having the highest numbers.
Table 1. Number of trials analysed and mean, median, 10th and 90th percentile grain yield of wheat, barley, chickpea, field pea and oil yield of canola per region.
Crop | NVT Region | Number of trials | Yield (t ha-1) | |||
|---|---|---|---|---|---|---|
Mean | Median | 10th percentile | 90th percentile | |||
Wheat | North | 130 | 3.4 | 3.4 | 2.1 | 4.7 |
East | 36 | 3.5 | 3.6 | 2.0 | 5.2 | |
South | 230 | 3.4 | 3.3 | 1.5 | 5.0 | |
West | 200 | 2.8 | 2.7 | 1.3 | 4.0 | |
Total | 623 |
| ||||
Barley | North | 42 | 3.7 | 3.8 | 2.7 | 4.9 |
East | 39 | 3.3 | 3.3 | 1.7 | 4.7 | |
South | 146 | 3.6 | 5.1 | 2.1 | 5.1 | |
West | 75 | 3.5 | 3.0 | 1.5 | 4.5 | |
Total | 302 |
| ||||
Canola | North | -1 | - | - | - | - |
East | 33 | 0.8 | 0.8 | 0.6 | 1.2 | |
South | 71 | 0.9 | 0.9 | 0.6 | 1.3 | |
West | 81 | 0.8 | 0.8 | 0.4 | 1.2 | |
Total | 185 |
| ||||
Chickpea | North | 47 | 2.1 | 1.9 | 1.0 | 3.3 |
East | -1 | - | - | - | - | |
South | 77 | 1.9 | 1.7 | 0.9 | 3.1 | |
West | 33 | 1.3 | 1.0 | 0.6 | 2.6 | |
Total | 157 | |||||
Field pea | North | -1 | - | - | - | - |
East | 27 | 2.0 | 2.0 | 1.2 | 2.8 | |
South | 107 | 2.5 | 2.4 | 1.4 | 3.5 | |
West | 51 | 1.9 | 1.8 | 0.7 | 3.0 | |
Total | 185 | |||||
1 insufficient data
Which environmental factors worked better at separating low from high yielding crops? Were all crops equally sensitive?
From a water stress perspective, cumulative rainfall was the least and the water supply/demand ratio was the most reliable at discriminating high and low yielding conditions. The water supply/demand ratio (1=no water stress) was able to reconcile differences among crops and regions by integrating the calculated water demand by the crop, differences in rainfall amount and seasonality and soil water storage capacity and plant available water at sowing.
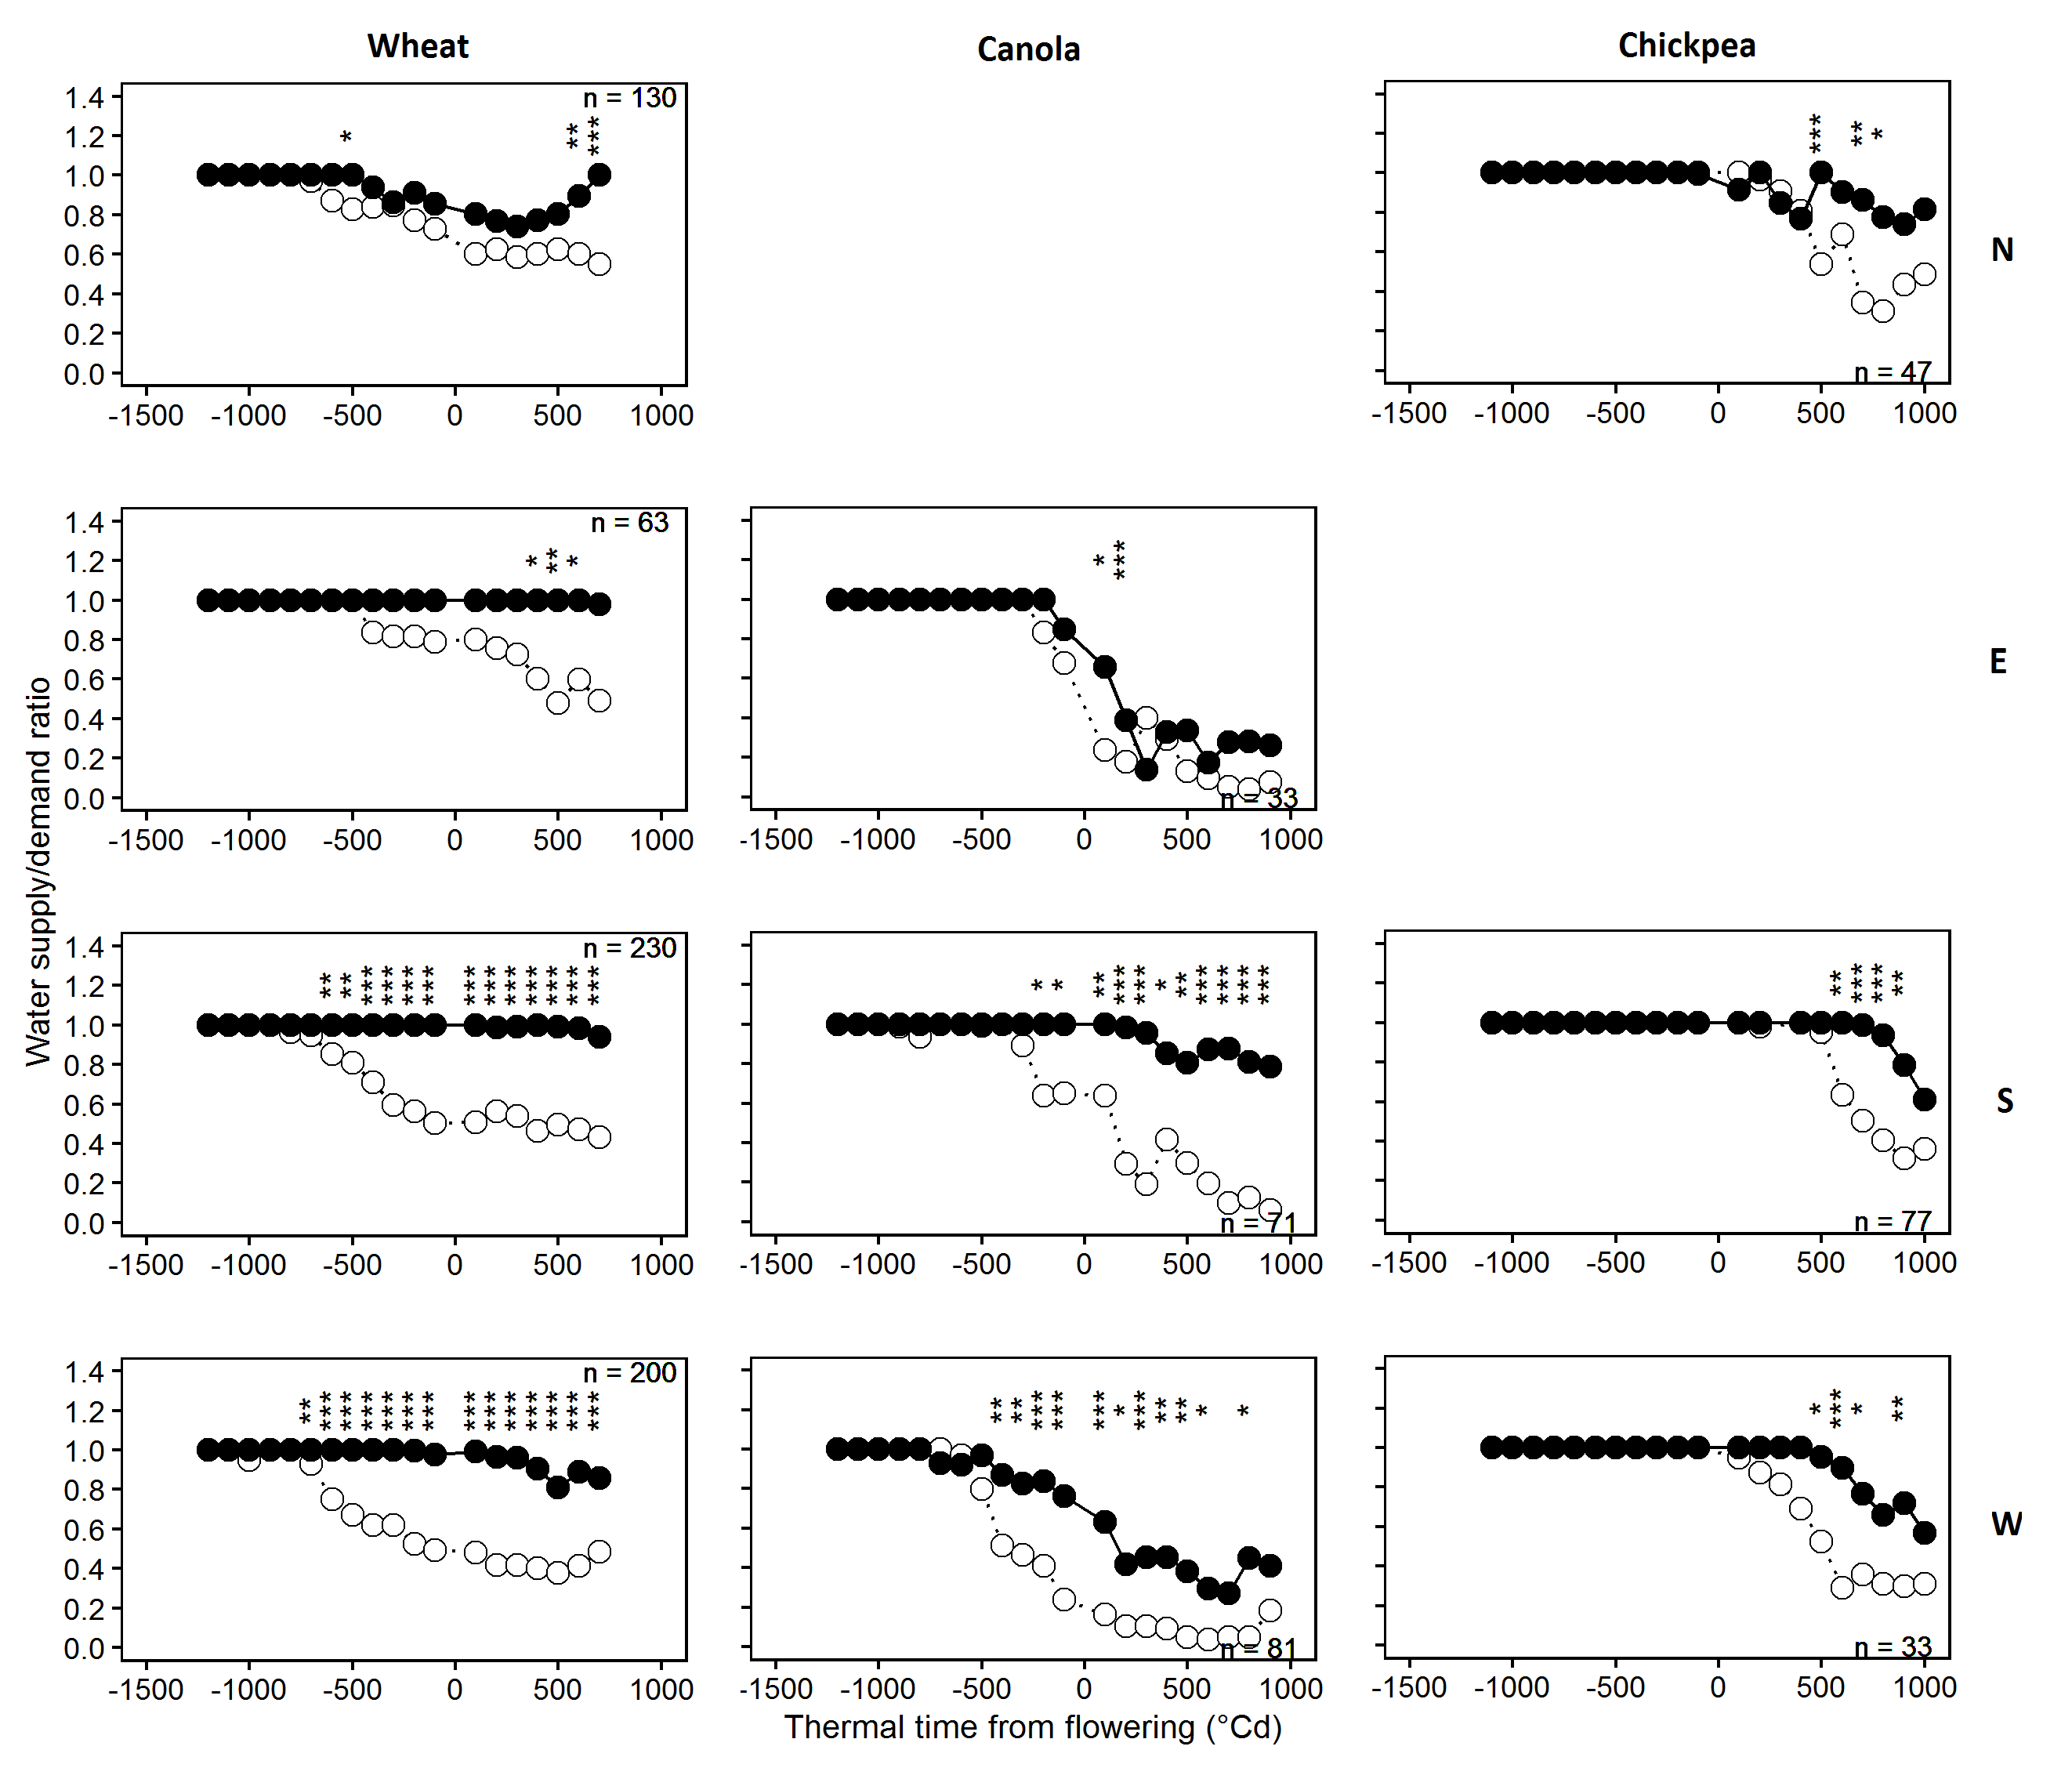
As expected, water stress increased during the season, particularly in low yielding situations, but different patterns of association with yield emerged across regions and crops (Figure 2). In the north and east, summer rainfall and stored soil moisture are an important source of water for crops, whereas crops in south and west depend primarily on in-season rainfall. Accordingly, the association between yield and water stress was stronger in the south and west, than in the north and east.
The timing of onset of water stress separating high and low yielding situations and the sensitivity to water stress differed amongst crops (0°C days represents flowering time in all figures). Regarding the timing, water stress started at tillering in wheat and barley, close to flowering in canola and in mid to late grain filling in chickpea. Regarding the sensitivity, in any region, canola crops experienced the highest water stress (lowest water supply/demand ratio) and high yielding wheat crops were the least stressed.Low yielding wheat crops were more water stressed in the west than in the east or north. Water stress in field pea was low for this data set and unrelated to yield.

Figure 2. Water supply/demand ratio associated with high (90th percentile, black symbols) and low (10th percentile, white symbols) yielding wheat, canola and chickpea crops in the north, east, south and west regions as a function of thermal time centred at flowering (x=0°Cd). Water supply/demand ratio=1 represents no stress. Asterisks indicate significant differences at P<0.0001 (***), P < 0.01 (**) and P < 0.05 (*).
From a temperature perspective, it is worth distinguishing two aspects of warming with different consequences for the crop: an increase in temperature within the non-stressful or benign range that accelerates plant growth and development (e.g. 15 to 16°C), from the stressful or extreme temperatures (e.g. above 30-35 °C), which disrupt processes such as starch synthesis in wheat or oil synthesis in canola.
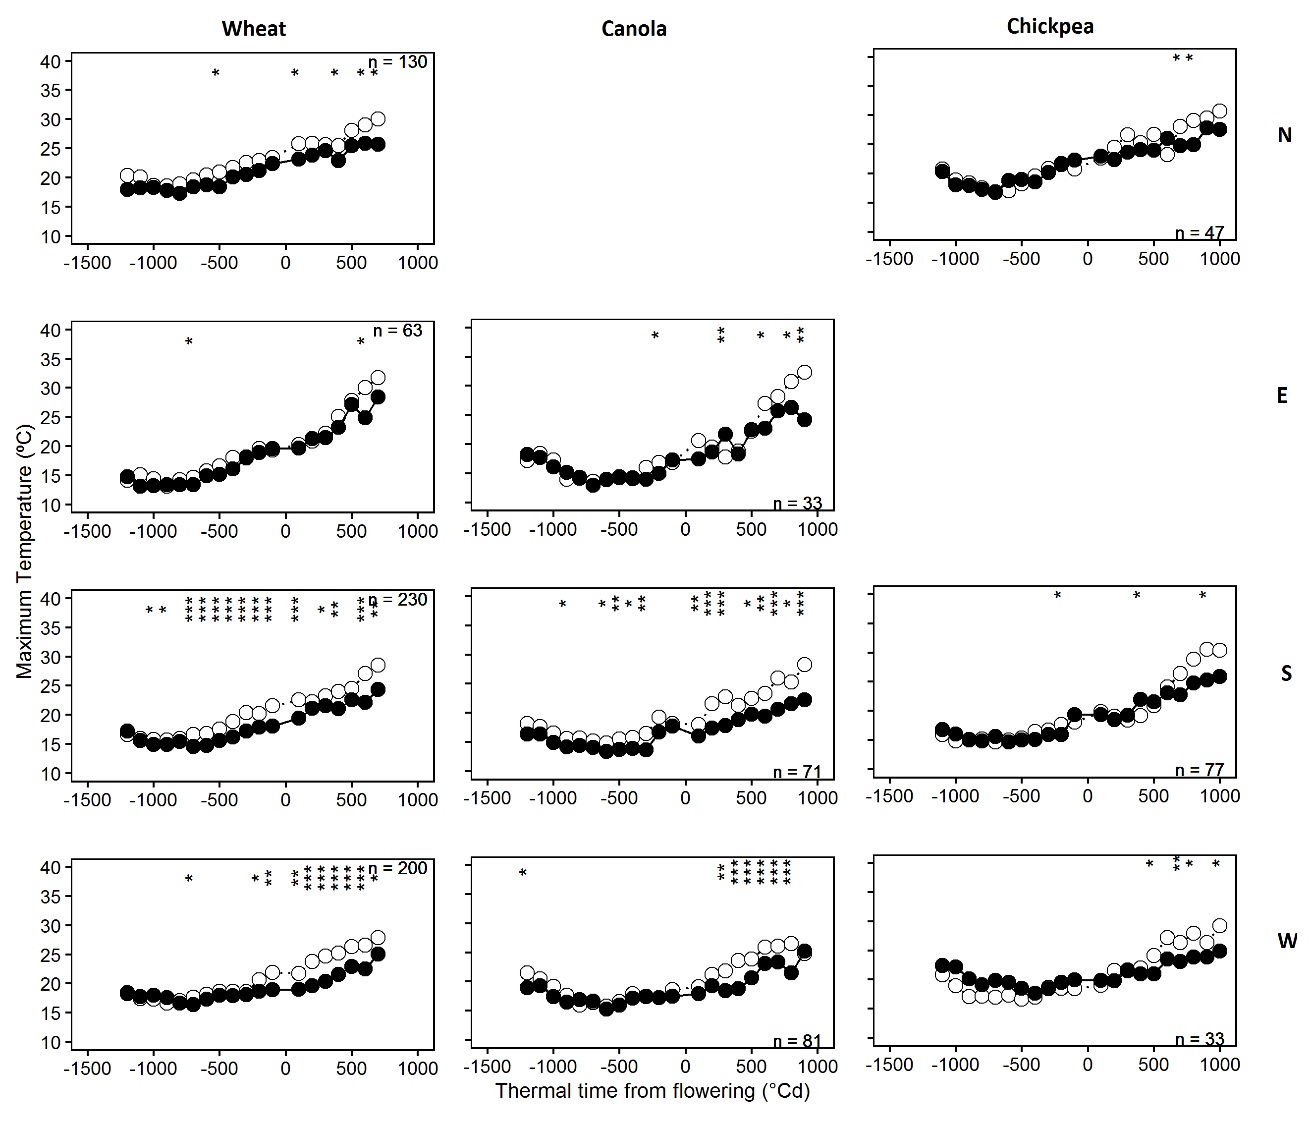
Our expectation was that high maximum temperature (Tmax), particularly in the stressful range, e.g. above 30°C, would be associated with low yields. More generally, the findings indicated that there was a strong and consistent association between high Tmax, even in the non-stressful range, and lower yields (Figure 3). Wheat and barley conformed to a pattern where higher Tmax was related to low yields in the north, practically unrelated in the east, strongly throughout the cycle in the south and more influential towards flowering and grain filling in the west. Canola had an association between low yield and higher Tmax during grain filling in the east, and was similar to wheat and barley in the south and west, whereas chickpea was affected little and late in grain filling.
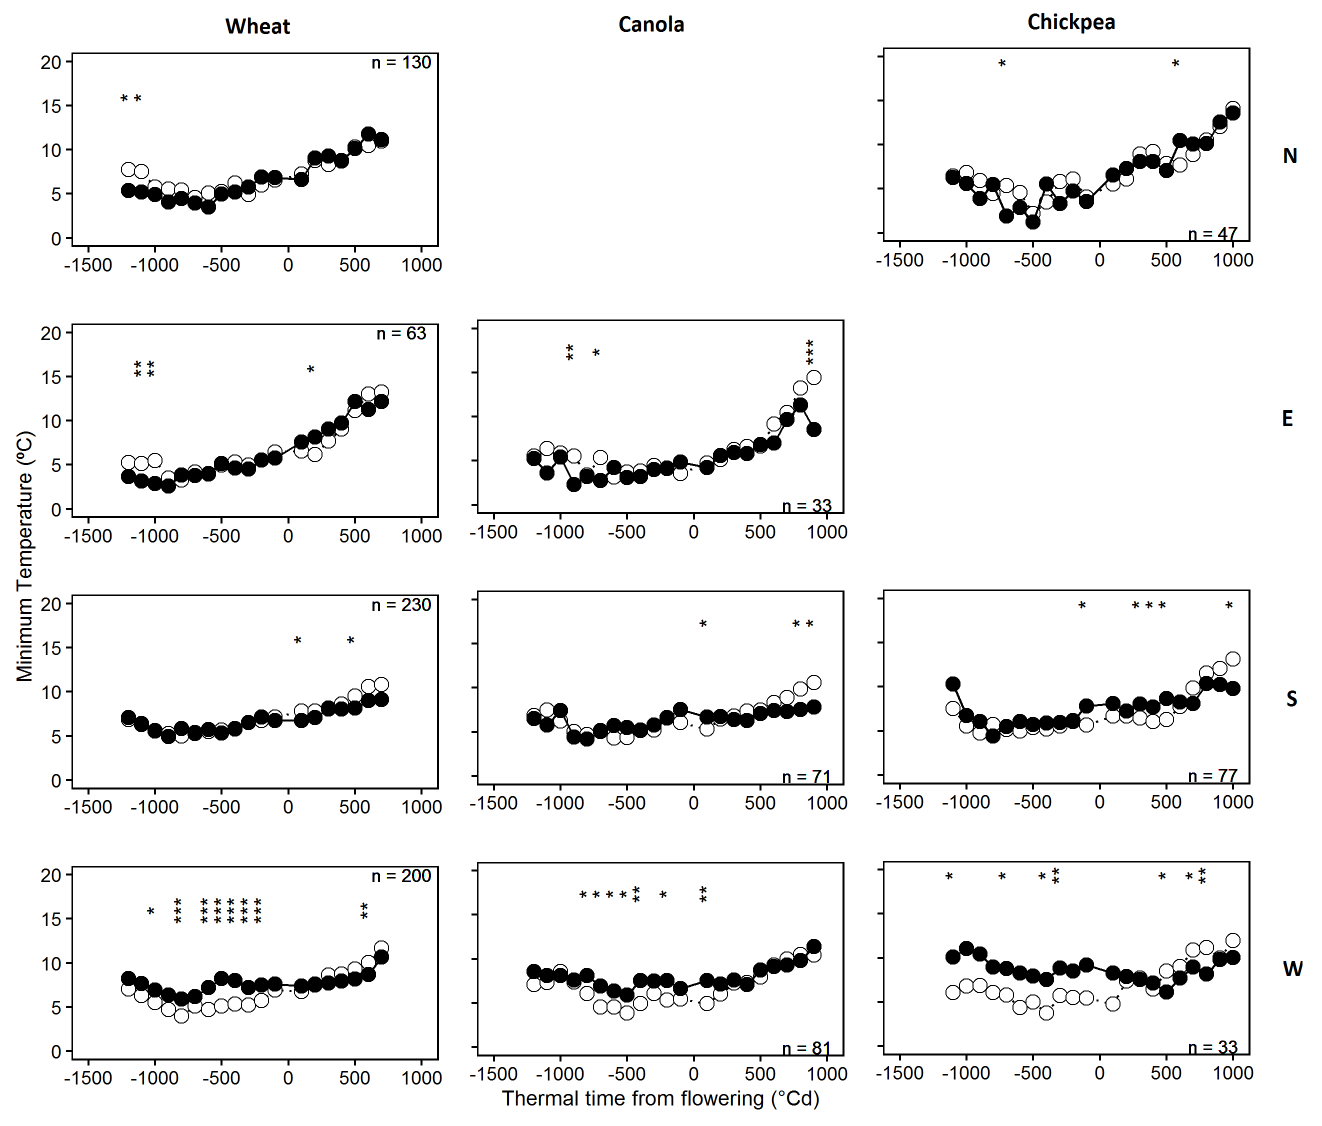
The findings regarding minimum temperature (Tmin) were different between regions and crop stages (Figure 4). Before flowering, specifically during early growth stages for wheat and barley in the north and the east and canola in the east, a higher Tmin was often associated with lower yields. Warmer nights shorten the crop’s cycle, and as less resources are captured, there is a lower potential for yield. By contrast, for all crops in the west, a higher Tmin during tillering and stem elongation in the cereals and before flowering in canola, chickpea and field pea, was associated with higher yields. We expect this is the result of an interaction with water supply. Crops experiencing higher Tmin early in the season, cover the ground quickly and reduce direct evaporation from soils with limited water holding capacity, resulting in a more favourable water balance compared to low yielding crops. In the case of chickpea, higher Tmin may also reduce flower abortion.
By contrast, after flowering, higher Tmin was associated with lower yields across crops and regions where a significant effect was detected, as expected from warmer nights shortening the calendar time for grain filling 4.

Figure 3. Maximum temperature associated with high (90th percentile, black symbols) and low (10th percentile, white symbols) yielding wheat, canola and chickpea crops in the north, east, south and west regions as a function of thermal time centred at flowering (x=0°Cd). Asterisks indicate significant differences at P<0.0001 (***), P < 0.01 (**) and P < 0.05 (*).

Figure 4. Minimum temperature associated with high (90th percentile, black symbols) and low (10th percentile, white symbols) yielding wheat, canola, chickpea and field pea crops in the North, East, South and West regions as a function of thermal time centred at flowering (x=0°Cd). Asterisks indicate significant differences at P<0.0001 (***), P < 0.01 (**) and P < 0.05 (*).
Conclusions
Our comparative approach revealed that the most sensitive stage to temperature and water stress coincided with the window when the grain number is being formed, the most important component of yield. In wheat and barley, it was confirmed as the period during stem elongation when the spike is growing and forming fertile florets (precursors of grains), extending to shortly after flowering during grain set. In canola and chickpea, the critical window for yield formation started shortly before flowering and extended further into grain filling as flowering and pod growth overlap.
Our study supports that in all crops, higher temperature in the non-stressful range is associated with yield reduction when it occurs before flowering in the north, east and south and in all regions after flowering. While wheat and chickpea were sensitive to temperatures above 30°C from early and late in grain filling respectively, chickpea was sensitive to low temperatures from flowering and canola was overall the most sensitive to water stress. Furthermore, the interaction between early growth and drought has regional relevance.
Acknowledgements
This work was supported by the Grains Research and Development Corporation of Australia (GRDC), the Commonwealth Scientific and Industrial Research Organisation (CSIRO) and the South Australian Research and Development Institute (SARDI). Special thanks to Tom Giles (GRDC) and team who facilitated access to NVT data.
References
Dreccer, M. F., Fainges, J., Whish, J., Ogbonnaya, F. C. & Sadras, V. O. Comparison of sensitive stages of wheat, barley, canola, chickpea and field pea to temperature and water stress across Australia. Agric. For. Meteorol. 248, 275-294, (2018).
Holzworth, D. P. et al. APSIM – Evolution towards a new generation of agricultural systems simulation. Environmental Modelling & Software 62, 327-350, (2014).
Chapman, S. C., Cooper, M., Hammer, G. L. & Butler, D. G. Genotype by environment interactions affecting grain sorghum. II. Frequencies of different seasonal patterns of drought stress are related to location effects on hybrid yields. Aust. J. Agric. Res. 51, 209-221 (2000).
García, G. A., Serrago, R. A., Dreccer, M. F. & Miralles, D. J. Post-anthesis warm nights reduce grain weight in field-grown wheat and barley. Field Crop. Res. 195, 50-59, (2016).
Contact details
Fernanda Dreccer
CSIRO Agriculture and Food
Mb: 0408 885 137
Email: Fernanda.dreccer@csiro.au
GRDC Project Code: JPA00003,
Was this page helpful?
YOUR FEEDBACK
