Detection and monitoring of cabbage aphids in dryland canola
Author: Dusty Severtson, Rob Emery (Department of Primary Industries and Regional Development) Nicolas Garel (ngperceptive) | Date: 13 Feb 2018
Take home messages
- Rapid decision-support: CropScout is a new smartphone app which automates the sequential sampling process for cabbage and turnip aphids in winter/spring canola and maps results relative to the spray threshold, as a targeted sampling and spray decision tool.
- This field intelligence can be used to optimise spray timing and, where possible, to target sprays to pest infestations where they are aggregated, such as along crop edges, in a portion of a crop or between paddocks.
- The canola aphid module is the first, with others in development.
Background
Rapid inspection of crops for pests and diseases is prone to error because of spatial variability and aggregation (i.e. edge effects and hotspots). The CropScout app uses the canola aphid sequential sampling plan which is designed to decrease the number of plant inspections required to assess aphids in canola, at a set level of accuracy, relative to a spray threshold of 20% of plants infested with cabbage or turnip aphids on the racemes (Severtson et al. 2016).
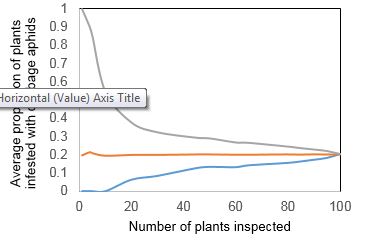
Figure 1 shows that average infestation levels estimated from assessments of canola aphids can be easily over or under-estimated. For example, although the overall average aphid infestation levels in the New Norcia crop were approx. 20% (i.e. 0.2 proportion) of plants infested, inspecting 10 plants could result in as low as 0% (none detected) or as high as 50% of plants infested with aphids. Even sampling 50 plants could result in averages as low as 10-15% or as high as 30% of plants infested.
Figure 1. Sampling statistics from a flowering canola crop at New Norcia, WA, showing the maximum, minimum and overall average (middle line) from 1000 plant inspections throughout the crop.
Results and discussion
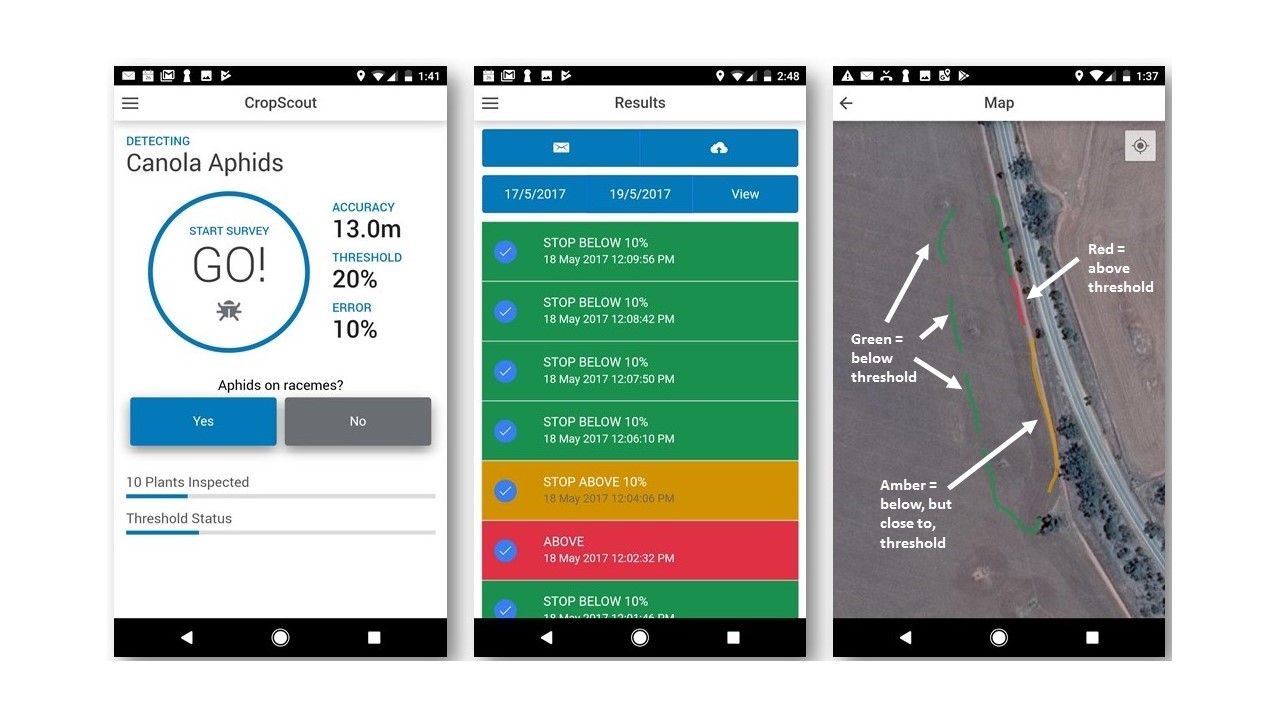
Cabbage and turnip aphids are often aggregated along crop edges where they have initially colonised the crop, unless the crop is patchy or has been moisture stressed during aphid colonisation in which case aphids often continue to spread further inwards. The user inspects canola plants in a transect starting along crop edges, and the CropScout app automates the calculations in the background and stops when there is 90% confidence that the areas sampled are either 1) above threshold (mapped as red=above threshold), 2) below threshold (mapped as green=below threshold) and below but close to threshold (mapped as amber=below, but close to threshold) (Figure 2). Maps produced on the phone and on the user’s CropScout online personal page (mypestguide.agric.wa.gov.au/cropscout) are displayed as coloured polylines, enabling a whole-paddock or multi-paddock view of where crops were inspected for aphids and what the spray threshold results were for those locations.
Features of the CropScout app
The main features of the CropScout app include:
- Runs field sampling algorithms in the background to optimise time and labour.
- Automatic GPS recording, even out of mobile and WiFi range.
- Reduces the number of plant inspections (effort) required relative to a spray threshold.
- Ability to record field name, plant growth stage and notes for each sampling run.
- Ability to change the spray threshold and error rate parameters.
- View personal surveys on a map online, colour-coded according to spray threshold results.
- In addition to above and below threshold results, the app gives an indication of 'caution' where results are below, but close to, spray threshold.
- Exports field sampling results to the cloud or as a spreadsheet for record keeping and sharing with clients.

Figure 2. Three mobile phone screen views of the CropScout app showing the sampling interface (left), results list with data export/sync tools (middle) and colour coded maps of spray threshold results (right).
The CropScout app was released on iTunes and Android stores on 31 July, 2017 as part of the MyPestGuide suite of apps from the Department of Primary Industries and Regional Development (DPIRD). The canola aphid module is the first with others being developed including a cereal aphid sampling module.
Conclusion
Current mobile device technology can be used to benefit growers and consultants in the Australian grains industry through rapid and improved spray decision-support, harnessing their existing GPS receivers. Tools that improve the accuracy and decrease time spent on pest and disease diagnosis in the field will give growers a better ability to spray pesticides when required, saving them money on unnecessary sprays, and reducing the risk of further development of pesticide resistance through overuse of pesticides.
Useful resources
References
Severtson, D., Flower, K., and Nansen, C. (2016). Spatially-optimized sequential sampling plan for cabbage aphids Brevicoryne brassicae L. (Hemiptera: Aphididae) in canola fields. Journal of Economic Entomology, 109(4), 1929-35.
Acknowledgements
The background research integrated into the CropScout app is made possible by the significant contributions of growers through both paddock survey cooperation and the support of the GRDC — the authors would like to thank them for their continued support. Funding for app development was from the Department of Primary Industries and Regional Development’s Boosting Grains R&D Flagship.
Contact details
Dusty Severtson
DPIRD, 75 York Road, Northam WA 6401
0427 196656
dustin.severtson@dpird.wa.gov.au
@DAF_WA
GRDC Project Code: UWA00158,
Was this page helpful?
YOUR FEEDBACK

