How widespread are different types of resistance in central NSW – new survey data. How different farming systems select for different types of resistance in key weeds.
Author: John Broster, Allison Chambers, Leslie Weston and Michael Walsh | Date: 27 Feb 2018
Call to action/take home messages
- In central NSW a significant proportion of paddocks surveyed contain ryegrass resistant to one or more herbicide groups.
- Group A fop resistant wild oats are more prevalent in central NSW than in NSW overall.
- Despite resistance, most weed populations are still present below one plant per metre square at harvest time.
- Management practices do influence resistance development, but the high levels of resistance mean the relationships are harder to determine.
Herbicide resistance surveys
Since 2007 as part of several GRDC funded projects, Charles Sturt University has been conducting annual surveys to determine the level of herbicide resistance across the cropping regions of NSW. Each year a specific region of NSW is surveyed with the aim of re-surveying each region on a five year cycle. During the surveys, whenever present, samples are collected of ryegrass, wild oats, barley grass, brome grass, wild radish, Indian hedge mustard and wild radish. This enables the reporting of:
- Differences between regions as to the extent of herbicide resistance and
- The rate of increase between surveys.
At the same time as the sample collection the densities of the collected species and any other species in the paddock are estimated. Densities are classified as very low (occasional plant), low (<1 plant/m2), medium (1-10 plants/m2), high (>10 plant/m2) and very high (>10 plant/m2 and dominating crop). To allow for differences in biomass and competitiveness, species smaller than ryegrass have higher thresholds, while those larger have lower thresholds.
Results and discussion
Weed species present
Over this period, 1528 paddocks (Figure 1) have been visited across NSW, resulting in 939 ryegrass, 777 wild oat, 148 barley grass, 133 brome grass, 356 sow thistle, 76 wild radish and 76 Indian hedge mustard samples being collected for resistance screening. Despite the presence of herbicide resistance in all species, and for some species in the majority of populations, many of the weeds are present only in low densities (Figure 2).
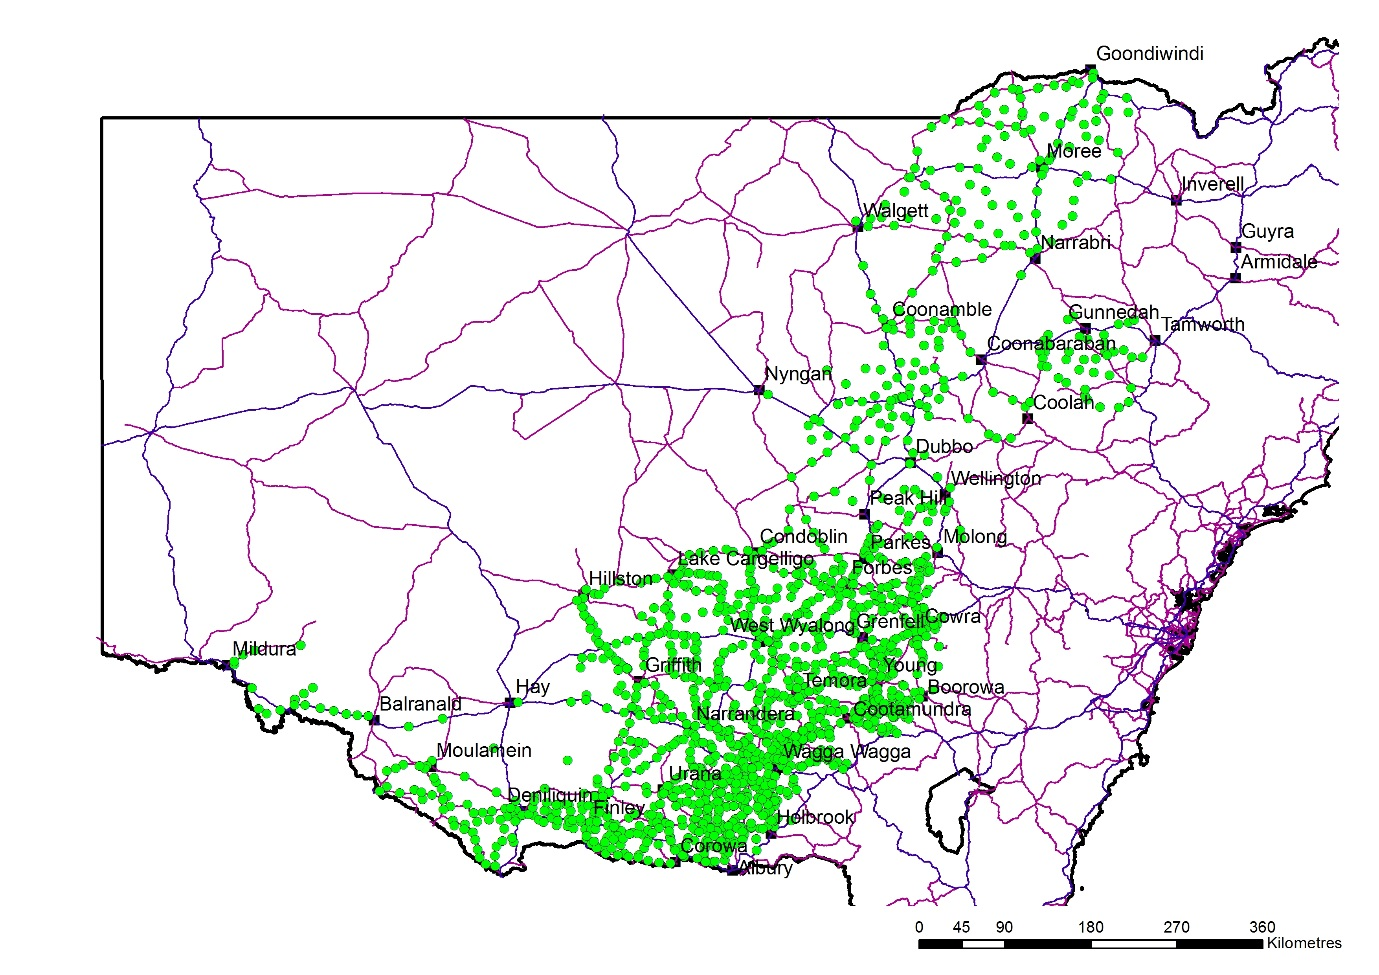
Figure 1. Locations visited for collection of samples during surveys (2007-2017)
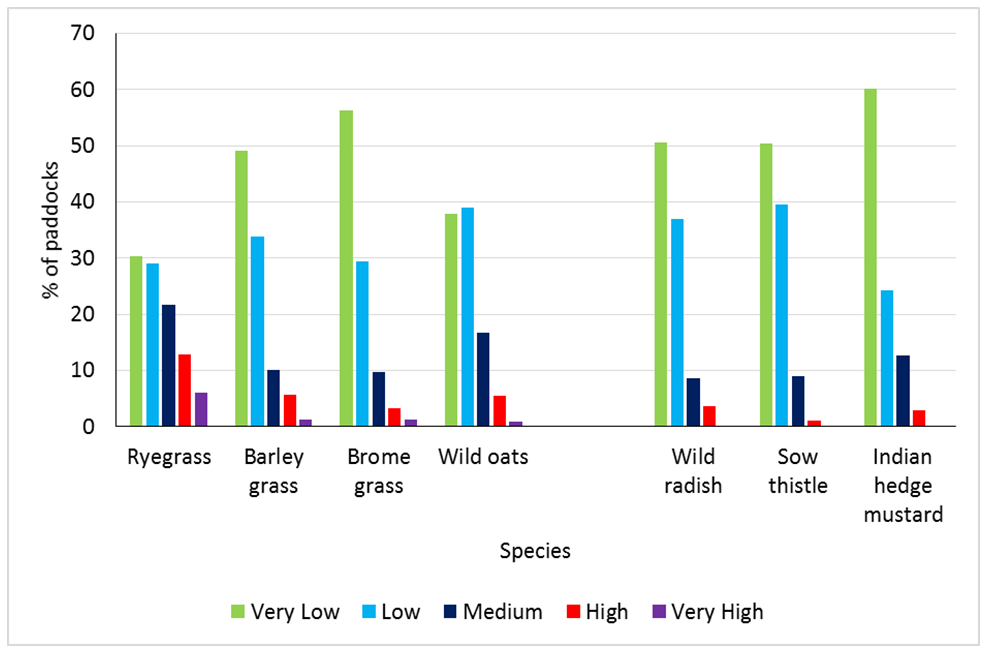
Figure 2. Density of different weed species across all surveys between 2010 and 2017
Ryegrass
Results from the latest surveys across the Australian cropping region show that approximately two thirds of ryegrass populations are resistant Group A fop herbicides, with a similar level of resistant to Group B herbicides (Table 1). The extent of resistance to both the Group A dim herbicide clethodim and Group D herbicides is lower but still at a significant level of 17% of populations. Five percent of populations across New South Wales (NSW), Western Australia (WA) and Tasmania were classed as resistant to glyphosate (not tested in South Australia (SA) or Victoria). The extent of resistance across NSW was similar to that of the overall level for the Australian cropping region, with WA having the highest resistance levels for all herbicides (Table 1).
The extent of resistance varies markedly across the different survey regions in NSW. For the Group A (fop and dim) and B (SU and Imi) herbicides, a greater percentage of populations were resistant in the slopes (approximately between Newell and Olympic Highways north of the Sturt Highway), higher rainfall (approximately east of the Olympic Highway) and southern (south of Sturt Highway and east of Newell Highway) regions (Table 2). The extent of Group D resistance was highest in the slopes and southern regions, with the other regions having few populations resistant to trifluralin.
Table 1. Extent of herbicide resistance in ryegrass populations from the most recent surveys across Australia and differences between States. Resistance levels are as defined by the various researchers.
Australia | NSW | WA | SA | Victoria | Tasmania | |
|---|---|---|---|---|---|---|
A fop | 64 | 64 | 96 | 48 | 50 | 46 |
A dim | 17 | 10 | 42 | 16 | 8 | 8 |
B SU | 63 | 56 | 98 | 73 | 26 | 16 |
B Imi | - | 48 | - | - | - | 20 |
D | 17 | 11 | 27 | 25 | 2 | 8 |
J/K | - | 0 | - | - | - | 0 |
K | - | 0 | - | - | - | 0 |
M | 5 | 3 | 7 | - | - | 0 |
Samples | 2039 | 597 | 466 | 606 | 318 | 52 |
Data: NSW – Broster unpublished data (Broster et al. 2011; Broster et al. 2013), WA - (Owen et al. 2014), SA and Victoria - (Boutsalis et al. 2012), Tasmania - (Broster et al. 2012)
Among the other regions the extent of Group A fop and B resistance was only slightly lower in the Plains (approximately east of Newell Highway, and north of Irrigation Way and Kidman Way) region but Group A dim and D resistance was markedly lower. The regions with the lowest levels of resistance to the selective herbicides, the Western (approximately west of Newell Highway, Irrigation Way and Kidman Way) and Northern (north of Peak Hill, Dubbo and Wellington) had the greatest percentage of populations resistant to glyphosate (Table 2).
As several of these regions join in the Central West the results for samples collected south of Coonabarabran and north of the Lachlan River were consolidated for the region. For most herbicides the findings were similar to NSW with 66% of samples resistant to Group A fop, 8% to A dim, 7% to trifluralin and 2% to glyphosate. Only the Group B herbicides had lower resistance levels with 43% resistant to Group B SU and 41% to Group B Imi.
Table 2. Extent of herbicide resistance in ryegrass populations from the most recent surveys for various regions within NSW. Data is total of both resistant (>20% survival) and developing resistant (10-20% survival) populations.
Southern | Slopes | High rainfall | Western | Northern | Plains | |
|---|---|---|---|---|---|---|
A fop | 79 | 90 | 84 | 23 | 44 | 71 |
A dim | 20 | 18 | 17 | 5 | 2 | 5 |
B SU | 78 | 70 | 77 | 36 | 29 | 47 |
B Imi | 56 | 50 | 87 | 30 | 33 | 44 |
D | 21 | 25 | 2 | 7 | 1 | 3 |
J/K | 0 | 0 | 0 | 0 | 0 | 0 |
K | 0 | 0 | 0 | 0 | 0 | 0 |
M | 0 | 3 | 0 | 6 | 10 | 1 |
Samples | 96 | 115 | 64 | 117 | 94 | 111 |
Of the 597 ryegrass populations collected across NSW in the most recent surveys for each region, 497 of these had enough seed to be tested to five selective herbicide groups; A fop, A dim, B SU, B Imi and D. Nearly a quarter of these populations (121) were susceptible to all these herbicides, however 105 of these were, as would be expected, from the regions with the lowest resistance levels (plains, western and northern) (Figure 3). Overall, nearly half of these samples were resistant to three or more herbicide groups, limiting farmer options for ryegrass control with eight of the populations resistant to all five herbicides.
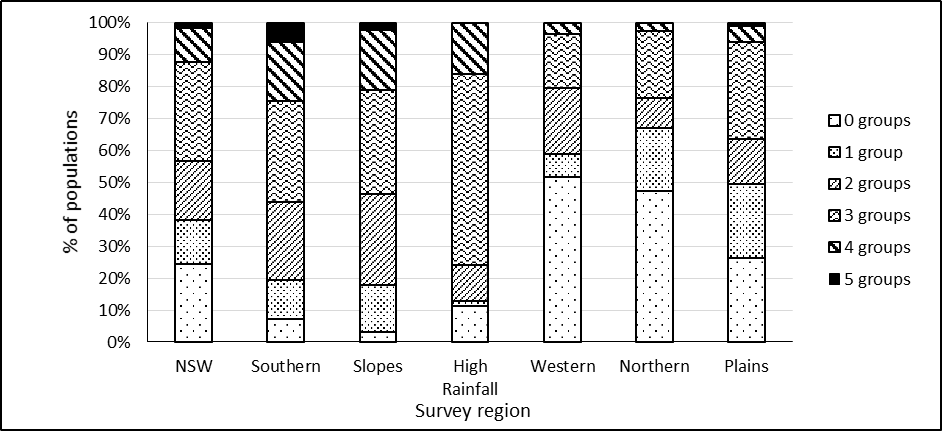
Figure 3. Level of cross resistance for ryegrass populations screened to five herbicide groups in NSW resistance surveys
Previous research from the Charles Sturt University (CSU) herbicide resistance testing service has shown there is minimal difference between the A fop herbicides with regard to resistance development with 97% of populations tested to diclofop-methyl and haloxyfop having the same resistance status (Broster and Pratley 2006) and no difference between fops and dens (Broster and Pratley unpublished data). However, there are differences between dim herbicides with only 31% of samples screened to both tralkoxydim and clethodim having the same resistance status (Broster and Pratley unpublished data). In the surveys where samples were tested to both of these herbicides the extent of resistance was much lower to clethodim than tralkoxydim. This was also reported in the SA and Victorian surveys (Boutsalis et al. 2012).
Of the 847 ryegrass samples that were tested to both SU and Imi herbicides 686 (81%) had the same resistance status, slightly higher than the 70% of samples having the same resistance status when tested to both by the CSU herbicide resistance testing service. These results show that when resistance occurs to both dims and Group B herbicides there may still be options within those groups to successfully control the weeds.
Wild oats
The extent of herbicide resistance in wild oats is much lower than the ryegrass with 37% of populations resistant to group A fops across NSW. Only two wild oat populations collected in the surveys were classed as resistant to clethodim, however in a previous survey where no samples were resistant to clethodim, 14% of populations tested to tralkoxydim were resistant. The CSU herbicide resistance testing service has found 2% of wild oat populations (16/718) tested to clethodim to be resistant, compared to 40% (32/81) to tralkoxydim. This shows resistance is developing to dim herbicides and care needs to be taken to maximise the effective use of clethodim. Similar to ryegrass there are differences regarding the extent of herbicide resistant wild oat population for the survey regions with the higher rainfall, more intensively cropped regions having the higher resistance levels (Table 3).
A greater proportion of wild oat populations from the central west region were resistant to group A fop than for NSW overall (54% compared with 38%), for the other screened herbicides the extent of resistance was similar.
Table 3. Extent of herbicide resistance in ryegrass populations from the most recent surveys for various regions within NSW. Data is total of both resistant (>20% survival) and developing resistant (10-20% survival) populations.
NSW | Southern | Slopes | High rainfall | Western | Plains | |
|---|---|---|---|---|---|---|
A fop | 38 | 36 | 57 | 46 | 12 | 41 |
clethodim | 1 | 0 | 0 | 0 | 0 | 2 |
B SU | 8 | 0 | 1 | 53 | 6 | 0 |
J | 0 | 0 | 0 | 0 | 0 | 0 |
Samples | 336 | 39 | 98 | 35 | 94 | 70 |
Barley grass and brome grass
Eight percent of the 109 barley grass populations screened were resistant to group B SU herbicides with populations also resistant to group A fop and paraquat. The majority of the resistant populations came from the western region. A total of 88 brome grass populations have been screened for resistance with all populations from the slopes, plains or higher rainfall regions susceptible to all tested herbicides. Of the 31 populations from the Western survey, 28% were resistant to Group B SU herbicides, 13% to Group B Imi and 11% to Group A fop herbicides.
Wild radish, sow thistle and Indian hedge mustard
Forty nine wild radish populations have been collected for resistance screening with low levels of resistance found to group B SU (13%), Imi (5%), C (4%) and F (4%). This is significantly lower than reported in the most recent WA survey (Owen et al. 2015). This is most likely a reflection of the lower number of wild radish populations and plants treated with herbicides when compared to WA. However, these results show that resistance is developing to wild radish in NSW and farmers must manage their weed control to prevent resistance reaching the extent found in WA.
Of the 212 sow thistle populations collected 51% were resistant to group B SU and 2% to group I herbicides. Resistance was highest in the plains region (69%) and lowest in the slopes (43%) with the other regions having similar resistance levels.
Resistance has been found in 44 Indian hedge mustard populations that have been collected during the resistance surveys with 16% resistant to groups B and 2% to group I herbicides. No populations were resistant to group B Imi, C, F or M.
Relationship with farming system
With increasing levels of herbicide resistance across the state, it is becoming increasingly difficult to correlate management practices with resistance, as in many regions populations are resistant to three of four herbicide groups (Figure 3). However some relationships are still noticeable.
The extent of resistance to the group M herbicides, while relatively low across NSW, is concentrated in several areas (Figure 4). The shires with the highest glyphosate resistance are those with a high potential for growing summer crops, either dryland or irrigated, with ryegrass as a common weed species. The extensive use of glyphosate in maintaining clean winter fallow has led to a greater extent of glyphosate resistance. The other shires with glyphosate resistance are those with higher rainfall, high intensity and input cropping systems in which the ryegrass populations are resistant to a large number of the selective herbicide groups.
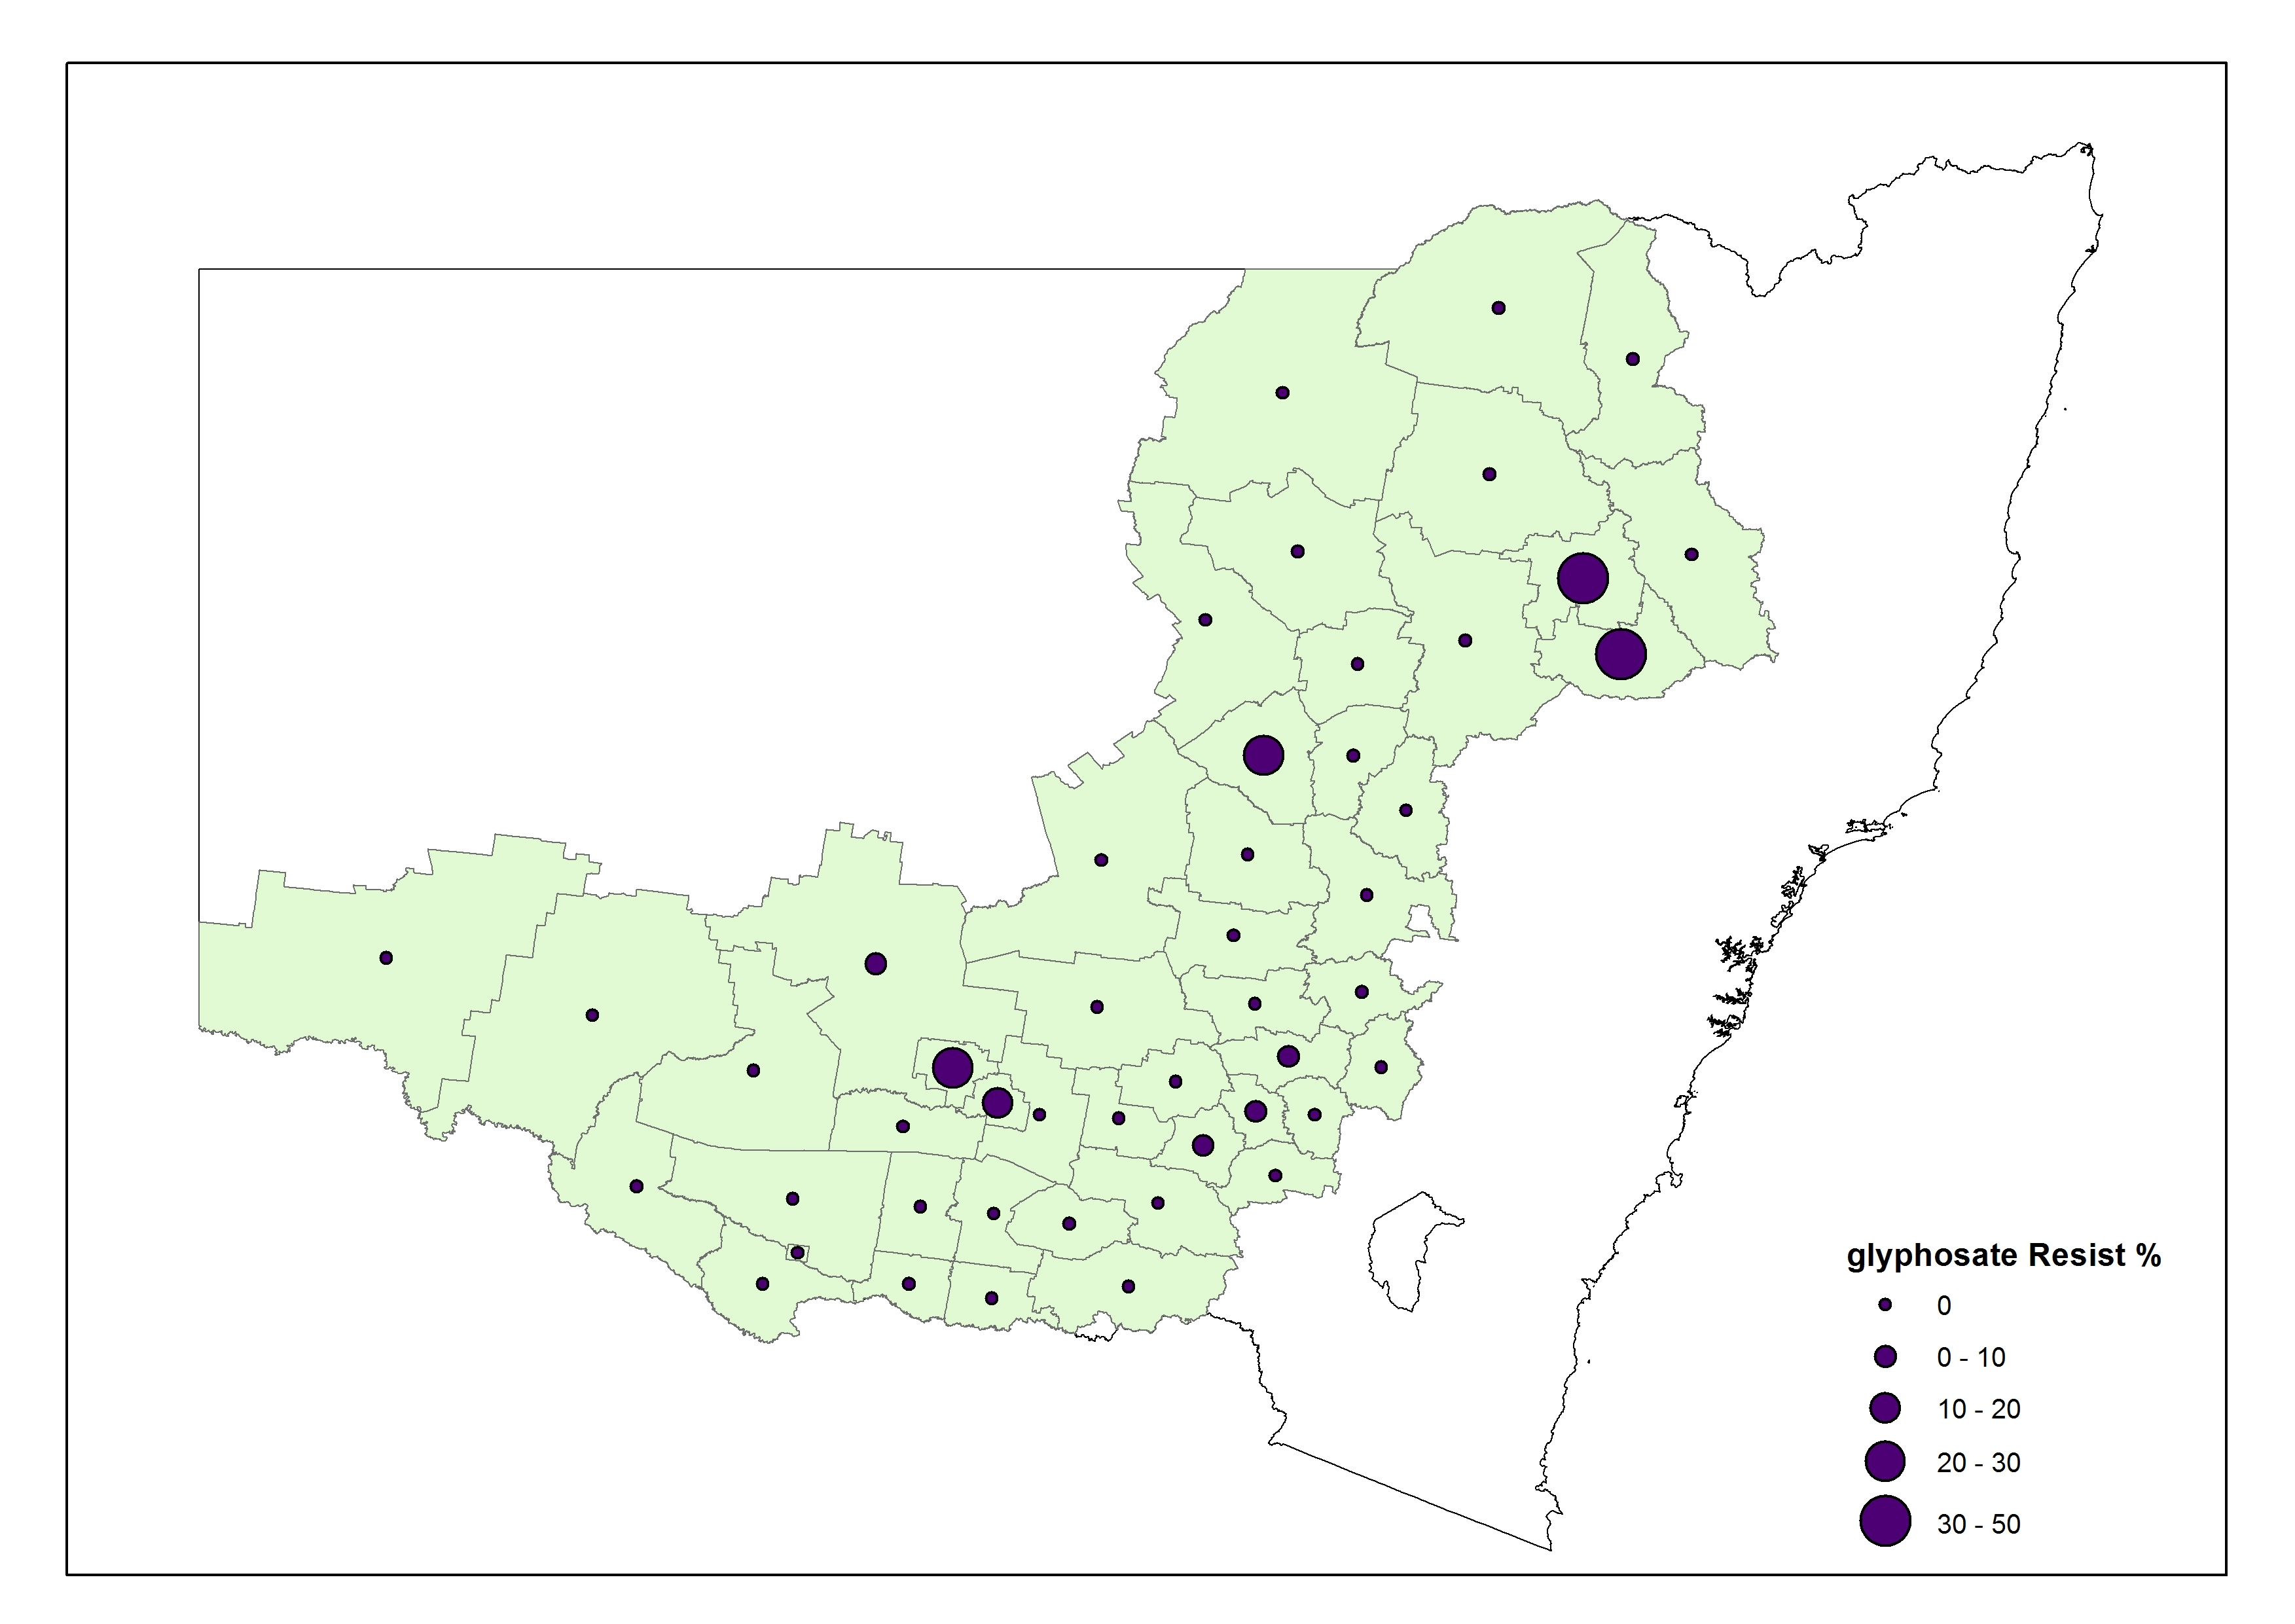
Figure 4. Extent of group M resistance across surveyed area
Shires that grew more canola were associated with higher levels of resistance, both in number of selective groups resistant and resistant to individual herbicide groups (Figures 5 and 6). This may be not directly related to the canola but that the areas that can grow canola are also those with higher rainfall and higher inputs - especially herbicides. This was most apparent in the relationship between canola and group D resistance (Figure 6).
Group B and D resistance levels were much lower in northern NSW. Wheat, barley and chick peas were the most common crops sampled during the 2016 resistance survey in northern NSW. While trifluralin can be used in all three and group B SU herbicides in wheat and barley, these are areas with summer cropping growing sorghum, cotton, sunflower and maize. The plantback period for both trifluralin and the sulfonylurea herbicides for both maize and sorghum is 12 months (Fleming et al. 2012). This would limit their use in this region where these summer crops are grown.
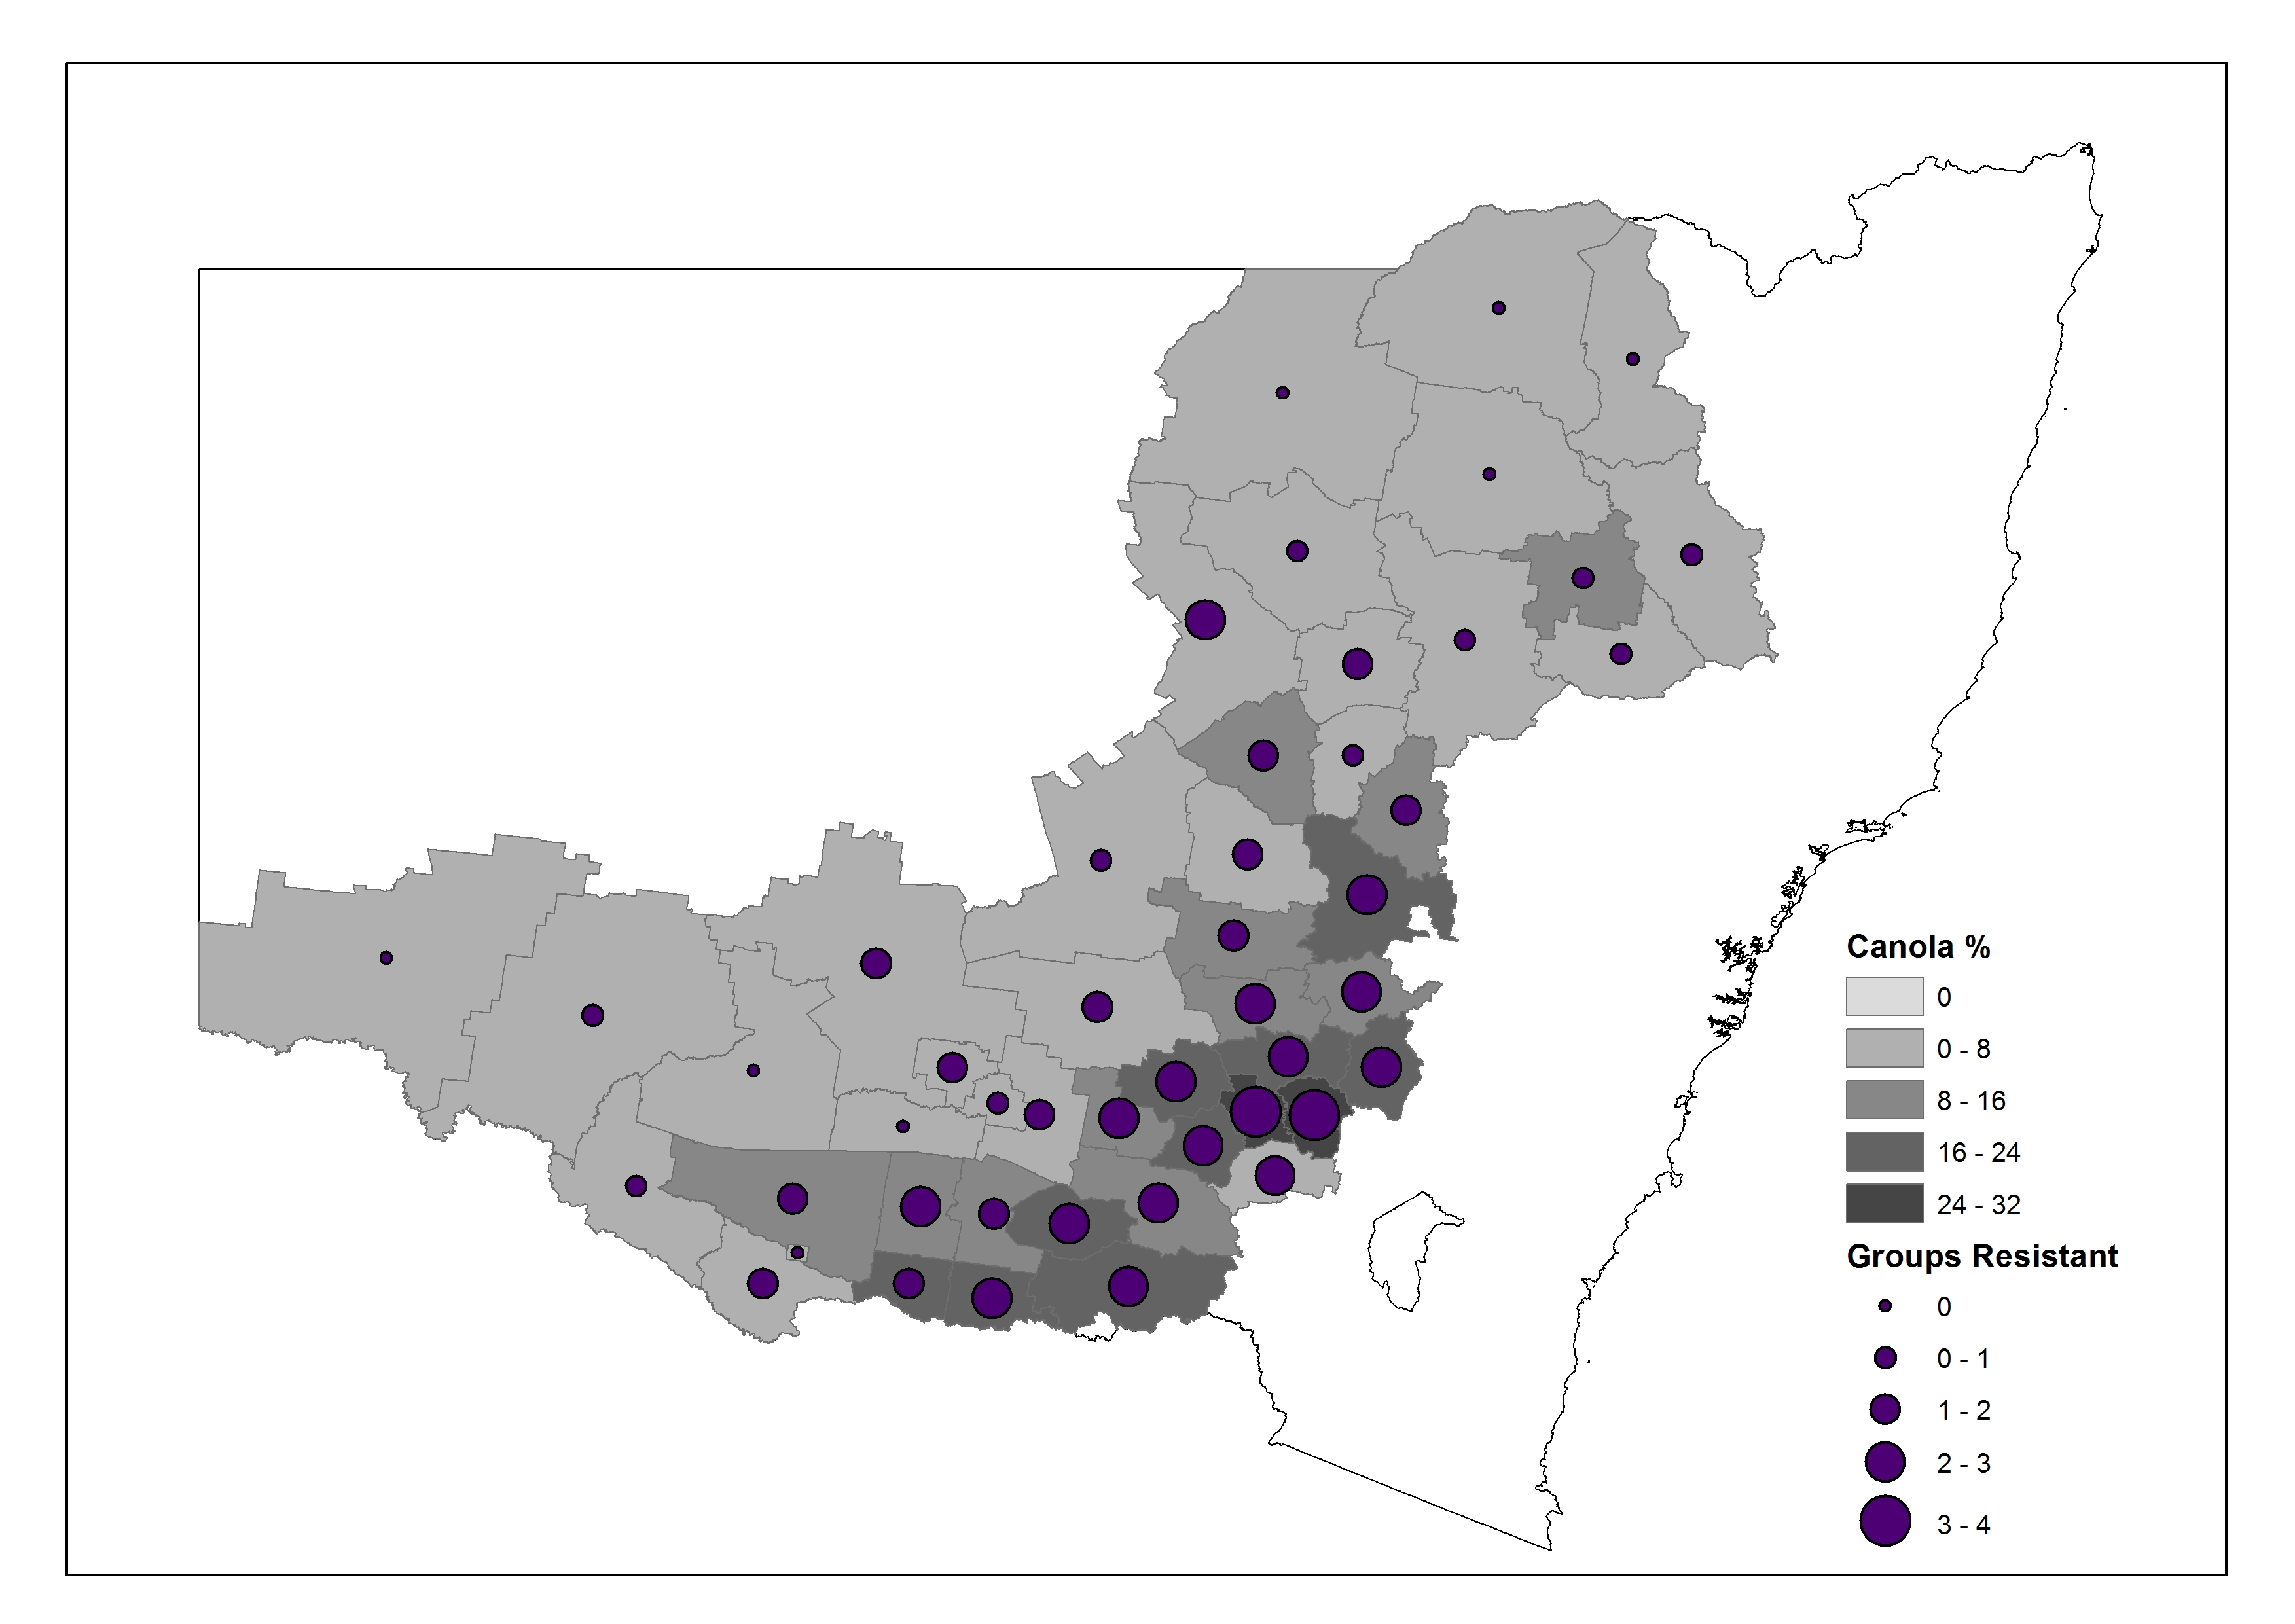
Figure 5. Map showing annual percentage of each shire sown to canola and average number of resistant selective herbicide groups (A fop, A dim, B SU, B Imi and D) for ryegrass
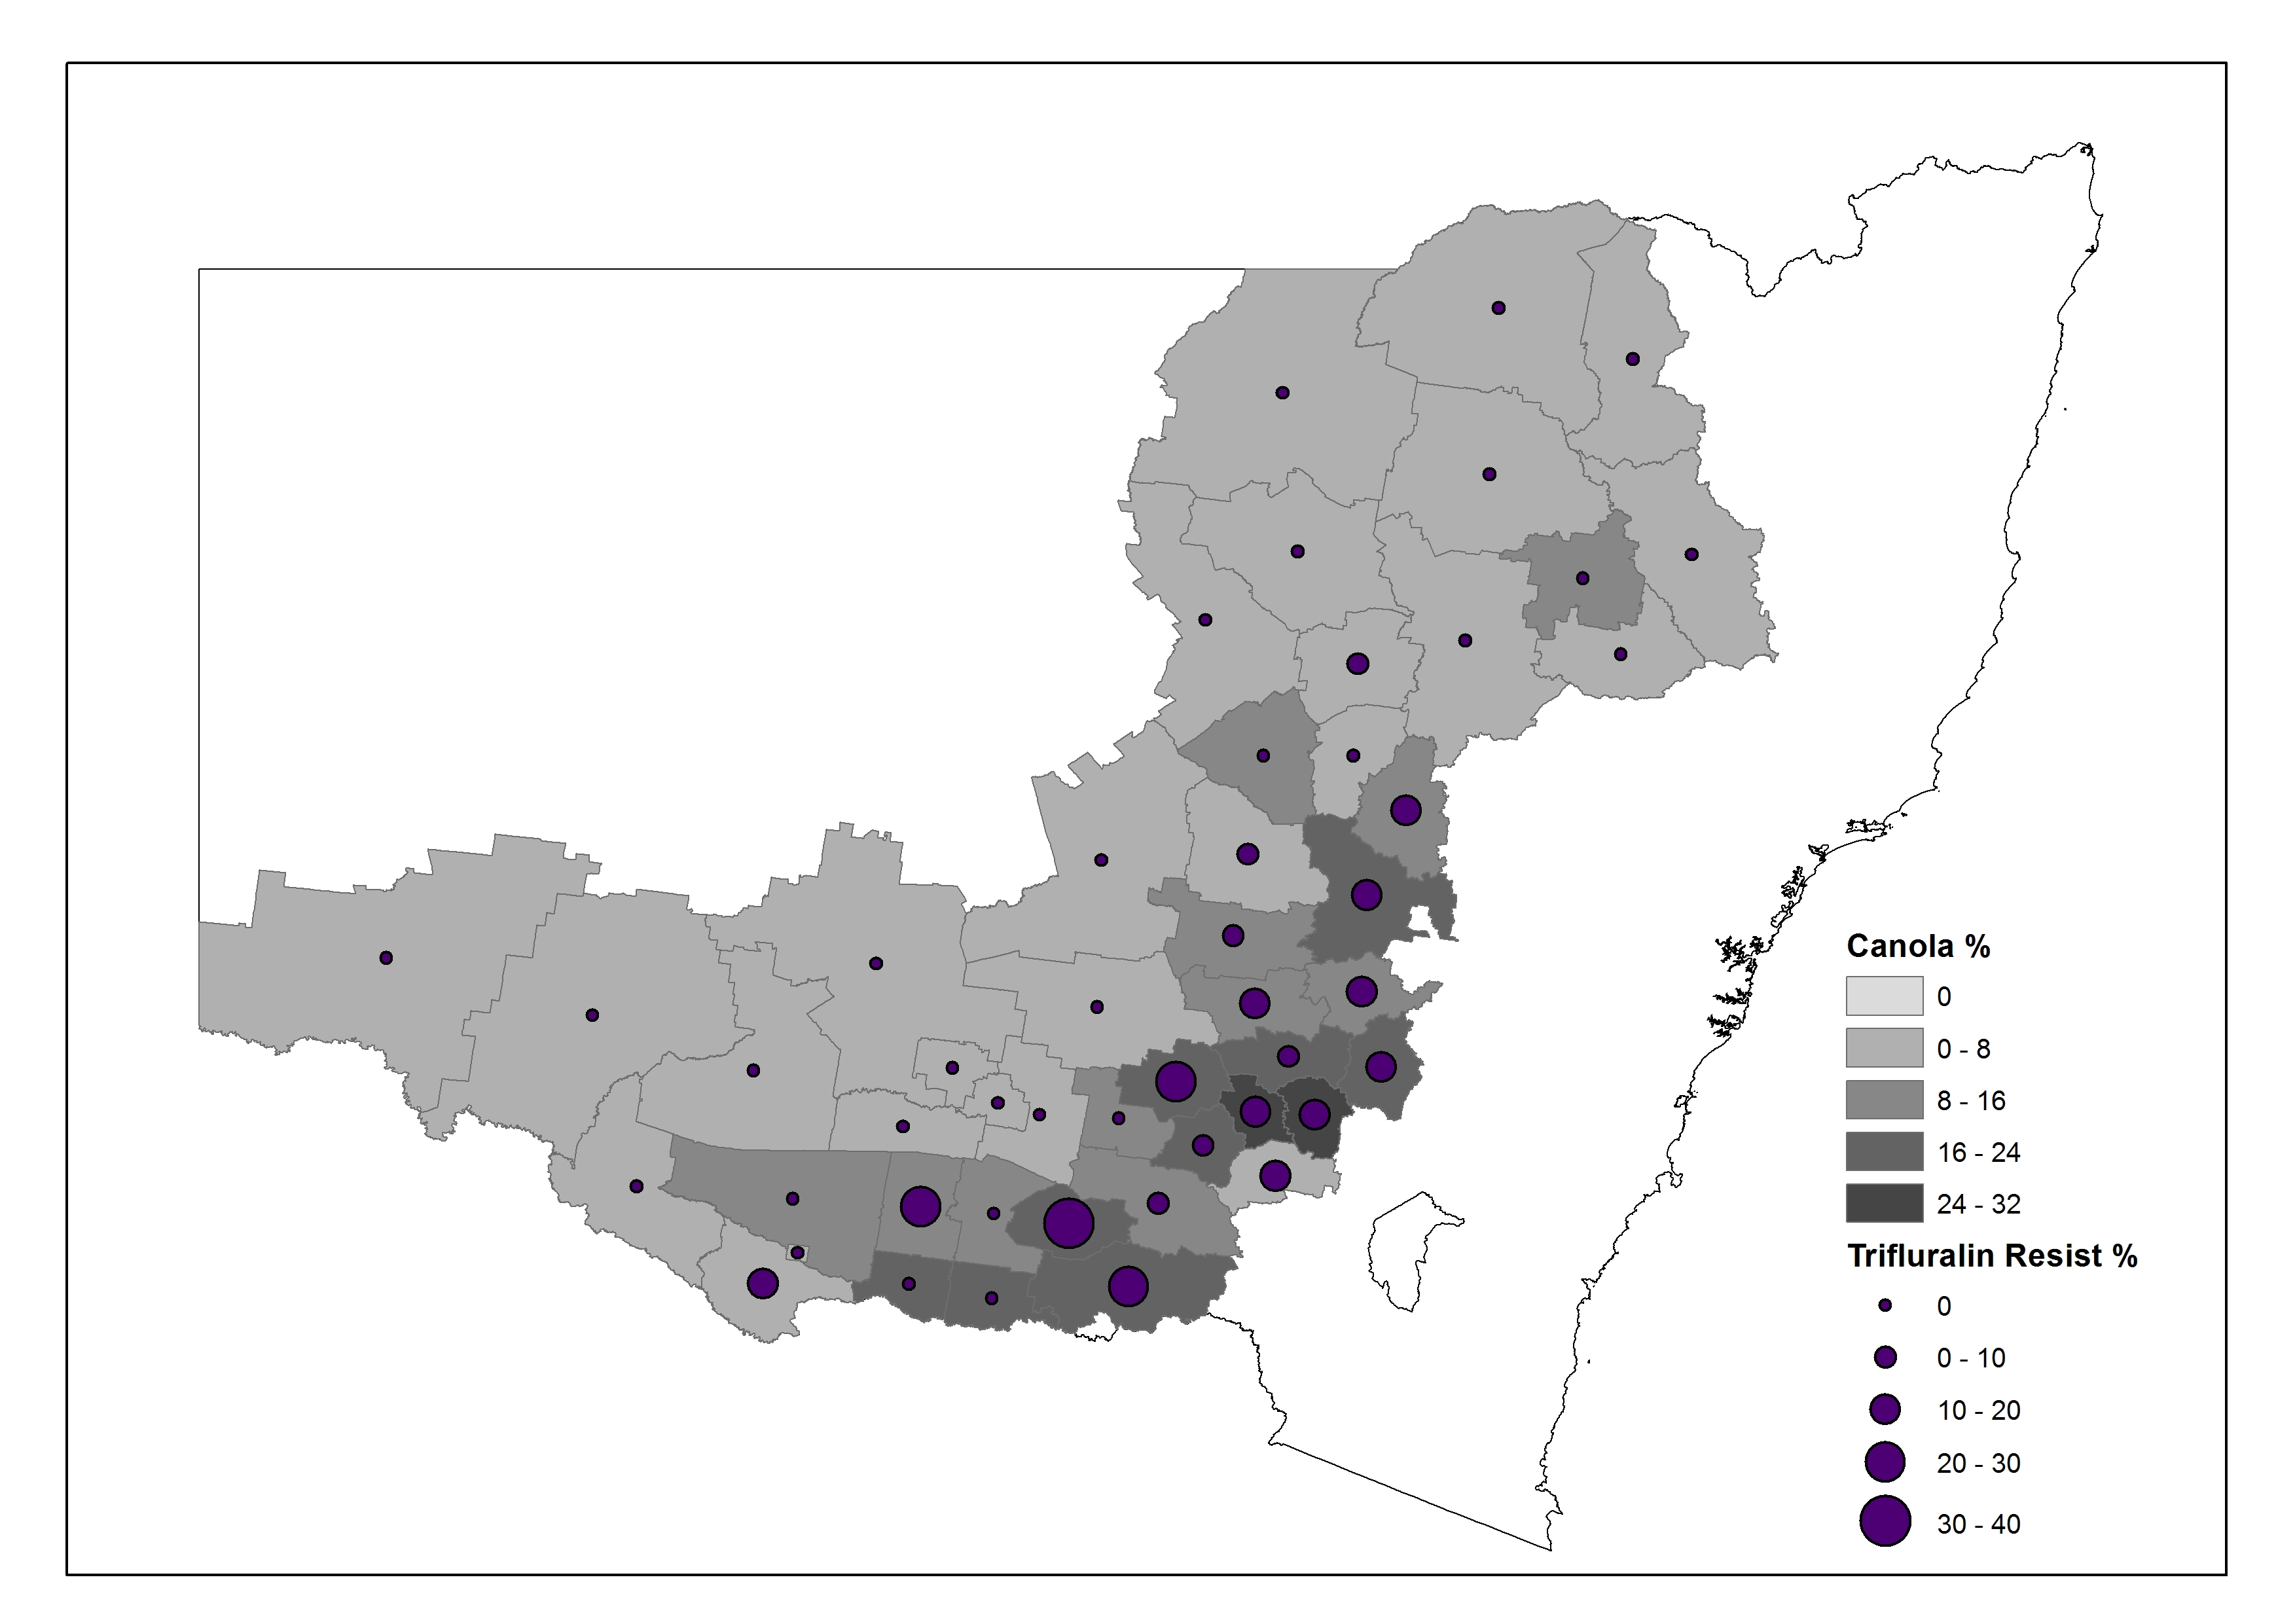
Figure 6. Map showing annual percentage of each shire sown to canola and extent of trifluralin resistance in each shire
As trifluralin requires incorporation and binds to organic matter it would be expected that shires with higher levels of trifluralin resistance would also have higher levels of cultivation and stubble burning. While most of the shires with higher level of trifluralin resistance are also shires with the greatest proportion of stubble burning, they do have higher levels of crop sown with no cultivation before sowing. These high stubble burning with zero cultivation shires with high trifluralin resistance also have the highest Group A fop and B resistance and canola and this combination may be a reflection of cropping intensity and therefore selection pressure for resistance development.
Conclusion
Over 70% of ryegrass populations in NSW are resistant to a minimum of one selective herbicide group. Resistance is highest to the group A fop and group B herbicides. However, no resistance was found to the newer pre-emergent herbicides, Boxer® Gold and Sakura®. For the other species, while significant levels of resistance were found to one or two herbicide groups, the extent of resistance varied greatly between regions. The differences between the survey regions reflected differences in rainfall pattern, crop types, rotation and intensity and the prevalence and importance of the various weed species in each region. However because of the overall high levels of resistance in some areas it is very difficult to assign these differences to cropping practices.
Acknowledgements
The research undertaken as part of this project is made possible by the significant contributions of growers through both trial cooperation and the support of the GRDC, the authors would like to thank them for their continued support. The work of numerous students and casual staff at Charles Sturt University who have assisted in both the surveys and the resistance screening is much appreciated. The assistance of Neil Clark and Associates who provided the ABS data is acknowledged.
References
Boutsalis P, Gill GS, Preston C (2012) Incidence of herbicide resistance in rigid ryegrass (Lolium rigidum) across southeastern Australia. Weed Technology 26, 391-398.
Broster JC, Koetz EA, Wu H (2011) Herbicide resistance levels in annual ryegrass (Lolium rigidum Gaud.) in southern New South Wales. Plant Protection Quarterly 26, 22-28.
Broster JC, Koetz EA, Wu H (2012) Herbicide resistance frequencies in ryegrass (Lolium spp.) and other grass species in Tasmania. Plant Protection Quarterly 27, 36-42.
Broster JC, Koetz EA, Wu H (2013) Herbicide resistance levels in annual ryegrass (Lolium rigidum Gaud.) and wild oats (Avena spp.) in south-western New South Wales. Plant Protection Quarterly 28, 126-132.
Broster JC, Pratley JE (2006) A decade of monitoring herbicide resistance in Lolium rigidum in Australia. Australian Journal of Experimental Agriculture 46, 1151-1160.
Fleming J, McNee T, Cook A, Manning B (2012) Weed control in summer crops 2012-13. (New South Wales Department of Primary Industries: Orange)
Owen MJ, Martinez NJ, Powles SB (2014) Multiple herbicide-resistant Lolium rigidum (annual ryegrass) now dominates across the Western Australian grain belt. Weed Research 54, 314-324.
Owen MJ, Martinez NJ, Powles SB (2015) Multiple herbicide-resistant wild radish (Raphanus raphanistrum) populations dominate Western Australian cropping fields. Crop and Pasture Science 66, 1079-1085.
Contact details
John Broster
Charles Sturt University
Locked Bag 588, Wagga Wagga, NSW, 2678
Ph: 02 6933 4001
Mb: 0427 296 641
Fx: 02 6933 4001
Email: jbroster@csu.edu.au
® Registered trademark
Was this page helpful?
YOUR FEEDBACK
