Optimising grain yield of wheat in southern NSW
Author: Felicity Harris (NSW Department of Primary Industries Wagga Wagga) Peter Matthews (NSW Department of Primary Industries, Orange) David Burch (NSW Department of Primary Industries, Condobolin) | Date: 13 Feb 2018
Take home messages
- High grain yields can be achieved from a range of genotype x sowing date combinations with wheat, however there is variation in genotype responses across environments in southern NSW.
- Whilst flowering time is important in maximising grain yield potential, pre-flowering phases can have a significant influence on grain yields.
Introduction
Wheat development is predominately controlled through varied responses to vernalisation (Vrn) and photoperiod (Ppd) genes. Genotypes responsive to vernalisation require a period of cold temperatures (accumulated most rapidly in the range 3°C to 10°C) to progress from vegetative to reproductive development, whilst time to flowering is accelerated during long-days in photoperiod sensitive genotypes. The range in development patterns in Australian wheat varieties (due to responses to Vrn and Ppd) provides growers with flexibility in their sowing window. Grain yield is maximised when genotype and sowing date are matched so that flowering occurs when the risk of early frost damage and later, heat and moisture damage, is low. Generally, in southern NSW, winter wheat can be sown from early March through to April, slow developing spring wheat from late-April to early May and mid-fast developing wheat from early May onwards and all flower within an optimal window.
This paper discusses phenology and yield responses to sowing date for a core set of wheat genotypes in southern NSW. These results are part of a project aimed at optimising grain yield potential in the northern grains region (NGR) co-invested by the Grains Research and Development Corporation (GRDC) and NSW DPI under the Grains Agronomy and Pathology Partnership (GAPP) project.
Grain yield responses to sowing time
In 2017, field experiments were conducted across eight sites in the NGR in central and southern QLD, northern NSW and southern NSW. This paper presents results from three sites in southern NSW (Wagga Wagga, Cudal and Condobolin). A range of genotypes with varied development (and with different combinations of Vrn and Ppd genes) were sown on three dates — 20 April, 5 May and 18 May, with an additional early sowing at the Wagga Wagga site on 10 April.
Flowering time
Optimum grain yield is achieved when genotypes are matched with sowing date to ensure flowering occurs at an appropriate time. Generally, the genotype and sowing date combinations which flower early to mid-October at Wagga Wagga and Cudal, and mid-September to early October at Condobolin have the greatest yields. In southern NSW, this response is commonly driven by the high risk of frost damage early, and heat and moisture stress later.
In 2017, there was substantial variation in flowering date for the genotypes sown across sowing dates and sites. The flowering window was shorter at Wagga Wagga (Figure 1) than for Cudal (Figure 3) and Condobolin (Figure 4). This is a direct influence of early stem frost damage, which resulted in significant tiller death and late regrowth of tillers in faster developing genotypes, consequently affecting uniformity of plot maturity. Flowering dates are expressed as 50% of emerged heads with visible anthers, as such many of the recorded flowering dates reflect that of the later tillers and do not account for early tiller losses. At the Wagga Wagga site, there was a significant influence of tiller survival (percentage of tillers which produced a spike) on grain yields across the first three sowing dates (Figure 2). The faster developing genotypes had lower tiller survival scores in the earlier sowing times, whilst the later developing genotypes which remained vegetative for longer were exposed to less frost events and were able to maintain tillers.

Figure 1. Relationship between grain yield and flowering date across four sowing dates at Wagga Wagga.
Note: Flowering dates for Wagga Wagga were significantly affected by early stem frost damage.
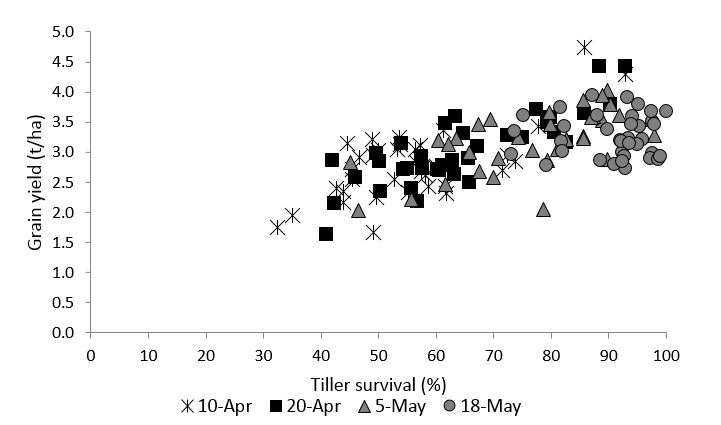
Figure 2. Relationship between grain yield and tiller survival (%) across four sowing dates at Wagga Wagga, 2017.
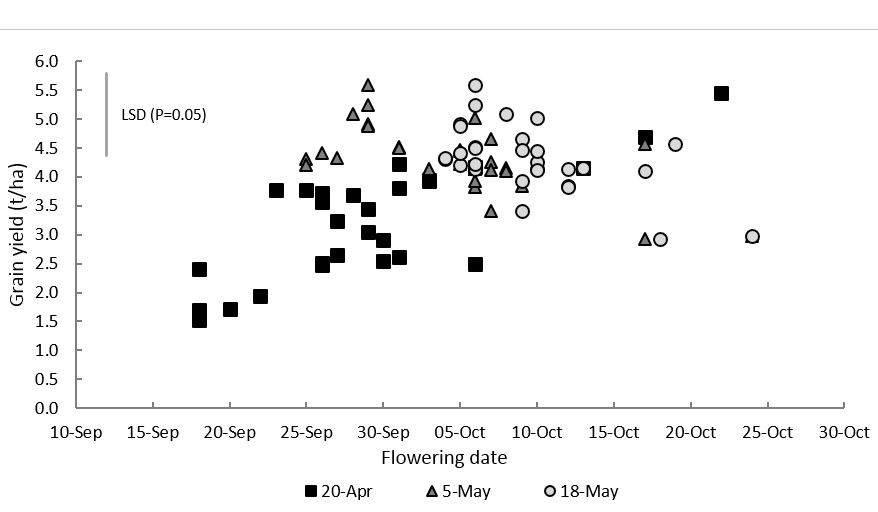
Figure 3. Relationship between grain yield and flowering date across three sowing dates at Cudal, 2017.
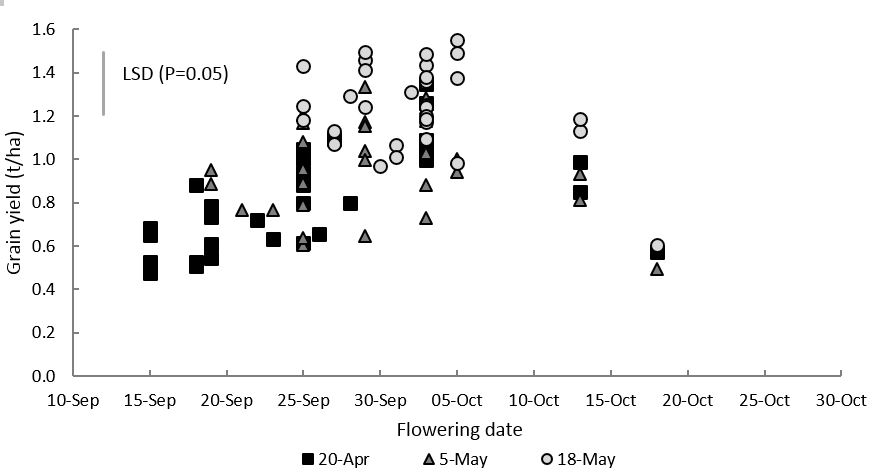
Figure 4. Relationship between grain yield and flowering date across three sowing dates at Condobolin, 2017.
Grain yield
Within the genotypes, there were different yield responses to sowing time across the three sites in 2017, as indicated in Figure 5 (Wagga Wagga), Figure 6 (Cudal) and Figure 7 (Condobolin). Generally, slow developing genotypes had highest yields when sown early (indicated by negative slope), for example, Manning (winter type, strong vernalisation response) and Kittyhawk (winter type). In contrast, many faster developing, spring genotypes had greatest yields in later sowing times (indicated by positive slope), for example, Scepter. In 2017, the number and severity of frost events were a major contributor to grain yield across all experimental sites. Despite the extreme frost conditions, some spring genotypes were able to maintain relatively stable grain yields across many sowing dates at some sites (indicated by flatter slope), for example, EGA_Gregory and Beckom. Whilst the general yield response curves for each site location were similar, there was some variability in specific genotype responses across the three sites, indicating there may be differences in the suitability of genotypes across growing environments of southern NSW.
In 2017, winter and long-season genotypes achieved high yields from early sowing and were relatively stable across sowing dates at the Wagga Wagga and Cudal sites (Table 1). This is likely due to the extended vegetative phase (afforded by vernalisation responses), which reduced exposure to frost events during early reproductive development and resulted in flowering at an optimal time. In contrast, faster developing genotypes were exposed to several frost events during stem elongation through to flowering when sown early, which significantly reduced yield potential. However, the shorter growing season and terminal drought conditions at Condobolin favoured genotype and sowing combinations which were able to regulate flowering time (and minimise early frost damage), for example, fast winter or long-season types at early sowing dates (e.g. Kittyhawk, Longsword), and fast spring types with a quick grain-filling period when sown later. The extended growing season of slow winter types such as Manning did not achieve high grain yields at the Condobolin site (Figure 7).
Note: While all seasons are unique, it is important to consider suitability of varieties based on matching phenology and sowing time for your growing environment. Long term yield comparisons of varieties across a range of environments are available at GRDC National Variety Trials.
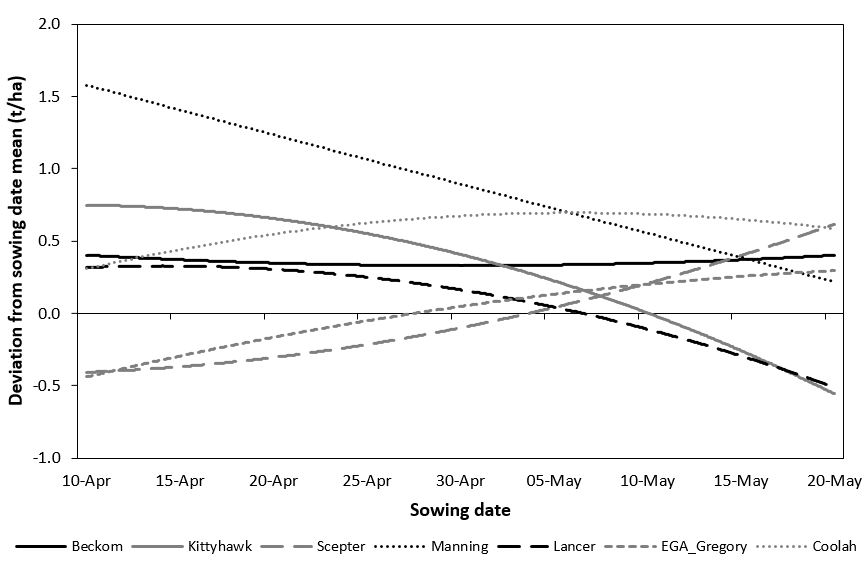
Figure 5. Genotype by sowing date response in 2017 for selected genotypes. Response is presented as deviation from sowing date mean across four sowing dates (SD) at Wagga Wagga. Sowing date mean: SD 1 (10 April) 2.79t/ha; SD 2 (20 April) 3.03t/ha; SD 3 (5 May) 3.20t/ha; SD 4 (18 May) 3.26t/ha.
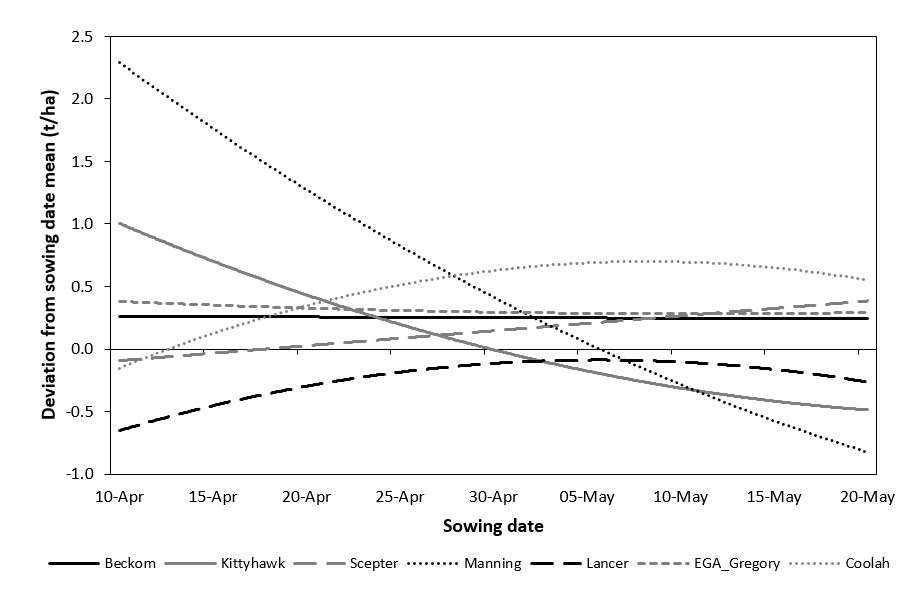
Figure 6. Genotype by sowing date response in 2017 for selected genotypes. Response is presented as deviation from sowing date mean across three sowing dates (SD) at Cudal. Sowing date mean: SD 1 (20 April) 3.18t/ha; SD 2 (5 May) 4.91t/ha; SD 3 (18 May) 4.31t/ha.
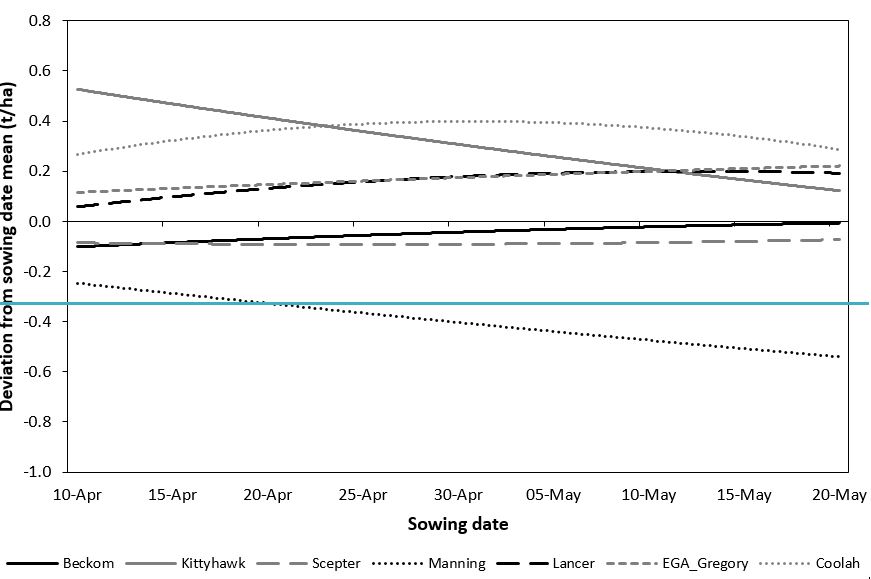
Figure 7. Genotype by sowing date response in 2017 for selected genotypes. Response is presented as deviation from sowing date mean across three sowing dates (SD) at Condobolin. Sowing date mean: SD 1 (20 April) 0.82t/ha; SD 2 (5 May) 0.97t/ha; SD 3 (18 May) 1.24t/ha.
Table 1. Grain yield of genotypes across sowing dates (SD) at Wagga Wagga, Cudal and Condobolin field sites. Percentage of sowing date mean in parentheses.
Wagga Wagga | Cudal | Condobolin | ||||||||||||||||||
|---|---|---|---|---|---|---|---|---|---|---|---|---|---|---|---|---|---|---|---|---|
Genotype | SD1: 10-Apr | SD2: 20-Apr | SD3: 5-May | SD4: 18-May | SD1: 20-Apr | SD2: 5-May | SD3: 18-May | SD1: 20-Apr | SD2: 5-May | SD3: 18-May | ||||||||||
| Beckom | 3.24 | (116) | 3.32 | (110) | 3.54 | (111) | 3.67 | (113) | 3.77 | (118) | 4.85 | (99) | 4.92 | (114) | 0.72 | (88) | 0.95 | (98) | 1.25 | (100) |
| Condo | 1.66 | (60) | 2.74 | (90) | 2.21 | (69) | 2.78 | (85) | 2.40 | (76) | 4.42 | (90) | 4.32 | (100) | 0.65 | (79) | 0.61 | (62) | 1.09 | (88) |
| Coolah | 3.04 | (109) | 3.61 | (119) | 4.02 | (126) | 3.79 | (116) | 3.05 | (96) | 5.64 | (115) | 4.15 | (96) | 1.09 | (133) | 1.35 | (139) | 1.25 | (101) |
| Corack | 1.95 | (70) | 2.16 | (71) | 2.06 | (64) | 3.35 | (103) | 1.72 | (54) | 4.30 | (88) | 5.09 | (118) | 0.48 | (58) | 0.64 | (66) | 0.97 | (78) |
| Cutlass | 3.12 | (112) | 3.11 | (102) | 3.54 | (111) | 3.50 | (107) | 2.65 | (83) | 5.24 | (107) | 5.01 | (116) | 0.63 | (77) | 0.91 | (93) | 1.49 | (120) |
| Dart | 2.16 | (77) | 2.36 | (78) | 2.47 | (77) | 2.96 | (91) | 1.69 | (53) | 4.05 | (83) | 4.21 | (98) | 0.68 | (83) | 0.77 | (79) | 1.07 | (87) |
| DS_Darwin | 2.95 | (106) | 2.85 | (94) | 3.38 | (106) | 3.19 | (98) | ||||||||||||
| DS_Faraday | 2.74 | (98) | 3.34 | (110) | 3.60 | (112) | 3.67 | (113) | ||||||||||||
| DS_Pascal | 2.42 | (87) | 2.91 | (96) | 3.52 | (110) | 2.97 | (91) | 4.23 | (133) | 4.66 | (95) | 4.25 | (99) | 1.00 | (122) | 1.33 | (137) | 1.44 | (116) |
| EGA_Eaglehawk | 2.92 | (104) | 3.15 | (104) | 3.46 | (108) | 2.89 | (89) | 3.94 | (124) | 5.69 | (116) | 4.13 | (96) | 1.26 | (154) | 1.28 | (132) | 1.55 | (125) |
| EGA_Gregory | 2.44 | (87) | 2.63 | (87) | 3.60 | (112) | 3.44 | (105) | 3.56 | (112) | 5.19 | (106) | 4.66 | (108) | 0.94 | (114) | 1.17 | (121) | 1.49 | (120) |
| EGA_Wedgetail | 2.70 | (97) | 3.28 | (108) | 3.28 | (103) | 3.00 | (92) | 2.49 | (78) | 5.06 | (103) | 4.16 | (97) | 1.09 | (133) | 0.73 | (75) | 1.17 | (95) |
| H45 | 2.39 | (86) | 2.73 | (90) | 2.87 | (90) | 3.46 | (106) | ||||||||||||
Janz | 2.69 | (96) | 2.78 | (92) | 3.61 | (113) | 3.21 | (98) | 3.78 | (119) | 5.40 | (110) | 4.13 | (96) | 0.80 | (97) | 0.96 | (99) | 1.46 | (118) |
| Kiora | 2.77 | (99) | 3.73 | (123) | 3.27 | (102) | 3.01 | (92) | 2.90 | (91) | 4.48 | (91) | 4.10 | (95) | 1.07 | (130) | 0.94 | (97) | 1.38 | (111) |
| Kittyhawk | 3.42 | (123) | 3.80 | (125) | 3.54 | (111) | 2.72 | (84) | 4.17 | (131) | 4.58 | (93) | 3.84 | (89) | 1.35 | (164) | 1.18 | (122) | 1.24 | (100) |
| Lancer | 2.94 | (105) | 3.58 | (118) | 3.22 | (101) | 2.79 | (86) | 2.54 | (80) | 4.83 | (98) | 3.40 | (79) | 0.88 | (107) | 1.17 | (121) | 1.36 | (110) |
| Longsword | 2.25 | (81) | 2.51 | (83) | 3.05 | (95) | 3.23 | (99) | 3.94 | (124) | 5.31 | (108) | 4.22 | (98) | 1.00 | (122) | 1.04 | (107) | 1.41 | (114) |
| LRPB_Mustang | 2.61 | (94) | 2.87 | (95) | 3.02 | (94) | 3.38 | (104) | 1.68 | (53) | 4.79 | (98) | 4.89 | (113) | 0.51 | (62) | 0.89 | (92) | 1.31 | (106) |
| LRPB_Reliant | 3.05 | (109) | 2.94 | (97) | 3.20 | (100) | 3.62 | (111) | 3.23 | (102) | 4.63 | (94) | 5.24 | (122) | 0.88 | (108) | 1.15 | (119) | 1.49 | (120) |
| Mace | 2.35 | (84) | 2.41 | (80) | 2.58 | (81) | 3.19 | (98) | 2.62 | (82) | 4.74 | (97) | 4.33 | (101) | 0.61 | (74) | 0.79 | (81) | 1.07 | (86) |
| Manning | 4.30 | (154) | 4.43 | (146) | 3.79 | (119) | 3.59 | (110) | 5.46 | (172) | 4.60 | (94) | 2.98 | (69) | 0.57 | (70) | 0.50 | (51) | 0.61 | (49) |
| Mitch | 2.83 | (102) | 3.25 | (107) | 3.58 | (112) | 2.86 | (88) | 3.68 | (116) | 5.29 | (108) | 3.83 | (89) | 0.61 | (75) | 1.03 | (106) | 1.24 | (100) |
RGT_Accroc | 4.74 | (170) | 4.43 | (146) | 3.95 | (123) | 3.75 | (115) | 4.68 | (147) | 5.19 | (106) | 4.56 | (106) | 0.85 | (104) | 0.81 | (84) | 1.13 | (91) |
| Scepter | 2.31 | (83) | 2.99 | (99) | 2.90 | (91) | 3.95 | (121) | 3.45 | (109) | 5.62 | (115) | 5.59 | (130) | 0.73 | (90) | 0.88 | (91) | 1.20 | (97) |
| Spitfire | 2.33 | (83) | 2.20 | (72) | 2.69 | (84) | 3.13 | (96) | 1.94 | (61) | 4.96 | (101) | 4.47 | (104) | 0.53 | (64) | 0.65 | (67) | 1.01 | (82) |
| Sunlamb | 3.22 | (115) | 3.17 | (105) | 2.88 | (90) | 2.88 | (88) | 4.15 | (130) | 4.64 | (94) | 2.93 | (68) | 0.99 | (120) | 0.93 | (96) | 1.19 | (96) |
| Sunmax | 3.14 | (113) | 3.48 | (115) | 3.46 | (108) | 3.01 | (92) | 2.51 | (79) | 5.79 | (118) | 4.44 | (103) | 1.01 | (123) | 1.24 | (128) | 1.38 | (111) |
| Suntime | 2.55 | (91) | 2.70 | (89) | 2.83 | (88) | 2.84 | (87) | 3.69 | (116) | 4.38 | (89) | 4.52 | (105) | 0.80 | (98) | 1.00 | (103) | 0.98 | (79) |
| Suntop | 3.36 | (120) | 3.50 | (115) | 3.66 | (114) | 3.18 | (98) | 3.71 | (117) | 4.85 | (99) | 3.93 | (91) | 0.89 | (108) | 1.09 | (112) | 1.18 | (95) |
Sunvale | 2.85 | (102) | 3.65 | (120) | 3.23 | (101) | 2.93 | (90) | 3.81 | (120) | 4.90 | (100) | 4.13 | (96) | 1.05 | (128) | 1.20 | (124) | 1.24 | (100) |
TenFour | 1.75 | (63) | 1.64 | (54) | 2.03 | (63) | 3.44 | (105) | ||||||||||||
| Trojan | 2.71 | (97) | 2.72 | (90) | 3.86 | (121) | 3.46 | (106) | 2.49 | (78) | 4.69 | (96) | 4.51 | (105) | 0.79 | (96) | 1.08 | (111) | 1.29 | (104) |
Mean | 2.79 | (100) | 3.03 | (100) | 3.20 | (100) | 3.26 | (100) | 3.18 | (100) | 4.91 | (100) | 4.31 | (100) | 0.82 | (100) | 0.97 | (100) | 1.24 | (100) |
LSD (SD) | 0.29 | 0.38 | 0.05 | |||||||||||||||||
LSD (Genotype) | 0.08 | 0.82 | 0.16 | |||||||||||||||||
LSD (SD x Genotype) | 0.58 | 1.42 | 0.28 | |||||||||||||||||
Summary
There are differences in grain yield responses to sowing time of wheat genotypes across growing environments in southern NSW, indicating that particular varieties can be exploited by grain growers. Genotypes vary in their response to vernalisation and photoperiod, which influences early development phases, as well as flowering time.
The extreme frost conditions experienced in 2017 had a significant effect on grain yields at the three experimental sites, and highlighted the importance of the timing and length of pre-flowering development phases. Whilst matching variety and sowing time to achieve flowering at an appropriate time for each growing environment is the most effective management strategy in optimising grain yields, future research will also investigate the contribution of pre-flowering phases to yield development.
Acknowledgements
This research is a collaborative project between the GRDC and NSW DPI under the Grains Agronomy and Pathology Partnership (GAPP) project. The research undertaken as part of this project is made possible by the significant contributions of growers through both trial cooperation and the support of the GRDC — the author would like to thank them for their continued support.
Sincere thank you for the technical assistance of Hugh Kanaley, Greg McMahon, Cameron Copeland, Hayden Petty and Jessica Simpson at the Wagga Wagga site, Peter Roberts at the Cudal site, and Nick Moody at the Condobolin site.
Thank you to Murray Balcoomb and family for hosting the Cudal site. We also acknowledge the support of NSW DPI and their cooperation at the Wagga Wagga Agricultural Institute and Condobolin Agricultural Research and Advisory Station.
Contact details
Felicity Harris
NSW Department of Primary Industries, Wagga Wagga
0458 243 350
felicity.harris@dpi.nsw.gov.au
@NSWDPI_Agronomy
GRDC Project Code: DAN00213,
Was this page helpful?
YOUR FEEDBACK