The National Paddock Survey – What causes the yield gap across Australian paddocks?
Author: Roger Lawes, Chao Chen and Harm van Rees | Date: 26 Feb 2018
Key messages
- The yield gap, or the difference between actual and potential yield in wheat was 1.1, 1.2 and 1.3 t/ha across the Northern, Southern and Western Zones of the Australian grain belt.
- The cause of this yield gap is variable. No one factor (nitrogen, disease, weeds or rainfall) is a cause of the yield gap, it is a combination of factors.
- Growing season rainfall, the previous crop or crop sequence, nitrogen application, levels of disease and weeds were all important factors that were associated with the yield gap.
Aims
The yield gap is the difference between the actual yield achieved by the grower and the water limited yield potential. The water-limited potential is defined as the maximum possible yield able to be grown with the optimal sowing date, current cultivars and nutrients, pests, disease and weeds not limiting yield. It is usually calculated using a crop growth model. Previous studies have shown that well managed commercial crops can reach their potential (van Rees et al. 2014), showing it is not an unattainable or unrealistic yield. A previous study using shire-level data showed that the yield gaps averages around 55% across Australia, meaning that current yields growers are achieving is about half of that which is potentially possible (Hochman et al. 2016). A small yield gap indicates that management is near optimum. A large yield gap, implies that crop productivity is constrained by abiotic and/or biotic factors, such as nutrient deficiencies, weeds, diseases and insects.
The potential exists to help growers increase on farm yields by targeting the key factors that contribute to the yield gap. The yield gap is likely a result of multiple causal factors and due to a number of sub-optimal management activities. Identification of the most important factors will allow farmers to prioritize their efforts in improving yield and profit. However, while we have a much clearer idea of the size of the yield gap across the grains industry, we have little quantitative understanding of the abiotic and/or biotic constrains on the yield gap at the individual paddock level.
In this national study we aimed to determine the size and variation of yield gaps in rainfed wheat and seek to explain the agronomic reason behind the gap. Yield maps and hand-cuts were used to summarise actual crop yield. Crop simulation models such as APSIM (Holzworth, 2014) have been widely used in yield gap analysis (Calviño and Sadras, 2002; Oliver and Robertson, 2013). We used the APSIM model, combined with surveys of soil properties and agronomic practices, to estimate water-limited potential yield.
Method
On-farm data collection
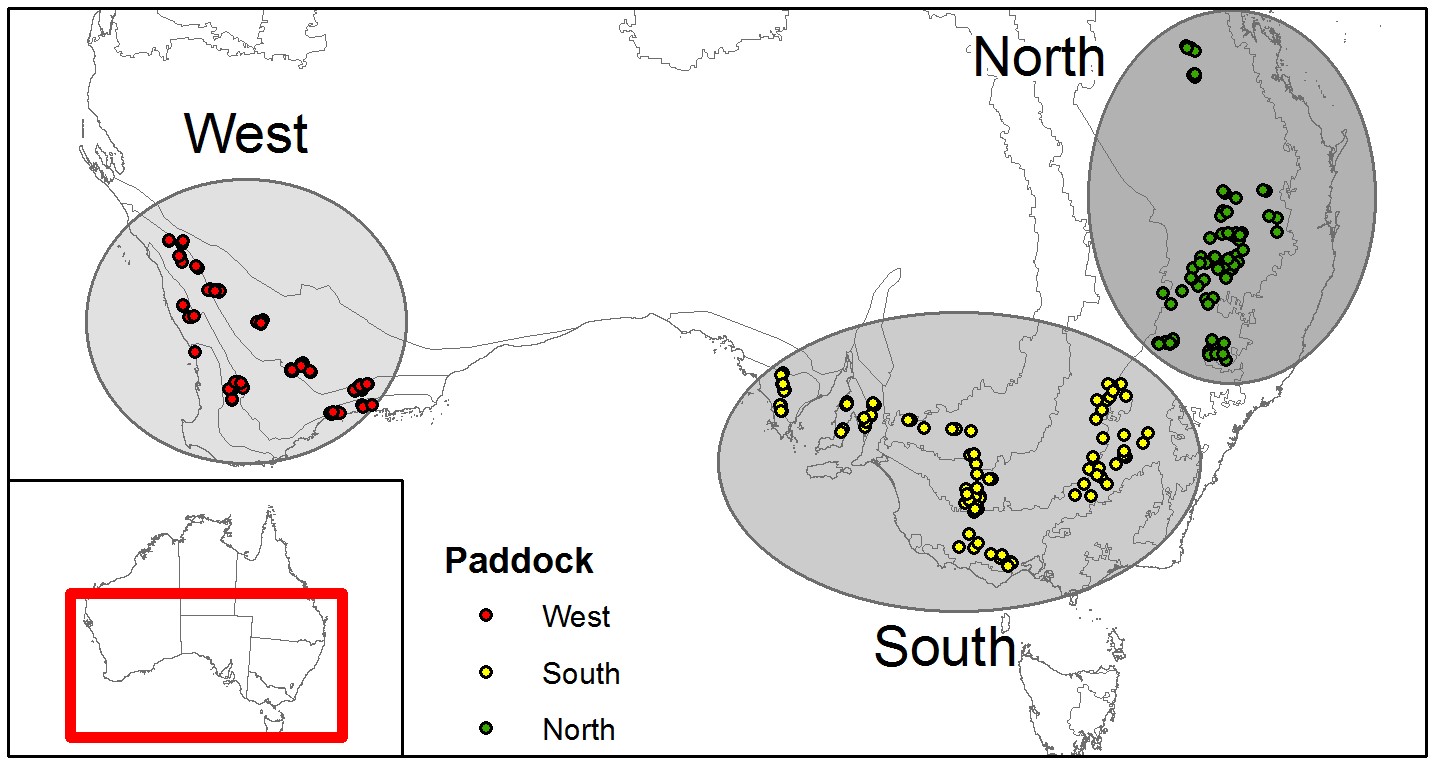
In the Western, Northern and Southern GRDC regions across the Australian grain belt, 250 paddocks were monitored for the growing seasons of 2015 and 2016 (Figure 1). These farms were selected on the basis that they were owned by leading farmers and represent the range of prevailing rainfall and soil conditions across the grain belt.
Paddock Monitoring Protocol
Commercial wheat crops were monitored by collaborating consultants from pre-sowing to harvest at two transects (zones) selected within each paddock.
The variation in soil conditions and constraints within a paddock may affect crop performance. To consider such an effect, soil types were identified and soil water and mineral nitrogen before sowing were measured in the two selected zones. Cores were subdivided into depth increments to estimate the water and nitrogen availability down to a depth of 1 m. Agronomic management details including the management of previous crop residues and tillage, cultivar, sowing date, plant density, fertilizer management (type, application rate and date). The type and number of weeds, plants damaged by diseases and/or insects and root diseases were monitored at zadoks stage 31 and zadoks stage 65. Disease root health score was assessed as a (0–5) score where 0 = not observed and 5 = severe disease level). At the end of each season, crop yields were measured using a yield monitor attached to a grain harvester. The data collected for each season was reviewed at annual project meetings, to allow consultants and researchers to discuss insights and information regarding individual paddock performance.
Simulation of potential yield and Yield gap analysis
The difference between the simulated yield and actual yield, as measured by the yield monitor, was defined as the yield gap (Hochman et al., 2016). At the end of each season water-limited potential yields were simulated on both transects within each paddock using the APSIM model (Holzworth, 2014). Agronomic practices on each paddock were recorded (crop type, sowing date, plant density, residue and fertiliser) and used to initialise the model. Soil parameter values for the identified soil types in the surveyed paddocks were sourced from APSoil. Measured soil water and nitrogen at sowing was used at the start of the simulation to initialize the model. If initial data were missing, the model was initialized from expert opinion. Weather data were sourced from the nearest SILO meteorological stations to each farm. Simulations were run assuming that yield was not limited by nitrogen supply, weeds, pests, disease, frost or heat damage.
Classification and Regression Tree (CART) was used to determine the relative importance of the factors that could influence the size of the yield gap including in-crop agronomic factors (weed densities of identified weed species, levels of disease severity, nitrogen fertilizer application) and other factors (region, soil type, previous crop). This analytical approach was chosen because it allows the variables to interact with each other and can identify complex relationships between multiple variables.
Results
Assessing survey data
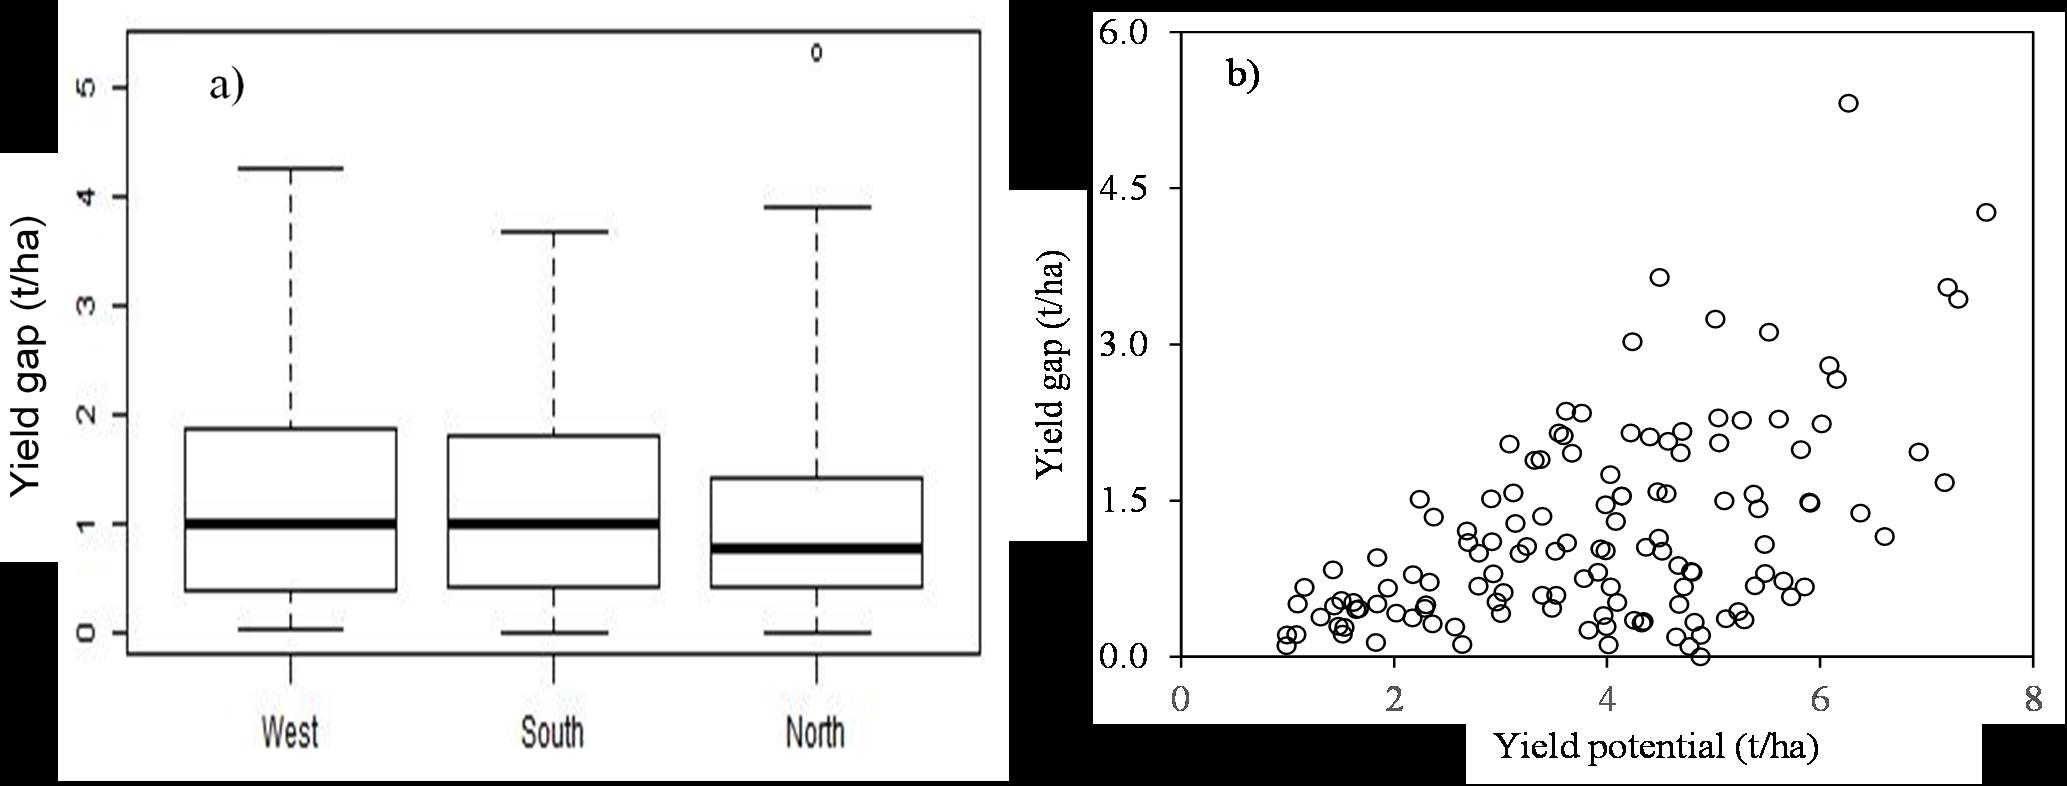
When wheat was grown, the dominant previous crop was usually wheat in the Western and Southern Regions. Conventional break crops, such as canola, chickpea, sorghum, oats or pasture were less common. This was not the case in the North (Table 1). Growing season rainfall was highly variable across paddocks within and between regions, and between the 2015 and 2016 seasons (Fig. 2a). The growing season rainfall was lowest in Western region (192mm) and highest in Southern region (296 mm) (Table 1).
The average amount of N fertilizer applied to wheat was 32, 43, 26kg N/ha in the Western, Southern and Northern regions, respectively (Table 1), while it varied greatly among paddocks within each region. The average weed density at zadok stage 31 was 10 plants/m2 in both Western and Southern regions, with few paddocks with weeds detected in the Northern region. The incidences of diseases and insects was generally minor in most of paddocks across regions and seasons, with a trend for the incidences of disease and insects being higher in the Western region, compared to the Southern and Northern regions (Table 1). On average, the root health score was low across all three regions (Table 1), although there were occasional root health problems detected in some surveyed paddocks.
Average dry wheat yields, monitored by farmers with grain harvesters were lower in the Western region (2.5 t/ha) than the Southern (3.7 t/ha) and Northern regions (4.1 t/ha).
The magnitude of yield gaps
There was considerable variability in the gap between water-limited potential yield and actual farm yield (Fig. 2b). For 2015 and 2016 seasons, the yield gap of wheat ranged from 0 to 4.3 t/ha in the Western region, with a mean value of 1.2 t/ha (Fig. 2a). It varied between 0-3.7 t/ha in Southern region and 0-5.3 t/ha in the Northern region, with average values of 1.3 and 1.1 t/ha, respectively. Extremes were statistical outliers (Fig 2a), and could point to problems with data collection or simulation modelling. In general, the size of yield gap was correlated with the size of potential yield and growers are unable to capture the extra yield on offer in the high rainfall zones (Fig. 2b). In the Western Regions 46% of wheat paddocks achieved between 80 and 100% of yield potential. In the southern region, 38% of wheat paddocks fell within this range. In the northern region 43% of paddocks fell with 80 to 100% of yield potential. Achieving yield potential is not uncommon and demonstrates that yield potential is achievable for a broad range of farmers, with paddocks on all soil types and rainfalls.
| Western Region | Southern Region | Northern Region |
|---|---|---|---|
No. of paddocks | 78 | 53 | 38 |
Previous crop (%cereal/% break crop) | 80/20 | 62/38 | 36/64 |
In-crop rainfall (mm) | 192 | 296 | 230 |
Nitrogen supply (kg N/ha) | 32 | 43 | 26 |
Weeds (plants/m2) | 10 | 10 | 0 |
Root health score | 1.8 | 1.7 | 2.2 |
Disease (% affected plants) | 12 | 4 | 8 |
Insect (% affected plants) | 11 | 7 | 1 |
Factors associated with the yield gap
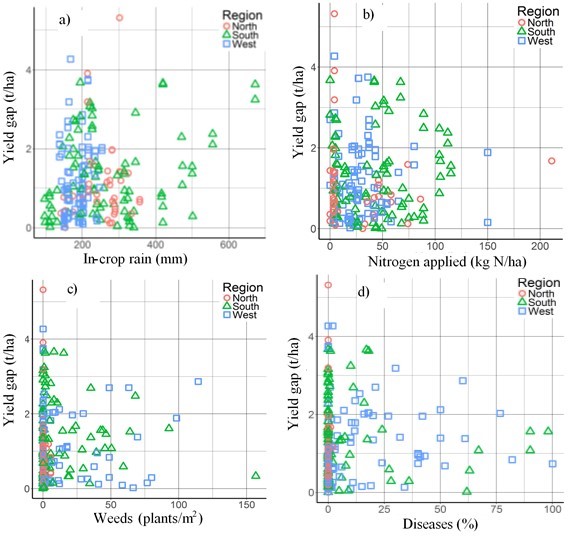
No significant relationship was observed between yield gap and a single factor (in-crop rainfall, nitrogen fertilizer application, weeds, disease, insect and previous crop) (Fig. 4). This suggests that the yield gap was caused by a combination of these effects, or the yield gap was driven by the first limiting constraint (Leibigs law), and a lack of a linear relationship is therefore not surprising. The CART analysis, which copes with such complex data revealed that growing season rainfall, rate of applied nitrogen, the previous crop, disease levels and weed levels all contributed to the size of the yield gap (Table 2). If stating results are significantly different, provide evidence of statistical analyses.
In the western region, growing season rainfall was the most important variable to explain the yield gap. This was followed by the amount of nitrogen and the previous crop, with weeds having a minor influence. It suggests that larger yield gaps occur in the high rainfall zone, possibly because these yields are harder and more risky to achieve. Nitrogen does appear to be limiting growers’ ability to capture these higher yield potentials, while crop rotation is playing a role. Wheat on wheat is still common in the Western region. In the southern region, the amount of applied N, the previous crop and root health score were the three most important variables. Weeds and growing season rainfall were of minor importance. In the northern region growing season rainfall, applied N and root score were the three most important variables. The implication is that N dynamics, growing season rainfall and crop rotation tend to play an important role in explaining the size of the yield gap. The potential to grow a high yielding crop is complicated because of the high N demands. These analyses suggest that in high yielding situations, the N demand of the crop is not being met and growers are under fertilising in the high rainfall zones of Australia. This decision by growers may be a sensible and rational, given the risks associated with targeting high yields.
| In-crop rainfall | Nitrogen applied | Previous Crop | Weeds | Root Score |
|---|---|---|---|---|---|
West | 1 (109.8) | 2 (17.7) | 3 (6.1) | 4 (0.8) | |
South | 4 (8.5) | 1 (25.3) | 2 (16.4) | 5 (4.2) | 3 (8.8) |
North | 1 (87.6) | 2 (18.5) | 4 (5.3) | 3 (5.4) |
*The number in brackets refers to an estimate of variable importance, as an absolute measure. It is used to assess the relative power of one variable over another.
Conclusion
The national paddock survey is helping to understand the critical drivers of the yield gap across Australia. There is potential to reduce the size of the yield gap with more targeted N management and crop rotation. Importantly though, multiple, interacting factors contribute to the yield gap.
References
Calviño P and Sadras V (2002). On-farm assessment of constraints to wheat yield in the south-eastern Pampas. Field Crops Research 74, 1-11.
Hochman Z, et al. (2016). Data rich yield gap analysis of wheat in Australia. Field Crops Research 197, 97-106.
Holzworth D, et al. (2014). APSIM–Evolution towards a new generation of agricultural systems simulation. Environmental Modelling Software 62, 327-350.
Oliver Y and Robertson M (2013). Quantifying the spatial pattern of the yield gap within a farm in a low rainfall Mediterranean climate. Field Crops Research 150, 29-41.
Van Rees H, McClelland, Hochman, Z, Carberry, P, Hunt J, Huth N, Holzworth D (2014) Leading farmers in South East Australia have closed the exploitable wheat yield gap: Prospects for further improvement. Field Crops Research 164, 1-11.
Acknowledgments
The research undertaken as part of this project is made possible by the significant contributions of growers through both trial cooperation and the support of the GRDC, the author would like to thank them for their continued support. We acknowledge the support of CSIRO staff Jeremy Whish, David Gobbett, Jackie Ouzman and Noboru Ota for contributing to vital components of this research. We also thank the Birchip Cropping Group and Square V Design for hosting the project and developing the database infrastructure.
GRDC Project Number: BWD00025
Reviewed By: Dr Phil Ward.
GRDC Project Code: BWD00025,
Was this page helpful?
YOUR FEEDBACK