Weather and seasonal forecasting — science or fiction in 2017?
Author: Dale Grey (Agriculture Victoria, Bendigo) | Date: 13 Feb 2018
Take home messages
- During 2017, weather models performed satisfactorily at predicting the weather despite the early El Niño prediction being wrong.
- Half of the models surveyed had drier predictions across the season for southern NSW.
- Modern computer climate models look at much more than just El Niño and La Niña when making their predictions.
Background
2014 started with early El Niño predictions which failed to materialise but due to the presence of too many high air pressure systems in spring, the season was challenging. During 2015, El Niño and a positive Indian Ocean Dipole (IOD) was predicted early, which did eventuate in both instances. The effects of these weather patterns in Victoria (VIC) were marked with VIC experiencing a below average season, but New South Wales (NSW) experienced a reasonable season due to some favourable air pressure and Southern Annual Mode (SAM) patterns.
2016 had early predictions of a La Niña and a negative IOD — the predicted La Niña did not occur, but the negative IOD led to a very wet season that was well predicted by many models. 2017 once again started with El Niño predictions which also failed to eventuate, but the season, while reasonable in VIC, was average to below average in much of southern NSW — why was this so?
Results and discussion
January and February rainfall for southern NSW was below average at decile three to four, but some subsoil moisture existed as remnant of the 2016 spring and from summer storms.
March saw patchy storms with up to 25mm to 50mm falling in parts of southern NSW and more in central NSW.
More than half the models surveyed in March indicated an El Niño was possible for the coming crop growing season. Similarly, there was good consensus for a positive IOD for winter. These predictions were being discussed despite this being a time where the skill of models at making such predictions is the poorest. Figures 1 and 2 show the summary of rainfall and temperature predictions made for April to June and for July to September. Consensus was split between average and drier rainfall and average and warmer temperatures for both three month prediction periods.

Figure 1. April to June rainfall and temperature predictions for southern NSW from 11 models run in March.

Figure 2. July to September rainfall and temperature predictions for southern NSW from 11 models run in March.
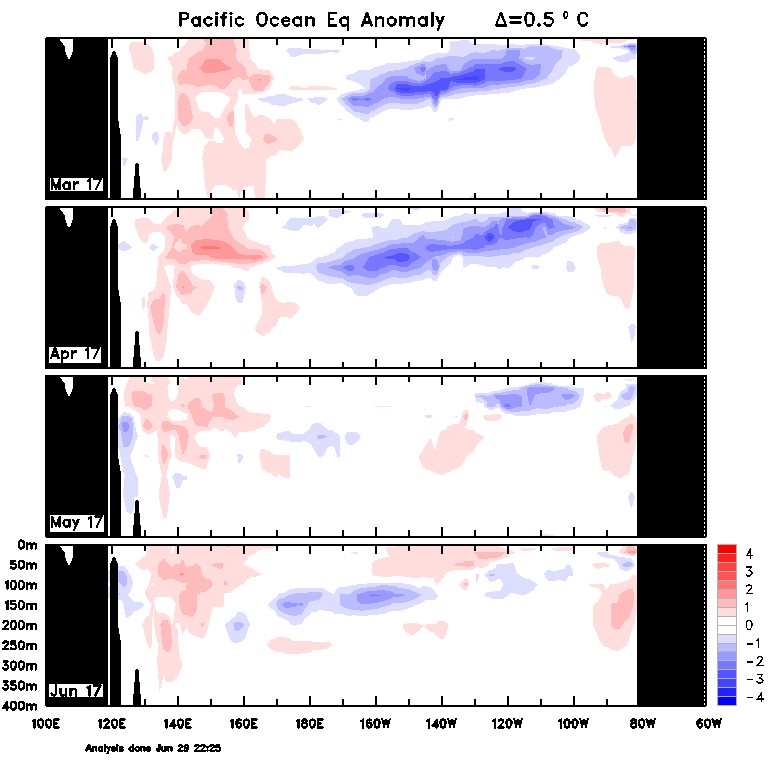
The unexpected point about this year’s El Niño prediction was that it was not easy for those that examine climate models (climate scientists or otherwise) to see the underlying fundamentals of where these forecasts were coming from. In previous years, a signal of some note usually pre-exists in the eastern Pacific equatorial subsea. Figure 3 shows that subsea temperature anomalies were in fact cooler at this time and any signal the models were receiving were from the slightly warmer western Pacific which was predicted to make its way over to the South American coast. The reversed trade winds east of Papua New Guinea which are needed for this to happen did not occur. Once May was reached, almost all models were still convinced of a positive IOD but this also did not eventuate. So for whatever reason, models were ‘crying wolf’ early last year.
April saw a great opening rain in VIC and along the Murray River of NSW, but areas north of Wagga Wagga missed out. This was an unexpected weather event that was VIC’s good luck but South Australia (SA) and NSW were not as fortunate.
Rainfall in May was patchy; with lower rainfall experienced in the south but some good rainfall totals experienced in the north.
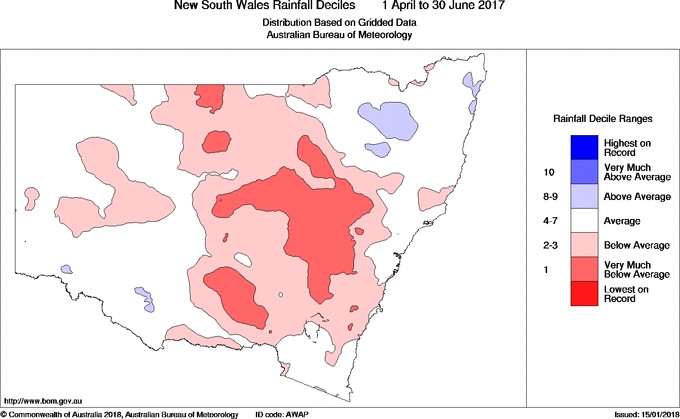
June was dry, which led to a sub-optimal start for southern NSW’s growing season at decile one to two (Figure 4).

Figure 3. Subsea temperature anomaly cross section of the Equatorial Pacific Ocean March to June 2017.

Figure 4. Decile ranking of April to June rainfall NSW 2017.
July rainfall along the Murray River was average, but it became progressively drier heading north at decile three to four.
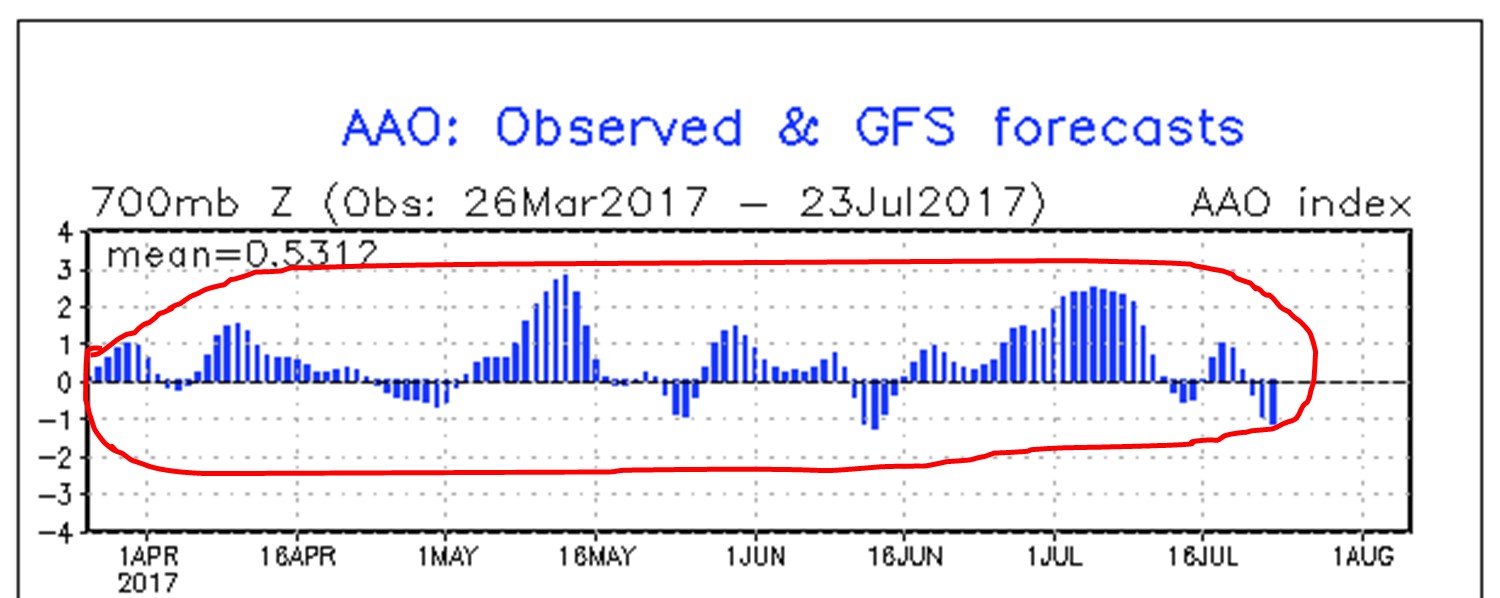
So what was the climate playing at here? Broad scale changes to pressure and the position of the rainfall triggers resulted in a dry south-east (SE) Australia. The SAM was positive through most of April to July (Figure 5).

Figure 5. SAM measurements across April to July 2017.
A positive SAM meant that winds were spinning faster around Antarctica and pulling the frontal and low pressure rainfall triggers to the south. The lower rainfall was therefore due to a lack of rainfall triggers rather than a lack of moisture source. June in particular was dominated by a massively high pressure pattern that set up over the SA and VIC border, this effectively blocked rainfall triggers from coming anywhere near SE Australia. In effect the two factors were both at play, preventing June rainfall.
During July, the position of the Sub Tropical Ridge (STR) of high pressure started moving further north of its normal position over Adelaide. In fact, through August the ridge moved as far north as Coober Pedy. This had the benefit of pressure being lower than ‘normal’ and consequently there was no impediment to fronts coming through. However, due to the fronts being pulled south by SAM, the wetter effect virtually stopped at the VIC and NSW border.
At the end of July, models have their best chance of being accurate for August to October. Once again during 2017 the models were split between an average to drier spring and an average to warmer temperatures. Predictions for summer started to be haphazard, but models indicated that temperatures were likely to be warmer (Figures 6 and 7).
August was the one month of the growing season that produced rainfall close to average over the NSW region and even slightly above average along the Murray River. This was due to the STR of high pressure which stayed north. However, SAM was still behaving unpredictably.

Figure 6. August to October rainfall and temperature predictions for southern NSW from 11 models run in July.

Figure 7. November to January rainfall and temperature predictions for southern NSW from 11 models run in July.
’September maketh the crop’ and it forgot to rain in September, with decile one to lowest on record through most of southern NSW. September is a transition time from winter weather patterns to summer patterns and the STR should start to move south again. Unfortunately, the far northern position of the STR stayed that way and while helpful in winter, this position becomes a nuisance in spring, as it starts blocking tropical moisture flow from the north. The northern positioning of the STR also allowed plenty of cold air up from Antarctica and frosts were problematic throughout the region. The dry soils, clear skies and south west (SW) winds were far from helpful. Additionally, SAM went strongly positive dragging fronts and lows south which was another issue in September.
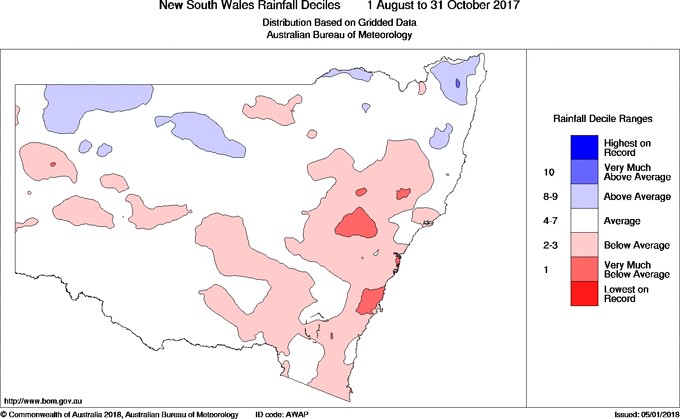
Patterns in October finally return to what was expected, but the damage was done. The STR started its southwards migration and the SAM returned to more ‘normal’ values. Rainfall was patchy with more rain in the western part of NSW and lower rainfall in the east. August to October was below the average at decile three to four with the exception of a wetter region around Jerilderie (Figure 8).
Finally to complete the cropping season, November was significantly wetter at decile seven to eight, but it was too late for most crops but good for lucerne pastures. Additionally, it was decile 10 in December, which adversely affected grain quality but supported lucerne growth. What happened here? The STR did not settle at its ‘normal’ southern Melbourne position and continued moving down to Tasmania. This, combined with lower pressure at Darwin and the onset of a weak La Niña, allowed for easy moisture troughing down from the tropics.

Figure 8. Decile rainfall distribution for August to October 2017 across NSW.
Conclusion
2017 was a confusing and frustrating year for many climate related reasons. While the early predictions of El Niño failed to come to fruition, half the models were consistently suggesting a drier trend to the season, which did eventuate.
A history of model watching over 10 years suggests that when half the models indicate something different than average, it usually occurs.
Useful resources
Subscribe to the Break newsletters
Contact details
Dale Grey
cnr Taylor St and Midland Hwy, Epsom, Vic
03 5430 4444
dale.grey@ecodev.vic.gov.au
@eladyerg
Was this page helpful?
YOUR FEEDBACK
