What is the fate of buried water repellent topsoil? Does it remain repellent?
Author: Stephen Davies, Chad Reynolds, Joanne Walker, Department of Primary Industries and Regional Development | Date: 26 Feb 2018
Key messages
- The repellence of inverted (buried) water repellent topsoil is reduced by 70% on average compared to adjacent surface topsoil that has otherwise been managed identically.
- The decline in repellence of severely repellent buried topsoil can be rapid, with a decline of 79% in 1-year at one site.
- Build-up of surface repellence is slow and is unlikely to exceed low levels within the first 10-years except in cases of incomplete soil inversion in soils with low clay content.
Aims
To assess the impact of soil inversion over time on:
- Water repellence of buried topsoil and inverted subsoil turned up to the surface
- Fertility of buried topsoil and inverted subsoil turned up to the surface
Introduction
One-off strategic inversion of sandplain soils has been undertaken by growers in WA since 2007 as a means of soil renovation with the aim of ameliorating soil constraints and burying herbicide resistant weed seeds. One of the principal soil constraints being targeted by growers undertaking this type of renovation is removal through burial of water repellent topsoil, creating a new wettable soil surface. Two key questions arising from the use of one-off soil inversion practices to manage repellent topsoil have been:
- What happens to the buried repellent topsoil – does it stay repellent?
- What happens to the subsoil inverted (brought up) to the soil surface – how quickly does it become repellent?
As well as changing the distribution of repellent soil in the soil profile, inversion results in the redistribution of soil, organic matter and soil nutrients, and the long-term consequences of inversion on these soil fertility properties also need to be understood. It is possible that topsoil nutrient availability is increased through inversion as the nutrients are put into the root zone, typically 15-25cm, where the soil in this zone is protected from rapid evaporation remaining wetter for longer. This may result in rapid mining and depletion of nutrients in this buried topsoil layer in the first few years after inversion, or this layer may still remain important for intercepting and retaining nutrients in the root zone.
Method
In March 2017 a series of paired-soil sampling surveys were undertaken across 11 commercially managed paddocks comparing the repellence and other soil properties of inverted (buried) repellent topsoil and subsoil with adjacent identically managed untilled topsoil and subsoil. The properties were located in the northern WA wheat belt in a zone from Mingenew to Meckering (Table 1). Soil inversion had been undertaken on sandplain soils as a one-off soil amelioration using commercial scale mouldboard ploughs at all sites, but comparative adjacent areas within the same paddock had been left undisturbed. The date of soil inversion varied across the sites having been carried out between 1-9 years previously resulting in comparisons where topsoil had been buried for varying lengths of time.
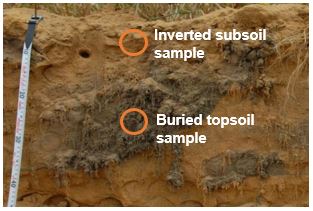
Sampling at each site was undertaken as a series of paired comparisons using small soil pits so that buried topsoil could be accurately sampled. Samples were collected from the top 10cm and from the subsoil at a depth equivalent to where the bulk of topsoil was buried for both inverted and untreated soils (Image 1). Samples were air-dried and put through a 2mm sieve to remove coarse components. Soil water repellence analysis was conducted on all of the samples collected using the standard Molarity of Ethanol Droplet (MED) laboratory test (King 1981). Additional soil fertility analyses were conducted on a subset of samples from 5 sites to measure and compare soil pH, organic carbon and soil nutrients.
Image 1. Image of an inverted soil and sample locations for buried topsoil and inverted subsoil. Soil from equivalent locations and depth would be collected from paired sites in the untreated (control) soils.
Sample Site Location | Soil Inversion Year | Years Inverted | Soil Groups of Western Australia Classification | Soil Water Repellence, 2017 | |
|---|---|---|---|---|---|
Molarity of Ethanol Droplet, MED (undisturbed topsoil) | Rating | ||||
Meckering | 2016 | 1 | Gravelly pale deep sand | 3.0 | Severe |
Mingenew | 2014 | 3 | Yellow deep sand | 1.4 | Moderate |
Marchagee-1 | 2013 | 4 | Yellow deep sand | 1.7 | Moderate |
Marchagee-2 | 2013 | 4 | Yellow deep sand | 1.4 | Moderate |
Badgingarra-2 | 2011 | 6 | Pale deep sand | 2.3 | Severe |
Badgingarra-1 | 2010 | 7 | Pale deep sand | 3.1 | Severe |
Goomalling-3 | 2010 | 7 | Yellow deep sand | 1.9 | Moderate |
Goomalling-4 | 2010 | 7 | Deep sandy gravel | 2.7 | Severe |
Goomalling-1 | 2009 | 8 | Yellow deep sand | 2.5 | Severe |
Goomalling-2 | 2009 | 8 | Yellow deep sand | 1.4 | Moderate |
Irwin | 2008 | 9 | Gravelly pale deep sand | 3.0 | Severe |
Results
Soil Water Repellence
Water repellence in untreated control topsoil ranged from moderate to very severe across the sites. Repellence was highest, very severe, on pale deep sand at Badgingarra-1, with Irwin and Meckering at the top of the severe range, verging on very severe (Table 1; Fig. 1). For the controls, subsoil repellence was either nil or very low while the inverted subsoil ranged from nil to moderate repellence (Fig. 1). Inverted subsoil with moderate repellence occurred on sites with severely repellent pale sandy topsoil and relatively shallow inversion that had been undertaken 6 or more years previously. Shallow inversion at Badgingarra-1 and 2 was a result of using a mouldboard plough with relatively shallow boards and no skimmers while at Goomalling-4 shallow ploughing was due to high gravel content and resulted in incomplete inversion. Of particular interest is the repellence of the inverted (buried) topsoil and how this compares to the control topsoil. Across all the sites, irrespective of length of time buried, only one site (Goomalling-4) had a repellence rating of moderate with all the rest having low repellence (Fig. 1). Repellence of the buried topsoil across the sites was 43-95% lower than the untreated topsoil. The reduction in repellence appears to be rapid with 80% lower repellence in the topsoil that had been buried for 1 year at Meckering compared with 70% lower repellence in topsoil buried for 9 years at Irwin (Fig. 1). The higher repellence of the buried topsoil at the Goomalling-4 site is likely a result high gravel content causing shallow inversion with partial mixing.
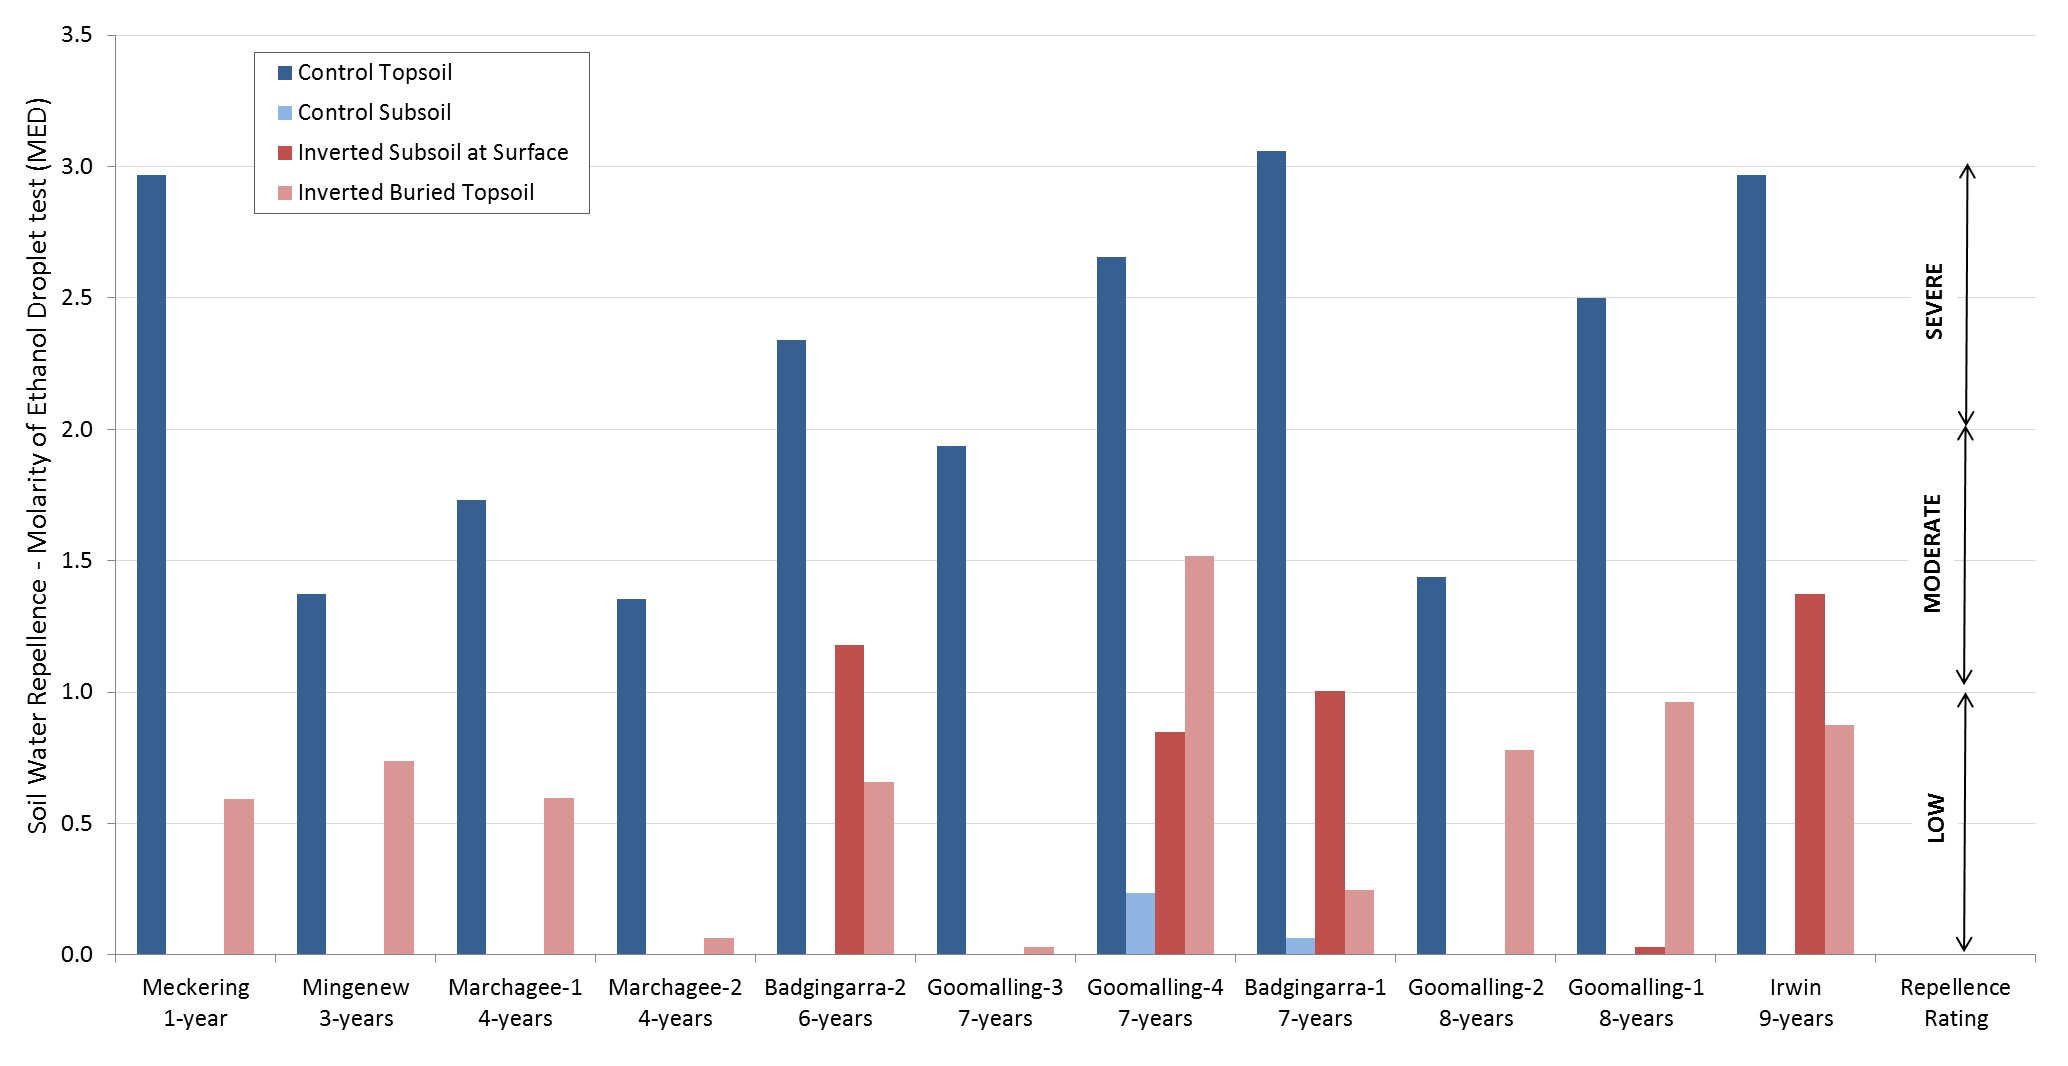
Figure 1. Molarity of ethanol droplet measures and severity ratings of soil water repellence for control (no tillage) and inverted sandplain topsoil and subsoil samples collected in March 2017 from a range of sites in the northern agricultural region of Western Australia.
Soil Fertility
In sandplain soils organic matter in the topsoil has an important role for retention and turnover of nutrients. Burial of organic matter in the topsoil may alter the availability and retention of nutrients. Soil inversion results in an immediate re-distribution of the total soil organic carbon into the subsoil, while inverted subsoil brought to the surface is low in total organic carbon (Fig. 2, Meckering site). Re-building of organic carbon in the surface of an inverted soil is a slow process and the total organic carbon remains low after 8 years of continuous cropping and stubble input (Fig. 2, Goomalling-1 site). Higher total organic carbon levels in the topsoil inverted into the subsoil are also persistent, lasting at least 8 years at the Goomalling-1 site (Fig. 2). This has implications for soil nutrient supply and similar redistribution patterns to total organic carbon occur for nitrate nitrogen (Fig. 3) and sulphur (Fig. 4) irrespective of how long the soil has been inverted for. Applied nitrogen and sulphur would readily leach out of the low organic matter and clay content topsoil for the inverted profiles. This was consistent across the five sites tested with surface sulphur levels less than 8 mg/kg across all sites with several less than 2 mg/kg (data not shown). Higher nitrate and sulphur levels have persisted in the buried topsoil after 8-years suggesting that at least some of the applied fertilizer is being intercepted and retained.
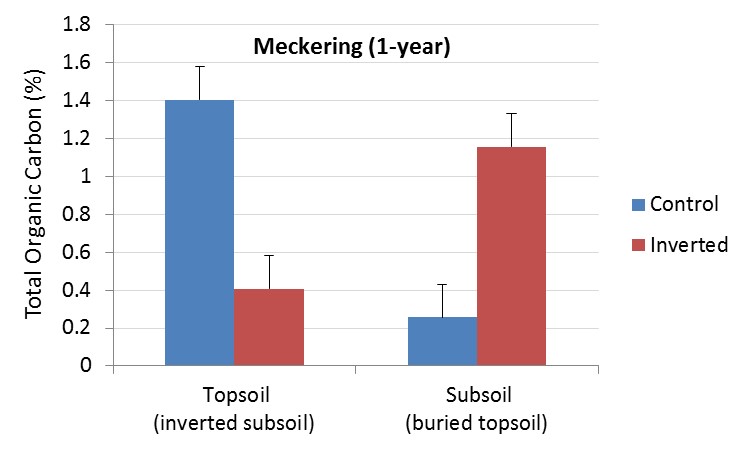
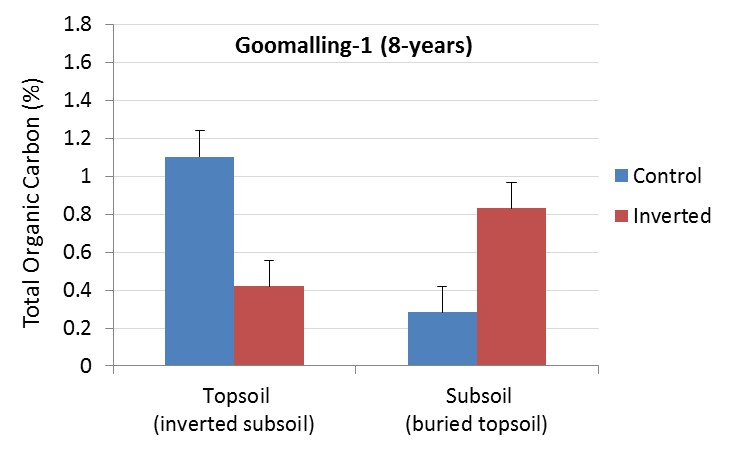
Figure 2. Total organic carbon % in topsoil and subsoil samples from continuously cropped paddocks with control (no-till) and inverted soils at Meckering (inverted for 1-year) and Goomalling (inverted for 8-years). Bars show least significant difference (LSD P = 0.05).
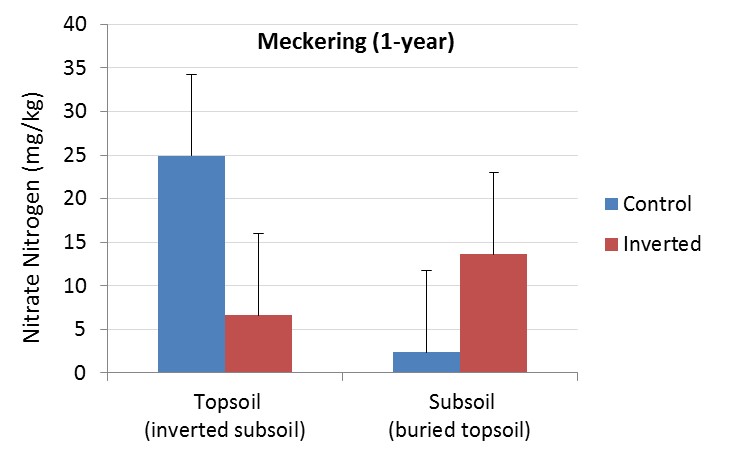
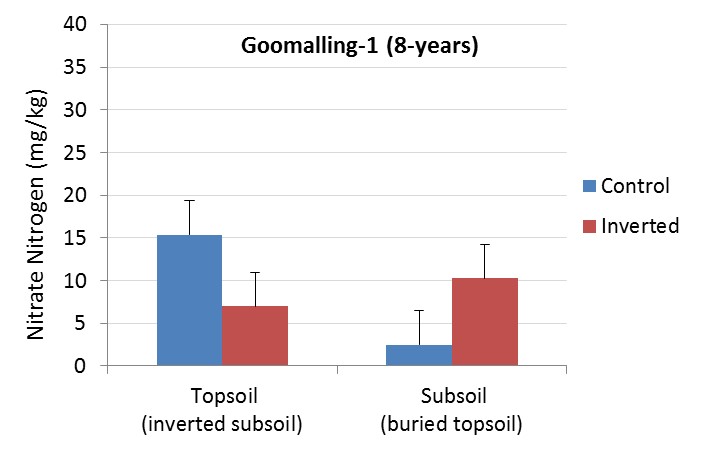
Figure 3. Soil nitrate concentration (mg/kg) in topsoil and subsoil samples from continuously cropped paddocks with control (no-till) and inverted soils at Meckering (inverted for 1-year) and Goomalling (inverted for 8-years). Bars show least significant difference (LSD P = 0.05).
Inversion impacts on potassium were variable with decreases at Badgingarra and Marchagee, increases at Goomalling and Irwin, and no change at Meckering (data not shown). The impact of inversion on soil phosphorous tended to be small across the five sites. At Badgingarra and Marchagee, soil phosphorous levels were slightly lower with inversion while at the other sites there was no significant difference (data not shown).
Soil pH is dependent on lime applications both before and after soil inversion. This is demonstrated by the results for the comparative sites (Fig. 5). At Meckering there had been lime applied a year prior to the soil inversion being undertaken but there had not been lime applied since. As a result the buried topsoil had a pHCa of 5.6 but the subsoil brought to the surface had a pHCa of 4.5 (Fig. 5). At Goomalling-1, 1.2 t/ha lime was applied immediately prior to inversion and a further 1.2 t/ha was applied after. This has resulted in a pHCa of 6.2 for both the topsoil and the subsoil samples from the inverted soil.
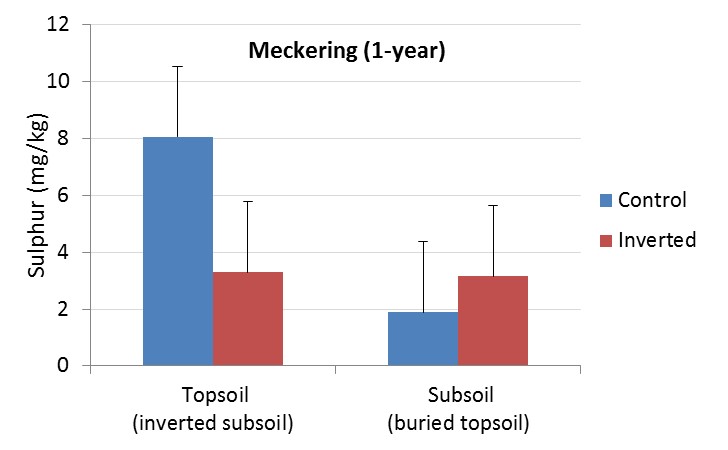
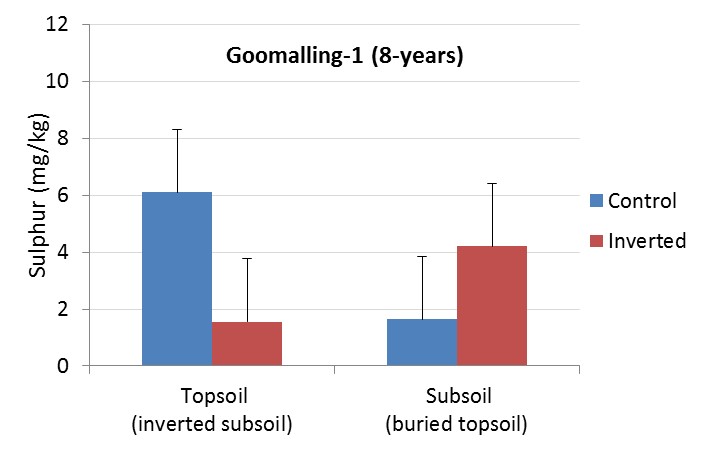
Figure 4. Soil sulphur concentration (mg/kg) in topsoil and subsoil samples from continuously cropped paddocks with control (no-till) and inverted soils at Meckering (inverted for 1-year) and Goomalling (inverted for 8-years). Bars show least significant difference (LSD P = 0.05).

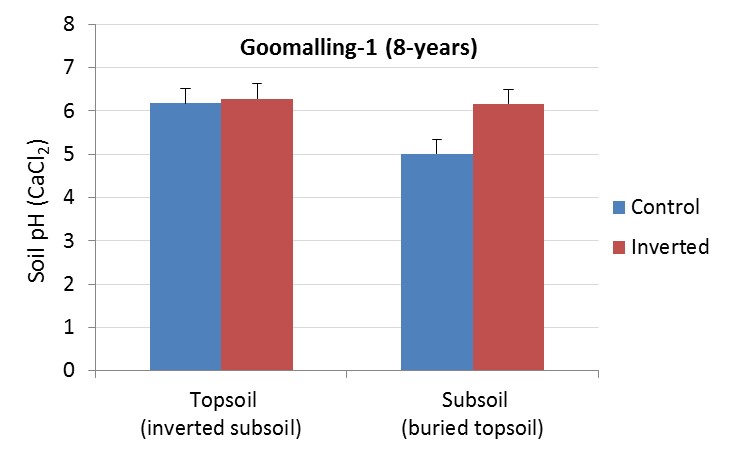
Figure 5. Soil pH (CaCl2) in topsoil and subsoil samples from continuously cropped paddocks with control (no-till) and inverted soils at Meckering (inverted for 1-year) and Goomalling (inverted for 8-years). Bars show least significant difference (LSD P = 0.05).
Conclusion
One of the concerns about the use of soil inversion to manage water repellent soils has been that in future inversion may result in the formation of a much deeper water repellent layer if the repellence of the buried topsoil did not break-down once it was buried. This could potentially result in a deeper water repellence layer in the longer term, making such soils even harder to manage. One hypothesis regarding the buried topsoil was that microbes which can break-down water repellence would likely be active and so would reduce the repellence over time, particularly as this layer wets up and stays wetter for longer. The findings of this survey approach support this hypothesis, with, rapid (1-year) and sustained declines in the repellence of buried topsoil. Over all the sites repellence of the inverted topsoil was reduced by an average of 70% compared to the topsoil at the surface. Build-up of soil water repellence in inverted subsoils, brought to the surface, is dependent on many factors including inversion depth, topsoil clay content, net primary productivity and biological activity. Evidence from this research suggests that build-up of surface repellence is slow and is unlikely to exceed low levels within the first 10-years.
Soil fertility measurements also suggest that changes in distribution of organic carbon and nutrients, particularly nitrate and sulphur, are also persistent. Like repellence, organic carbon is slow to build up in the surface of inverted soils but remains higher in the buried topsoil even after 8 or 9 years. Soil inversion can improve crop growth and grain yield and nutrition strategies post-inversion will need to account for the increased demand. Growers undertaking soil inversion need to be aware that the changes in the soil profile are substantial and will last more than 10 years. This means that water repellence on inverted soils will be ameliorated for the long-term but organic carbon and some nutrients will remain low in the surface soil for an extended period.
References
King PM (1981) Comparison of the methods for measuring severity of water repellence of sandy soils and assessment of some factors that affect its measurement. Australian Journal of Soil Research, 19: 275-285.
Acknowledgments
The research undertaken as part of this project is made possible by the significant contributions of growers through both trial cooperation and GRDC investment; the authors would like to thank them for their continued support. This research has been conducted through DAW00244 soil water repellence project, part of GRDC’s Soil Constraints West group of projects. The authors acknowledge the growers and their families who provided the site access and information to make this research possible, thanks to: Rod Cosgrove; Alex Pearse; Michael O’Callaghan; Colin McAlpine; Andrew Kenny; Michael McGill and Ty Fulwood.
GRDC Project Number: DAW00244
Peer Reviewed By: Dr Ed Barrett-Lennard
Was this page helpful?
YOUR FEEDBACK

