What’s the likelihood of Goulburn, Murray and Murrumbidgee River inflows in 2018?
Author: Dale Grey (Agriculture Victoria, Bendigo) | Date: 26 Jul 2018
Take home messages
- The season is delicately poised, no El Nino, but the prediction of a late one is forming.
- Plenty of random things need to happen before one could form.
- The Indian Ocean isn’t playing unfair like it often does before an El Nino forms.
- Stronger pressure needs to decrease, or the effect could be similar to either phenomena.
Introduction
The last time I spoke at the Moama GRDC Grains Research Update was July 2015 and a full blown El Nino was occurring. 2015 turned out to be a challenging spring however, in 2018 things are very different. Many models are predicting an El Nino for this spring and the odd model is forecasting it even earlier, during late winter. Looking at all but one climate indicator, nothing seems to be within a ‘bull’s roar’ of looking like an El Nino. Yet, despite this, rainfall in many areas has been less than average so far.
So, what has got the models so fired up this year? It’s all to do with the undersea heat that has developed in the eastern Equatorial Pacific as a result of a strong burst of reversed trade winds in February. This strong west wind near Papua New Guinea sent warm water under the Pacific and on its way over to the South American coast. Such a beginning is essential for the start of an El Nino, but it fortunately doesn’t guarantee one.
Looking at some recent undersea cross section data from1982 to current date, the years where undersea temperatures were warm at this time of the year have been extracted and followed onto spring to see what eventuated (Table 1).
Table 1. Years during which undersea temperatures were warm during July and the resulting spring.
Winter Equatorial Pacific to depth | Spring Equatorial Pacific to depth | |
|---|---|---|
1982 | Weak warming at depth (dry) | Very warm and an El Nino Sept-Dec (dry) |
1986 | Weak warming at depth (wetter) | Weak warming and weak short lived El Nino Oct-Dec (wetter) |
1987 | Moderate warming at depth and El Nino from May-Aug (wetter) | Warming decreased but weak El Nino till Nov (drier) |
1991 | Moderate/weak warming at depth (wetter) | Strong warming and El Nino in Oct-Dec (drier) |
1994 | Weak warming at depth (drier) | Moderate warming for El Nino in Oct-Dec (drier) |
1997 | Strong warming at depth and El Nino June-Aug (drier) | Strong warming at depth and El Nino Sep-Dec (average) |
2001 | Moderate warming in Jul (average) | Warming decayed to neutral Aug-Dec (average) |
2002 | Strong warming at depth (drier) | Strong warming at depth and El Nino Aug-Dec (drier) |
2004 | Moderate warming in Jul (average) | Weak to no El Nino (average) |
2006 | Moderate/weak warming at depth (drier) | Strong warming and El Nino in Oct-Dec (drier) |
2009 | Strong warming to depth El Nino in Jun-Jul then decayed (average) | Strong warming to depth El Nino in Oct-Dec (average) |
2012 | Moderate/weak warming at depth (drier) | Warming decayed to neutral Aug-Dec (drier) |
2014 | Moderate/weak warming at depth (drier) | Warming decayed to neutral Aug-Dec (drier) |
2015 | Strong warming at depth and El Nino June-Aug (drier) | Strong warming at depth and El Nino Sep-Dec (drier Vic, wetter NSW) |
Strong warming that developed early and lasted through the season like what happened during 1997, 2009, and 2015 are fortunately not as common as other years. More common are the warming that starts in the winter and develops in the spring, such as what happened during 1982, 1991, 2002, and 2006. There is also a smattering of years that show promise for the development of an El Nino but this does not eventuate, such as what happened during 2001, 2004, 2012 and 2014.
What is clear about all of these years is that the rainfall has been variable in all of them. The odd strong, long-lived event like 2009 had a reasonable rainfall outcome. The late spring developers are often drier, but have often been joined by a positive Indian Ocean Dipole (+IOD) in winter which has resulted in very dry seasons. Likewise, some of the failed El Ninos have been dry due to the +IOD popping up. At this stage of the year the Indian Ocean looks like it is behaving itself, with models highly variable as to its likely course for the season.
So, what of this year? Well apart from the warm Pacific undersea, we have, as yet, no El Nino indicators and little evidence of the desire by the Pacific Ocean for one. The Southern Oscillating Index (SOI), trade winds and cloud patterns at the dateline are all not interested at this stage. Even if they started tomorrow it’s unlikely that an El Nino would be seen for many months. And yet things aren’t as wet as we would like. The reason for this has been the domination of higher pressure over South East (SE) Australia for May and June. Sometimes the +IOD and/or El Nino can cause this and other times it’s a frustrating part of natural variability. The finger marks of climate change are also all over such an increase in pressure and this has been on an increasing trend in SE Australia for the last 110 years.
Figure 1, 2 and 3 show historic tercile (thirds) river flow outcomes for the Goulburn, Murray and Murrumbidgee catchments in various years. High pressure during winter has strong effects at drying out the catchment, but not in every year. As does the effect of high pressure during winter on spring flow rates; there’s a memory in the system that lasts due to the slow charging of the catchment. El Nino has the classic drying (but not always) effect, quite like higher pressure.
Figure 1, 2 and 3 also indicate the effect of the so called ‘neutral years’ where the Pacific and Indian Ocean do nothing. Historically river flow has been close to climatology in those years, i.e. an equal third of the time the outcome has been drier, average or wetter. It’s for the same reason that model predictions for average rainfall are actually the same as ‘neutral’. Occasionally models have a stronger probability of average being the outcome, but in my years of monitoring models, this has been uncommon.
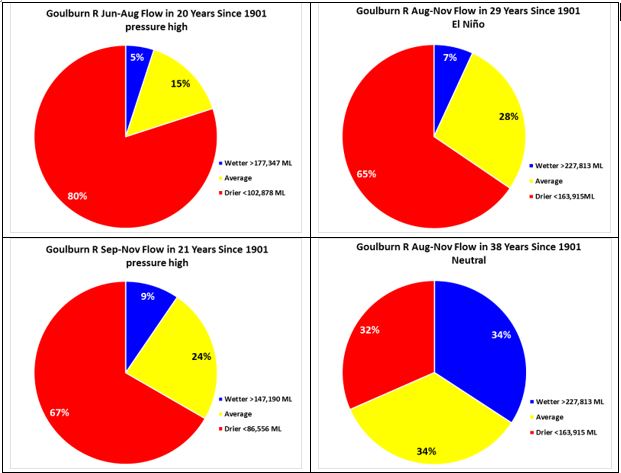
Figure 1. Goulburn River flows since 1901 when the season has experienced high pressure, El Nino or it has been a ‘neutral’ year.
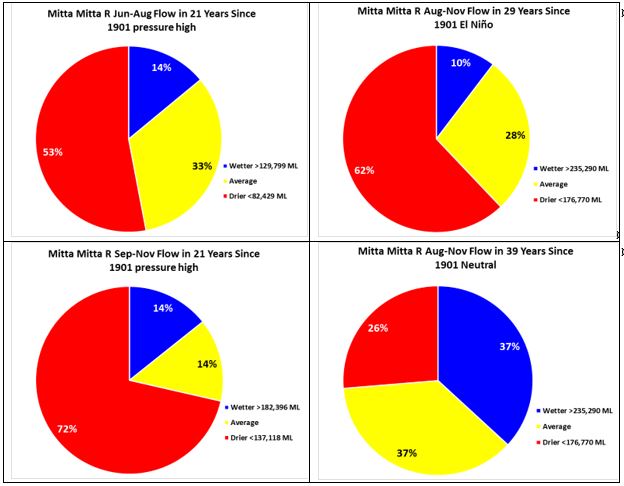
Figure 2. Mitta Mitta River flows since 1901 when the season has experienced high pressure, El Nino or it has been a ‘neutral’ year.
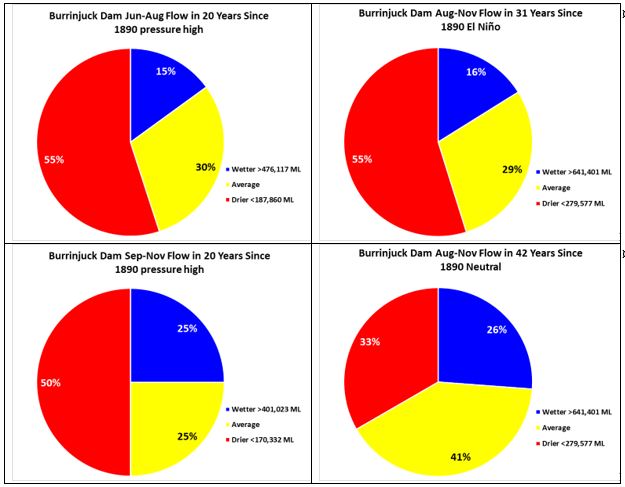
Figure 3. Burrinjuck Dam intake since 1901 when the season has experienced high pressure, El Nino or it has been a ‘neutral’ year.
Contact details
Dale Grey
Agriculture Victoria, Bendigo
0354304444
Dale.grey@ecodev.vic.gov.au
Twitter: @Eladyerg
Was this page helpful?
YOUR FEEDBACK