Climate variability – how to build resilience through financial management
Author: Kim Bowman and Simon Fritsch (Agripath) | Date: 12 Feb 2019
Take home messages
- Get to know the production and financial targets for your business.
- High gross margin crops – are a factor of crop choice and frequency in your environment.
- Operate a low-cost business – do you know what it costs to run your business?
- Grain storage - reduced harvest risk, value add from blending and managing cashflow.
- Managing debt – strong businesses utilise debt to grow their business
Background
Each year there is a large variation in farmer returns in any given region (ie where soil types and climatic conditions are similar). Why is this so?
The average cropping farmer, according to ABARE figures shows a profit of approximately 3% of assets managed. Agripath benchmarking dataset includes farmers that average approximately 6% of assets managed, while the top 20% of farms achieved more than 10%.
This means there is potential to lift annual profit from around $300,000 to $1,000,000 on a typical farm where the value of land and machinery is around $10 million.
Financial management strategies to combat climate variability
Agripath has identified a number of key financial management strategies to focus on for building financial resilience in the Northern Grains region:
- Know the production and financial targets for your business.
- Optimise crop choice, sequence and frequency of your high gross margin crops.
- Run a low-cost business.
- Manage debt.
Agripath in conjunction with a GRDC project (RDP00013) titled ‘The integration of technical data and profit drivers for more informed decisions’have determined a series of key financial targets for farmers to achieve the ‘magical’ 8% Return On Assets Managed (ROAM).
- Asset Turnover (Income/Asset Value) – aim for gross income to be >20% of the asset value.
- Direct Costs – aim to keep the direct costs <50% of gross income.
- Gross Margin (Income – Direct Costs) - aim for the gross margin to be >10% of asset value.
- Overhead costs – aim to keep overhead costs at <10% of gross income.
- Operating Profit (Profit/Asset Value) – gross margin less overhead costs equals operating profit, aim for a target of 8%.
The aspirational financial targets for various dryland grain growers in the Northern Grains region are represented in Table 1.
Table 1. Financial targets for an example set of dryland grain growers in the Northern Grains region (2013/14 to 2015/16).
High Rainfall Dalby, Spring Ridge | Medium Rainfall Moree, Gunnedah | Lower Rainfall Miles, Springsure | ||||
|---|---|---|---|---|---|---|
Target | $/ha | Target | $/ha | Target | $/ha | |
Average Dryland Asset (Land plus machinery) | 8,000 | 5,000 | 3,500 | |||
Asset Turnover (Income/Asset) | 18% | 1,440 | 20% | 1,000 | 20% | 700 |
Direct Costs (Direct costs/income) | 50% | 720 | 50% | 500 | 50% | 350 |
Gross Margin (GM/Asset) | 9% | 720 | 10% | 500 | 10% | 350 |
Overhead (Overhead/Income) | <10% | 144 | <10% | 100 | <10% | 70 |
Operating profit (Profit/Asset) | 7.2% | 576 | 8.0% | 400 | 8.0% | 280 |
Crop choice, crop sequence and crop frequency
Farmers that understand their production system of soil constraints and climate variability, are more able to develop resilient farming systems that are profitable in their environment.
The key component of a profitable farming system is having a crop rotation plan that has a sequence and frequency of crops that have the potential to achieve above their targets as listed in Table 1. The crop sequence needs to be achievable and sustainable, in other words, the crop sequence utilise must best complement the environment it is grown in.
In most farming systems a percentage of fallow will be required as part of the cropping sequence. Fallow provides flexibility with crop choice and can add to the gross margin of subsequent crops. In general, the lower the rainfall the higher the average fallow percentage and in the higher rainfall areas potentially less fallow percentage.
Crop sequence is often strategically planned around a ‘pillar crop’. A ‘pillar crop’ refers to the main high gross margin crop suited to your environment. The management of this ‘pillar crop’ involves a carefully planned sequence of crops and farming activities that will maximise the opportunity for the ‘pillar crop’ to achieve its potential. The ‘pillar crop’ will vary from farm to farm and region to region based on soil type, location, climate and the farmers passion for that crop to succeed.
High crop gross margins
In general, top performing farms grow high gross margin crops, due to a combination of crop selection, high crop yields and low farm costs. Top performers understand the relationship between yield, price and plant available water and its ability to produce margin in their environment.
The Agripath data collected from up to 300 farms over a 5–10 year period clearly indicates that high yield correlates strongly with high margin and high margin correlates strongly with high ROAM.
In Figure 1 the results from the Agripath 17/18 Profit Focus program conducted on the Darling Downs shows a clear correlation between gross margin and ROAM.
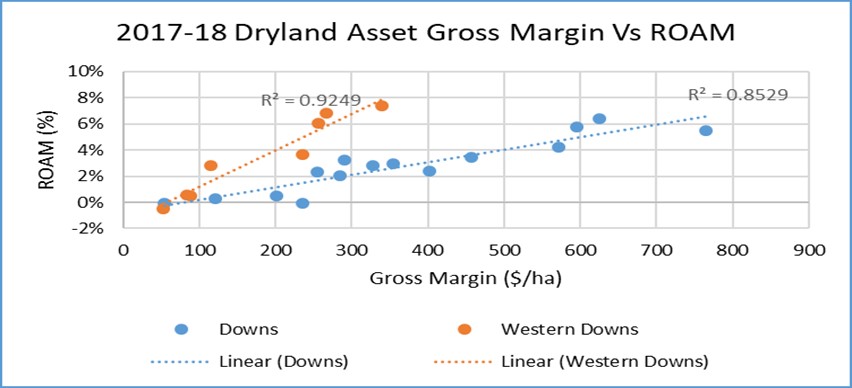
Figure 1. Darling Downs Average Gross Margin V ROAM% by Region 2017-18 (Source: Agripath).
High margin is determined by high yield
Figure 2 demonstrates the correlation between yield and gross margin for breadwheat in the North West NSW region in the 2017/18 year. This figure is indicative of the results produced by breadwheat but also by most other crops across 10 years of data. Collection. This is not to say that price and marketing are not important, but it does emphasise that growing the crop is critical.
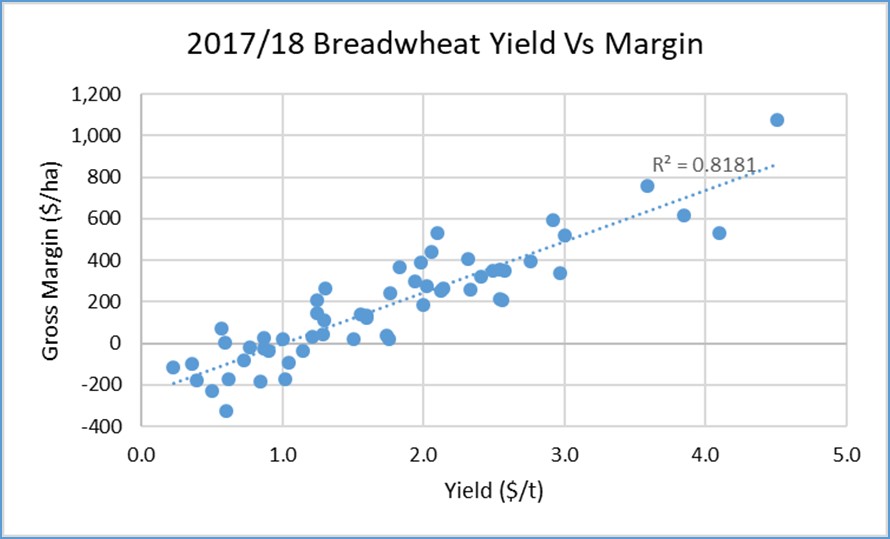
Figure 2. North-West NSW region average yield and gross margin for breadwheat for the 2017/18 season (Source: Agripath).
Business profit is helped by a low-cost business
Table 2 summarises the major cropping costs in two of the major cropping areas in the northern cropping region.
Table 2. Three-year summarised costs for NW NSW and the Darling Downs (14/15 – 16/17) (Source: Agripath database).
| Costs ($/Ha) | NW NSW West | NW NSW East | Downs West | Downs East |
|---|---|---|---|---|
| Area (ha) | 9101 | 5842 | 4702 | 1523 |
| Input/Area Costs | 149 | 222 | 181 | 303 |
| TPML | 164 | 168 | 189 | 300 |
| Yield | 44 | 53 | 38 | 80 |
| Overheads | 47 | 82 | 55 | 73 |
Input/area costs
Chemical costs are one of the single major costs for most farms in this modern era of conservation farming. Efficiencies in this area when planning your cropping rotations are:
- The tactical use of residual chemicals,
- the use of camera active spray rigs in the fallow, and
- timeliness of operation.
In cases where a crop is failing sometimes the early decision to spray out may be the best option.
Total plant machinery and labour (TPML)
TPML is often one of the highest costs areas of a business. In the figures shown in Table 2 there is an allowance for depreciation of 15% per annum on farm machinery and plant and an allowance for any unpaid family labour. These two key components are not often fully accounted for in many gross margin analysis.
Yield costs
On-farm storage is providing opportunity for farmers to be astute about managing risk by storing grain when it is at low prices and holding it until prices rise, with corresponding increase in gross margin. However, this needs to be balanced with the cashflow demands of the business.
Overhead costs
The main management consideration with overhead costs is to ensure that on average they are at or below 10% of crop income. If they are rising above this level then you may need to have a closer look at your overhead costs and look at areas where you can cut back.
All of the pre-mentioned costs need to be reviewed in relation to the gross margins you can achieve from the crops you chose to grow and your cropping frequency.
Grain storage
Early harvest with in-silo drying can save grain quantity and quality and/or extend the harvest period or usefulness of a grain harvester. In-silo drying uses large air flows, and therefore, takes longer than continuous flow drying, but it is much cheaper. Other benefits from on-farm storage, include savings in freight costs and marketing price advantages. The possible costs and benefits of storage are summarised in Table 3.
Table 3. Costs and benefits of storage, with in-silo drying.
Costs of storage ($/t) | Benefits of storage ($/t) | ||
|---|---|---|---|
Capital cost | $160 | Harvest logistics – reduced shattering, weather damage $250/t x 15% loss x 33% of years | $12.00 |
Depreciation over 30 years = 3.4% p.a. of cost | $5.40 | Marketing price advantage: $250/t x 10% extra, 30% of years | $7.50 |
Opportunity cost: half of interest cost of 6% | $4.80 | Savings on freight and/or central storage costs | $6.00 |
Operating cost – aeration, hygiene, repairs | $5.80 | Extra value from blending moisture and quality grades | $2.50 |
Total costs of storage | $16.00 | Total benefits of storage | $28.00 |
Farm storage offers a natural hedge and the potential to manage cashflow with carryover grain in poor seasons where prices naturally rise on the eastern seaboard due to low supply. High profit growers produce the grain to attain high gross margin and then can manage its marketing with storage as they do not have the cashflow constraints of average farms which are forced to sell to meet cash flow commitments. Most farms don’t have a marketing problem, it is instead a failure to produce enough grain to meet the financial commitments of the business, that dictates the marketing triggers (i.e. cashflow requirements trigger grain sales rather than other factors).
Debt management
Debt is something that most businesses must live with. High profit businesses utilise debt to grow their businesses, whereas average performing businesses struggle to service debt. Table 4 demonstrates the potential of a high margin business to manage debt in comparison to an average performing business.
Table 4. Difference in debt servicing between a top and an average performing business.
Top Performing business | Average Performing business | |
|---|---|---|
Asset Value | $6000/ha | $6000/Ha |
Income $/Ha | $1200 | $900 |
Direct Cost $/ha | $600 | $600 |
Gross Margin $/ha | $600 | $300 |
Overhead $/ha | $120 | $120 |
Operating Profit $/ha | $480 (8%) | $180 (3%) |
Interest @ 30% debt 5% interest | $90 | $90 |
Profit after interest | $390 | $90 |
Conclusion
- Get to know the production and financial targets for your business.
- High gross margin crops – are a factor of crop choice and frequency in your environment.
- Operate a low-cost business – do you know what it costs to run your business?
- Manage debt – build a high margin business and utilise debt to grow the business
References
GRDC Project ‘The integration of technical data and profit drivers for more informed decisions’
Agripath Profit Focus database (www.agripath.com.au)
Contact details
Kim Bowman
Agripath
0429 309909
kimbowman@agripath.com.au
Simon Fritsch,
Agripath
0428 638 501
simon@agripath.com.au
www.agripath.com.au
Was this page helpful?
YOUR FEEDBACK