Effects of waterlogging on wheat crops and texture-contrast soils in the high rainfall zone of Victoria
Author: Fiona Robertson, Malcolm McCaskill, Dilnee Suraweera, Brendan Christy, Roger Armstrong, Reto Zollinger, John Byron, Steve Clark (Agriculture Victoria Research, Department of Jobs, Precincts and Regions) | Date: 26 Feb 2019
Take home messages
- At three sites in the high rainfall zone (HRZ) of Victoria, the reduction in wheat yield due to waterlogging ranged from nil to 38%, with a decline in total nitrogen (N) uptake from nil to 40%.
- The effect of waterlogging on the crop was influenced by several factors including the depth of waterlogging, the duration of waterlogging, the aeration conditions in the soil and the timing of waterlogging.
- The importance of the various factors varied among sites and further work is required to evaluate their influence in different situations.
Background
Waterlogging during winter is common across many parts of the HRZ of southern Australia, but the impact of this waterlogging on crop production is not well understood. Options for managing waterlogging are currently limited. Drainage (surface or subsurface) has been shown to be effective in some situations but ineffective in others, and has not been widely adopted by growers (DEDJTR 2015). Similarly, raised beds can significantly reduce yield losses from waterlogging in wet years in some, but not all situations (Acuña et al. 2011; Bakker et al. 2007; Riffkin and Evans 2003).
Field trials conducted in the 1980s near Hamilton, Victoria, suggested that wheat yield losses due to waterlogging could vary between nil and 78% (Acuña et al. 2011; Gardner and Flood 1993; MacEwan et al. 1992; McDonald and Gardner 1987), and a similarly wide range of yield loss in cereals has been reported from the HRZ of Western Australia (WA) (16%-85% (Setter 2000)).
Previous research has shown that the adverse effects of waterlogging are due primarily to reduced oxygen availability in the soil, with consequently reduced uptake of nutrients (particularly N) and reduced growth of the tops and roots of the plant (Elzenga and Van Veen 2010).
For the HRZ of south-eastern Australia, however, there is little information on the effects of waterlogging on soil and crops and the consequences for productivity across the region. This study aims to better understand how waterlogging affects soil conditions and crop growth (particularly relating to N).
Method
Field experiments were conducted in the HRZ of Victoria to investigate the effects of differing degrees of waterlogging on soil conditions and growth of the crop. The focus was on wheat on texture-contrast soils, which is the dominant soil type covering more than 70% of the zone (MacEwan et al. 2010). These soils are naturally prone to waterlogging after rainfall as water accumulates in the loamy topsoil because of slow drainage through the heavy clay subsoil, leading to the development of a ‘perched water table’ (Cox and McFarlane 1995; MacEwan et al. 1992). The soil can be defined as waterlogged if a water table is present, even if it is not visible at the surface.
In 2017, experimental sites were established at Hamilton, Glenthompson and Tatyoon. The Hamilton sites were on the Agriculture Victoria Research farm on raised beds and the Glenthompson and Tatyoon sites on commercial farms. All sites were sown to wheat (cv. Trojan at Hamilton and Tatyoon, Beaufort at Glenthompson) shortly before the experimental areas were set up.
At each site (paddock), three locations (approx. 20m x 20m) were selected that differed in their expected susceptibility to waterlogging (as judged by the landholders and project team). These locations were termed ‘Dry’, ‘Medium’ and ‘Wet’ and were positioned on the upper, middle and lower parts of the paddock, respectively. The central part of each location (approx. 8m x 12m) was reserved for experimental measurements and sampling. Irrigation was applied during winter to the Wet location at Hamilton (~100mm) and Tatyoon (~85mm) to ensure waterlogging. Total annual rainfall was 674mm at Hamilton, 595mm at Glenthompson, and 520mm at Tatyoon. The soils were of similar texture at all sites and locations, with the heavy clay subsoil at an average depth of 30cm.
At each location, instruments were installed to measure soil moisture content (neutron moisture meter and EnviroPro® probes), the height of the water table (piezometer tubes containing Odyssey® water level sensors) and crop root growth (CI-600 in-situ root imager). Soil aeration status (redox potential) was measured at the Wet locations (Paleo Terra redox probes). Soil chemical and physical properties were assessed at the start of the season from soil cores taken to 1.3m depth. The crop was sampled from quadrat cuts at key growth stages (booting, anthesis and maturity) for dry matter and N analysis.
Results
Crop growth and N uptake
Grain yield at Hamilton and Glenthompson was reduced in the Wet locations compared to the Medium and Dry locations, which were similar. Grain yield at Tatyoon did not differ significantly among the Dry, Medium and Wet locations (Figure 1). The yield reduction at Glenthompson (2.1t/ha, 38%) was primarily due to a reduced number of ears, while the yield reduction at Hamilton (1.7t/ha, 20%) was mainly due to reduced grains per ear (Table 1). Total plant N uptake at maturity was also lower at the Wet location than the Medium and Dry locations at Hamilton (14% reduction) and Glenthompson (40% reduction), but not at Tatyoon. Grain N percentage was lower in the Wet location at Glenthompson only (Table 1). These trends were also evident in total above ground crop biomass and total N uptake at the booting and anthesis stages (data not shown). Root length at maturity in the top 48cm of soil was lower at the Wet than at the Dry and Medium locations (by 15%, 47% and 13% at Hamilton, Glenthompson and Tatyoon, respectively).

Figure 1. Wheat grain yield at the experimental sites. Bars show standard error.
Table 1. Wheat yield components at the experimental sites.
Site | Location | Ear number (m2) | Grain number (m2) | Grain number per ear | Grain N yield (t/ha) | Total plant N uptake (t/ha) | Grain protein content (%) | |
|---|---|---|---|---|---|---|---|---|
Hamilton | Dry | 584 | 22,626 | 39 | 0.19 | 0.29 | 12.8 | |
Medium | 647 | 23,883 | 37 | 0.19 | 0.29 | 12.7 | ||
Wet | 587 | 17,410 | 29 | 0.15 | 0.25 | 12.8 | ||
Glenthompson | Dry | 349 | 17,054 | 49 | 0.13 | 0.16 | 13.8 | |
Medium | 361 | 16,797 | 47 | 0.12 | 0.14 | 13.4 | ||
Wet | 226 | 11,228 | 49 | 0.08 | 0.09 | 12.4 | ||
Tatyoon | Dry | 464 | 14,421 | 31 | 0.14 | 0.25 | 15.3 | |
Medium | 475 | 13,866 | 30 | 0.14 | 0.22 | 15.0 | ||
Wet | 504 | 14,884 | 30 | 0.15 | 0.23 | 15.4 |
Soil conditions
Soil moisture content was at or near saturation between June and the beginning of October over most of the 0-100cm depth at the Dry, Medium and Wet locations at Hamilton, Glenthompson and Tatyoon. All soils began to dry rapidly during October but, due to a large rainfall event in November, they remained close to saturation below the 40cm depth for the rest of the season (data not shown).
A perched water table was present between July and October, sometimes reaching the soil surface, at the Dry, Medium and Wet locations at Hamilton and Glenthompson and the Wet location at Tatyoon. A water table also developed at the Medium and Dry locations at Tatyoon but was much lower and of shorter duration. The general pattern was of a rapid rise in the water table following rainfall with a more gradual decline between rainfall events. The period of high-water table was mostly between the stem elongation and anthesis stages at Hamilton and Tatyoon, and between tillering and booting at Glenthompson. Rainfall and soil data from the Wet locations are shown in Figures 2(a,c), 3(a,c) and 4(a,c).
The depth of the water table and its duration over the season, both important factors for assessing the severity of waterlogging, can be combined in an index called the Sum of Excess Water in the top 30cm (SEW30)(Cox and McFarlane 1995). This is the total amount of waterlogging that occurs each day between the soil surface and 30cm depth over a given period. The SEW30 over the season (Figure 5) increased in the order Dry<Medium<Wet locations at Hamilton and Glenthompson, but there was no difference between the Dry and Medium at Tatyoon.

Figure 2. Depth of the water table (a), soil redox potential (b) and rainfall (c) at the Hamilton Wet location during the 2017 season. Markings represent stem elongation, S; booting, B; anthesis, A; maturity, M; fertiliser application, *; and irrigation, ·
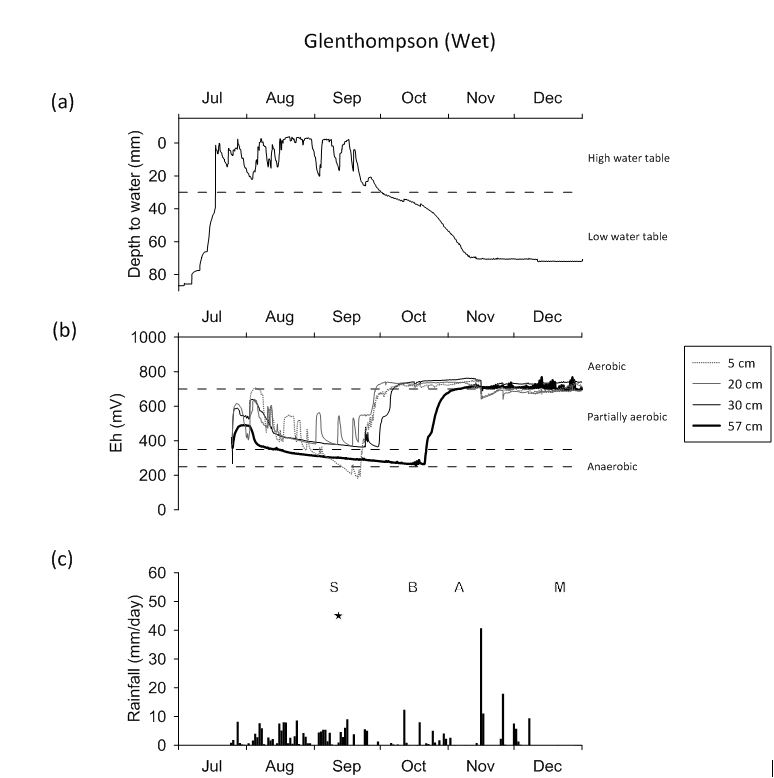
Figure 3. Depth of the water table (a), soil redox potential (b) and rainfall (c) at the Glenthompson Wet location during the 2017 season. Markings represent stem elongation, S; booting, B; anthesis, A; maturity, M; fertiliser application, ê; and irrigation, .
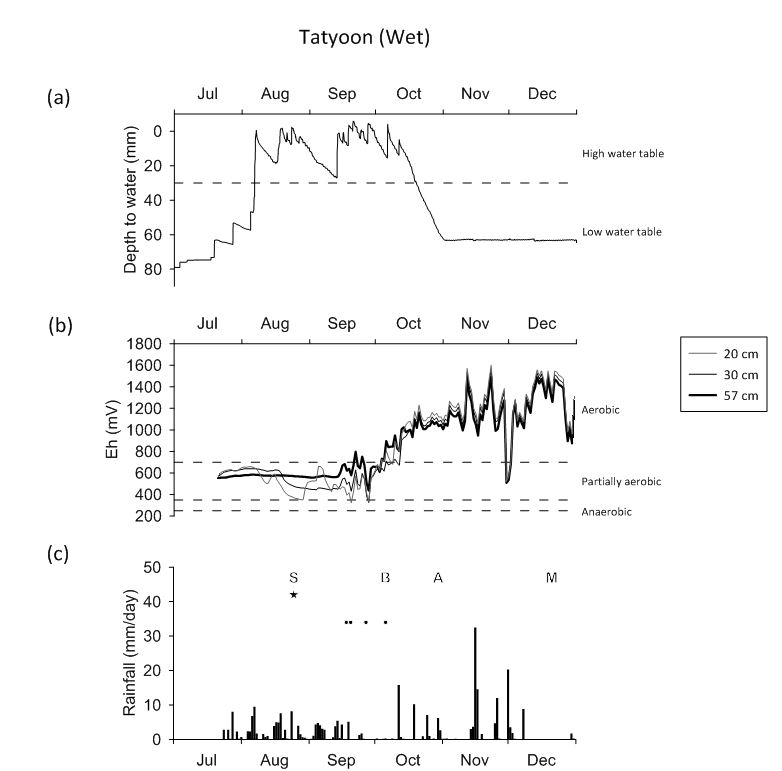
Figure 4. Depth of the water table (a), soil redox potential (b) and rainfall (c) at the Tatyoon Wet location during the 2017 season. Markings represent stem elongation, S; booting, B; anthesis, A; maturity, M; fertiliser application, *; and irrigation, ·

Figure 5. Sum of Excess Water index (SEW30) at the experimental sites indicating the accumulated depth and time of waterlogging in the top 30cm of soil over the 2017 season.
Redox potential, which represents the aeration status of the soil, reads >700mV in fully aerated (aerobic) conditions, 350-700mV in partially aerobic conditions, and <350 when oxygen is completely absent from the soil (anaerobic). Nitrogen loss due to denitrification is most likely to occur around 250-350mV. The redox potentials at the Wet locations are shown in Figures 2(b), 3(b) and 4(b).
At Hamilton, redox potential was in the partially aerobic zone when measurements began in July. With the formation of the water table, redox declined rapidly in the upper soil depths and slowly at the deeper (57cm) depth, into the anaerobic zone, where it stayed until the end of September. Redox began to rise again in October as the water table receded and was generally in the partially aerobic and aerobic zones after October, except for a short drop in aeration status after one heavy rainfall event in November.
At Glenthompson, the water table was already present when measurements started in July and redox potential was mostly in the partially aerobic zone. Again, redox potential generally declined till the end of September, though it did not become as strongly anaerobic as at Hamilton. As the water table receded, redox potential rose rapidly and by the end of October was generally in the aerobic zone, except for some declines in the surface 5cm due to late rainfall.
At Tatyoon, the redox potential was also in the partially aerobic zone in July but, unlike the other sites, it did not decline appreciably with the development of the water table. In fact, redox potential rose into the fully aerobic zone in early October, notwithstanding the presence of a high water table.
Discussion
The SEW30 index showed a large range in the amount of waterlogging at Hamilton, Glenthompson and Tatyoon, but the soil and crop responses to waterlogging differed at each site. The greatest impact of waterlogging was at the Glenthompson site, with an apparent yield loss of 38%. The Glenthompson Wet location had the longest duration of very high water tables, and the soil aeration status was quite hostile until the booting stage. These conditions are likely to have strongly impacted on the growth and functioning of the crop roots and shoots, including by reducing the uptake of nutrients, particularly N. Gaseous loss of N from the soil through denitrification may have further reduced the N supply to the crop. The waterlogging at Glenthompson began about one month earlier than at the other sites and waterlogging damage (reduced plant height and tillering) was clearly visible from the tillering stage. Thus, with early damage and prolonged waterlogging, the crop had little opportunity to recover until the booting stage.
At Hamilton, there was an apparent yield loss of 20% due to waterlogging, despite the presence of raised beds. The period of high water tables resulted in very hostile soil aeration conditions which are likely to have impaired crop growth and N uptake. Loss of N through denitrification is most likely to have occurred near the beginning and end of the waterlogging period, when the redox conditions were less extreme. Given that the soil aeration conditions at Hamilton were more unfavourable than at Glenthompson, it may seem surprising that there was less yield loss at Hamilton than at Glenthompson. However, crop damage may have been limited at Hamilton because waterlogging began relatively late, in early August, when the crop was more advanced (stem elongation stage) with well-developed roots and tillers — this may have helped it survive and recover from the hostile soil conditions.
At Tatyoon, the amount of waterlogging in the top 30cm of soil was intermediate between Glenthompson and Hamilton, yet there was no apparent effect of waterlogging on yield. Soil conditions were considerably less hostile at Tatyoon — the soil remained partially aerobic during the entire waterlogging period. This comparatively mild decline in redox under waterlogging at Tatyoon may be related to its lower soil organic carbon (C) content (1.3% C in the 0-20cm depth, compared to 2.0% C and 2.2% C at Glenthompson and Hamilton, respectively). The low C content would be associated with a lower demand for oxygen by microbes. In addition to the less extreme soil redox conditions, the late onset of waterlogging at Tatyoon (early August), when the crop was relatively advanced (stem elongation), is likely to have enabled better survival and recovery of the crop and minimised yield loss.
Differences in N availability may also have influenced the crop responses to waterlogging. Some loss of N though denitrification is likely to have occurred, particularly at Hamilton and Glenthompson. The timing of N fertiliser application also differed among the sites, with post-sowing applications in the early part of the waterlogging period at Hamilton (75kg urea) and Tatyoon (100kg urea), and applications before (70kg urea) and near the end (120kg urea) of the waterlogging period at Glenthompson. The potential role of N in how crops respond to waterlogging warrants further investigation. The effect of timing of N application is being investigated in another component of the DAV00151 project (not reported here).
It is possible that at Hamilton and Glenthompson, the apparent effects of waterlogging on crop yield were underestimated, as the Dry and Medium locations to which the Wet sites were compared were also waterlogged for part of the season. It was evident that these texture contrast soils can become significantly waterlogged without water being visible at the surface, so waterlogging may be a hidden constraint to production in some situations.
Conclusion
This study compared the response of wheat to a range of waterlogging conditions. Apparent yield declines due to waterlogging ranged from nil to 38% (with a decline in total N uptake from nil to 40%). The results suggest that the consequences of waterlogging on crop production are likely to depend on factors such as the depth of waterlogging (the height of the water table), the duration of waterlogging, the aeration (redox) conditions that develop in the soil under waterlogging, the timing of the waterlogging and other factors not identified here. Further study is required to establish the importance of the various factors and how they interact in different situations.
References
Acuña TB, Dean G, Riffkin P (2011). Constraints to achieving high potential yield of wheat in a temperate, high-rainfall environment in south-eastern Australia. Crop and Pasture Science 62, 125-136.
Bakker DM, Hamilton GJ, Houlbrooke DJ, Spann C, Burgel AV (2007). Productivity of crops grown on raised beds on duplex soils prone to waterlogging in Western Australia. Australian Journal of Experimental Agriculture 47, 1368-1376.
Cox JW, McFarlane DJ (1995). The causes of waterlogging in shallow soils and their drainage in southwestern Australia. Journal of Hydrology 167, 175-194.
DEDJTR (2015). A business case for future soil R&D to increase grain production in the High Rainfall Zone of South-eastern Australia. Part B: Technical Report. Melbourne.
Elzenga JTM, Van Veen H (2010). Waterlogging and plant nutrient uptake. In 'Waterlogging Signalling and Tolerance in Plants.' pp. 23-35. (Springer-Verlag Berlin Heidelberg).
Gardner WK, Flood RG (1993). Less waterlogging damage with long season wheats. Cereal Research Communications 21, 337-343.
MacEwan R, Gardner W, Ellington A, Hopkins D, Bakker A (1992). Tile and mole drainage for control of waterlogging in duplex soils of south-eastern Australia. Australian Journal of Experimental Agriculture 32, 865-878.
MacEwan RJ, Crawford DM, Newton PJ, Clune TS (2010). High clay contents, dense soils, and spatial variability are the principal subsoil constraints to cropping the higher rainfall land in south-eastern Australia. Soil Research 48, 150-166.
McDonald GK, Gardner WK (1987). Effect of waterlogging on the grain yield response of wheat to sowing date in south-western Victoria. Australian Journal of Experimental Agriculture 27, 661-670.
Riffkin P, Evans P (2003). Successful high rainfall cropping in southern Australia using raised beds. In ''Solutions for a better environment'. Proceedings of the 11th Australian Agronomy Conference, 2-6 February 2003.' (Eds M Unkovich and G O’Leary): Geelong, Victoria).
Setter TL (2000). Farming systems for waterlogging prone sand-plain soils of the south coast. Department of Agriculture, Western Australia.
Acknowledgements
The research undertaken as part of this project is made possible by the significant contributions of growers through both trial cooperation and the support of the GRDC — the authors would like to thank them for their continued support.
This work was supported by the GRDC and the Victorian Government through the Department of Jobs, Precincts and Regions.
We also acknowledge the collaboration and support of J and S Zwar at Glenthompson and C and J Drum at Tatyoon.
Contact details
Fiona Robertson
Agriculture Victoria
105 Mt Napier Rd, Hamilton, Vic 3300
(03) 5573 0761
fiona.robertson@ecodev.vic.gov.au
GRDC Project Code: DAV00151,
Was this page helpful?
YOUR FEEDBACK