Geometric uniformity improves yield of canola and lupin
Author: Martin Harries, Mark Seymour, Stephanie Boyce DAFWA | Date: 25 Feb 2019
Key Messages
- Canola yield increased up to 17% when plants were spaced evenly apart compared to the spacing observed in commercial paddocks.
- Lupin yield improved up to 7% when plants were spaced evenly apart, but this was not statistically significant.
- Moving towards improved plant spacing without achieving perfect spacing is likely to improve yield.
Aim
To determine if spacing lupin (Lupinus angustifolius L) and canola (Brassica napus) plants in more uniform geometric patterns can improve yield of these species in the Northern Agricultural Region of Western Australia.
Background
Plant density and spatial heterogeneity are important determinants of the degree of intracrop competition and seed yield within agricultural ecosystems. Studies conducted throughout the South West of Western Australia have reported asymptotic relationships between plant densities of 10 to 80 p/m2 and seed yield for both lupin and canola (French et al 1994, French et al 2016). Studies of the effect of spatial heterogeneity on yield within these species are much less common than studies of plant density and are limited to a few trials conducted in Canada (Angadi et al. 2003; Yang et al. 2014) and one trial of canola within WA (Harries et al 2018). From Canadian studies, yield improvements in canola of up to 32% were reported from uniform plant geometry compared to uneven plant geometry. Harries 2018 reported a 6% increase in canola yield from even plant spacing at 20 p/m2 at Wongan Hills. In both studies the greatest yield increase from even geometric distribution of plants occurred at populations of 40 p/m2 or less, which corresponds to the recommended plant density of canola and lupin in WA; ranging from 20 to 40 p/m2 metre depending on rainfall.
These results present two means by which farmers may be able to increase profitability. Firstly, at the plant densities commonly utilised in Western Australia yield may be greater if plants are more uniformly spaced. Secondly, seed costs for canola production have increased for growers who have switched from open pollinated to hybrid varieties by around $30/kg. Using more precise seed placement methods and minimising intraspecific plant competition may enable seed rates to be lowered without compromising yield.
Method
Two trials were sown alongside each other at the Western Australian Department of Primary Industries and Regional Development Research Annex at Geraldton, into a deep loamy sand (Orthic Tenosol). One trial included lupin and one canola, both were the same design. Plots were 20m long by 2.0m wide and were split in half (split plot); 10m of evenly spaced plants and 10m of unevenly spaced plants. Plots were sown at seed rates four times greater than required to achieve the intended plant density. Soon after establishment seedlings were hand thinned to achieve the desired plant densities and geometry. Plant densities were 80, 40, 20, 10 and 5 plants/m². Plant geometry was spaced unevenly and evenly such that plants in the even plots plants were in a diamond configuration, row spacing fixed at 22cm (Figure 4). Plants in uneven plots were arranged with the same degree of spatial irregularity as measured from a commercial field survey (Harries et al 2018). Measurements included Normalised Difference Vegetation Index (NDVI) at regular intervals, plant height, area ground cover, grain yield components, grain yield and grain quality.
Results
Seasonal conditions
The site received 272mm of rain within the growing period (Table 1). Plants established in early June after 34mm of rain between May 24 and 28. There was adequate moisture to ensure good establishment and regular rain was received throughout the growing period.
Table 1. 2018 monthly rainfall (mm) from BOM Geraldton Airport, station 8315 (Growing Season and Year To Date)
Site | Jan | Feb | Mar | Apr | May | Jun | Jul | Aug | Sep | Oct | Nov | Dec | GS | YTD |
|---|---|---|---|---|---|---|---|---|---|---|---|---|---|---|
Geraldton | 17 | 5 | 1 | 4 | 39 | 63 | 105 | 61 | 5 | 6 | 0 | 0 | 272 | 305 |
Field trials - Canola
Plant growth
Green leaf area, measured as NDVI, from July 10 to July 31 was proportional to plant density with significant differences, P <0.001 between each density treatment. For further NDVI measurements to August 6 all densities were significantly different, P <0.001 except for the 40 and 80 p/m2 treatments. At the last date of measurement, August 13, plants were flowering which explains the lower NDVI results and reduced effect of plant density. Until July 24 there was no effect of plant configuration on NDVI results. At all subsequent measurement dates evenly spaced plots had higher NDVI, P <0.05 or greater, indicating more leaf area.
Plant height was proportional to plant density as would be expected due to increasing intraspecific competition; by August 6, plants at 80 p/m2 were ~20 cm taller than plants at 5 p/m2 (Table 2). At low plant density plants in the uneven configuration tended to be taller than those in the even conformation, but this was not significant (Table 2). This is likely to have occurred because in the uneven configuration some plants were placed in close proximity despite the low overall density. Stem diameter was greater in lower density treatments in evenly spaced plots (Table 2).
Table 2. Measurements of canola growth: NDVI (green area), plant height (cm) and stem diameter (mm).
NDVI | Plant height | Stem dia. | ||||||||
|---|---|---|---|---|---|---|---|---|---|---|
Plant distribution | Plant density (p/m2) | 10-Jul | 17-Jul | 24-Jul | 31-Jul | 6-Aug | 13-Aug | 31-Jul | 6-Aug | 29-Sep |
Even | 5 | 0.030 | 0.138 | 0.275 | 0.367 | 0.385 | 0.308 | 36.7 | 52.3 | 14.1 |
Uneven | 5 | 0.035 | 0.128 | 0.238 | 0.401 | 0.333 | 0.288 | 40.1 | 59.9 | 13.2 |
Even | 10 | 0.078 | 0.250 | 0.413 | 0.513 | 0.460 | 0.428 | 51.3 | 68.4 | 11.4 |
Uneven | 10 | 0.090 | 0.243 | 0.403 | 0.528 | 0.438 | 0.355 | 52.8 | 71.2 | 9.9 |
Even | 20 | 0.155 | 0.355 | 0.518 | 0.560 | 0.493 | 0.428 | 56.0 | 75.3 | 10.0 |
Uneven | 20 | 0.113 | 0.313 | 0.443 | 0.486 | 0.483 | 0.375 | 48.6 | 68.8 | 8.9 |
Even | 40 | 0.250 | 0.473 | 0.575 | 0.650 | 0.518 | 0.420 | 65.0 | 78.8 | 6.8 |
Uneven | 40 | 0.263 | 0.468 | 0.570 | 0.663 | 0.505 | 0.403 | 66.3 | 80.4 | 6.4 |
Even | 80 | 0.325 | 0.513 | 0.595 | 0.603 | 0.515 | 0.410 | 60.3 | 77.1 | 5.8 |
Uneven | 80 | 0.340 | 0.503 | 0.583 | 0.584 | 0.495 | 0.373 | 58.4 | 78.2 | 4.4 |
F prob density | <0.001 | <0.001 | <0.001 | <0.001 | <0.001 | <0.001 | <0.001 | <0.001 | <0.001 | |
Lsd density | 0.025 | 0.035 | 0.034 | 0.017 | 0.033 | 0.036 | 8.2 | 6.9 | 1.8 | |
F prob distribution | NS | NS | <0.05 | <0.05 | <0.05 | 0.001 | NS | NS | 0.066 | |
Lsd distribution | 0.022 | 0.027 | 0.021 | 0.023 | ||||||
F prob interaction | NS | NS | NS | NS | NS | NS | NS | NS | NS | |
Yield, yield components and seed quality
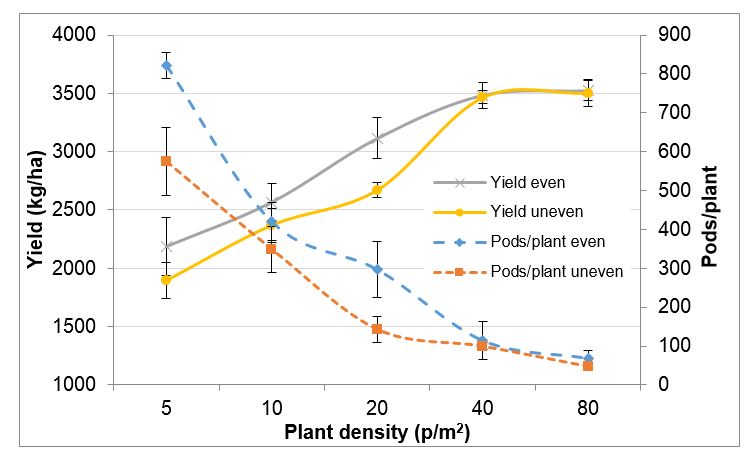
Site mean yield of canola was 2878kg/ha. There was a strong effect of plant density which followed the previously reported asymptotic trend, yield increasing steeply to 40 p/m2 and then plateauing. There was an effect of plant configuration (P <0.05). At lower plant densities of 5, 10 and 20 p/m2 canola yield increased by 15% (294 kg), 8% (200 kg) and 17% (444 kg) respectively from even plant spacing (Figure 1). Single plant dry weight, yield and pods per plant were greater at lower plant density and in evenly spaced plants. There were more seeds per pod from plants at lower density but no significant difference between even and uneven spacing. Seed weight and oil content were not affected by plant density or spatial arrangement (Table 3).
Economics
At the plant densities with the greatest yield difference between even and uneven configuration, (15-20 p/m2) an extra 10 p/m2 were required in the uneven configuration to produce the equivalent yield to even plant spacing. Using estimates of 200,000 seed/kg, 95% germination and 70% field establishment, 1.5 kg of seed is required to achieve 20 p/m2 while 2.3 kg/ha is required to achieve 30 p/m2. An extra 0.8 kg of seed per hectare was required in uneven spacing which equates to $24/ha assuming hybrid seed costs of $30/kilo and $2.4/ha assuming OP retained seed costs of $3.0/kg. As expected achieving the same yield from fewer plants per square metre is a greater economic benefit when using more expensive seed. The decision to use a hybrid or OP seed can be based on several factors; is Round-Up Ready required for weed control, do you expect better field establishment from a hybrid and are hybrids likely to yield more at your yield target (Zhang et al 2016).
Table 3. Single plant dry weight (g), seed yield (g), pods/plant, 1000 seed weight (g) and seed oil content (%).
Plant distribution | Plant density (p/m2) | Dry Wt. | Seed yield | Pods/ plant | seed/pod | 1000 seed weight/plant | Oil % |
|---|---|---|---|---|---|---|---|
Even | 5 | 133.4 | 46.7 | 822 | 21.1 | 3.303 | 41.9 |
Uneven | 5 | 106.6 | 38.5 | 575 | 25.9 | 3.345 | 41.6 |
Even | 10 | 77.5 | 27.5 | 420 | 24.9 | 3.103 | 42.3 |
Uneven | 10 | 64.7 | 23.0 | 349 | 25.7 | 3.210 | 41.8 |
Even | 20 | 50.1 | 18.3 | 297 | 24.2 | 3.093 | 42.5 |
Uneven | 20 | 29.1 | 10.6 | 143 | 26.1 | 3.118 | 42.0 |
Even | 40 | 20.4 | 8.0 | 115 | 23.9 | 3.410 | 42.2 |
Uneven | 40 | 19.5 | 7.5 | 99 | 27.6 | 3.320 | 42.7 |
Even | 80 | 10.8 | 3.7 | 69 | 20.5 | 3.288 | 42.5 |
Uneven | 80 | 7.5 | 2.8 | 47 | 23.8 | 3.433 | 42.4 |
F prob density | <0.05 | 0.05 | <0.05 | <0.05 | NS | NS | |
Lsd density | 11.2 | 4.4 | 61.8 | 1.9 | |||
F prob distribution | <0.001 | <0.001 | <0.001 | NS | NS | NS | |
Lsd distribution | 17.8 | 7.0 | 97.7 | ||||
F prob interaction | NS | NS | NS | NS | NS | NS | |
Figure 1. Effect of plant density and spacing on yield (kg/ha) and pods/plant of canola.
Lupin
Plant growth
Green leaf area, measured as NDVI, from July 10 to July 31 was proportional to plant density, P <0.05 or greater, between each density treatment. For the remainder of the NDVI measurements to August 13 all densities were significantly different, P <0.05 or greater, except for 40 and 80 p/m2. There were no significant difference in NDVI measured between the even and uneven plant arrangements (Table 4).
Plant height was proportional to plant density as would be expected due to increasing intraspecific competition. At the first measurement date, on July 31, all densities except the 10 and 20 p/m2 were significantly different (P <0.001) with plants at 80 plants/m2 17 cm taller than those at 5 plants/m2. This difference had reduced by October 23 however plant height at 5 and 10 plants/m2 was significantly lower (P <0.05) than 20 plants/m2 which was significantly lower than 40 and 80 plants/m2. At the time of greatest contrast in plant height between treatments plants in the uneven configuration were taller (P <0.05) than those in the even configuration. This is likely to have occurred because in the uneven configuration some plants were placed in close proximity despite the low overall plant density.
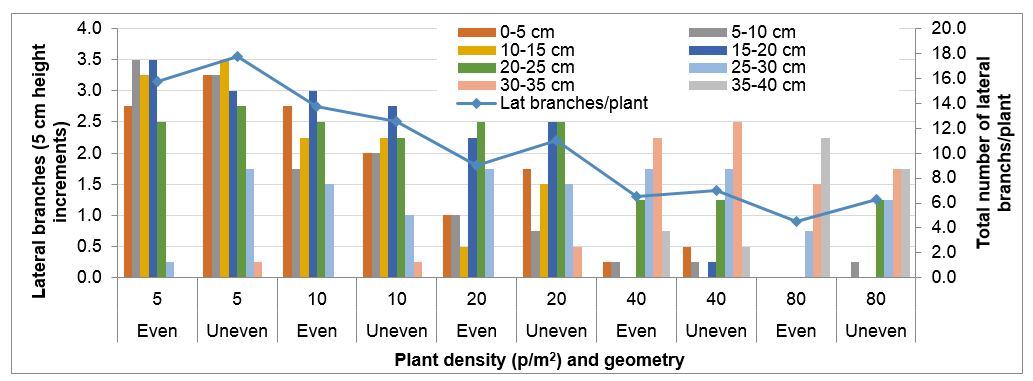
Lateral branches per plant and the height at which these formed on the main stem varied depending on plant density. The total number of lateral branches per plant was inversely proportional to plant density, with a range of 17 to 5 branches from 5 and 80 plants/m2. Up to main stem height of 25cm there were significantly more lateral branches on low density plants compared to high density plants (P <0.001). Between 25-30cm on the main stem there was no significant difference in the number of branches been plant density treatments. Plants in the higher density plots had more branches from 30cm or higher (P <0.001). There were no significant differences in the number of branches or their height on the main stem between even and uneven plant configuration (Figure 2). Main stem diameter was greater in lower density treatments and in evenly spaced plots (Table 4).
Table 4. Measurements of lupin growth: NDVI, plant height (cm) and main stem diameter (mm).
NDVI | Plant height | Stem dia. | |||||||||
|---|---|---|---|---|---|---|---|---|---|---|---|
Plant distribution | Plant density/m2 | 10-Jul | 17-Jul | 24-Jul | 31-Jul | 6-Aug | 13-Aug | 31-Jul | 6-Aug | 23-Oct | 28-Sep |
Even | 5 | 0.013 | 0.060 | 0.110 | 0.145 | 0.233 | 0.338 | 32 | 35 | 74 | 17 |
Uneven | 5 | 0.038 | 0.095 | 0.160 | 0.250 | 0.323 | 0.400 | 36 | 39 | 75 | 14 |
Even | 10 | 0.045 | 0.125 | 0.215 | 0.313 | 0.403 | 0.553 | 36 | 38 | 78 | 14 |
Uneven | 10 | 0.040 | 0.143 | 0.208 | 0.290 | 0.400 | 0.523 | 37 | 40 | 79 | 12 |
Even | 20 | 0.100 | 0.268 | 0.440 | 0.528 | 0.613 | 0.648 | 40 | 44 | 83 | 11 |
Uneven | 20 | 0.088 | 0.235 | 0.373 | 0.463 | 0.533 | 0.630 | 40 | 42 | 79 | 10 |
Even | 40 | 0.213 | 0.438 | 0.580 | 0.623 | 0.663 | 0.693 | 46 | 52 | 83 | 9 |
Uneven | 40 | 0.225 | 0.455 | 0.573 | 0.603 | 0.650 | 0.683 | 48 | 53 | 83 | 7 |
Even | 80 | 0.353 | 0.573 | 0.610 | 0.640 | 0.665 | 0.683 | 49 | 53 | 86 | 7 |
Uneven | 80 | 0.378 | 0.598 | 0.643 | 0.648 | 0.680 | 0.700 | 54 | 58 | 80 | 6 |
F prob density | <0.001 | <0.001 | <0.001 | <0.001 | <0.001 | <0.001 | <0.001 | <0.001 | <0.05 | <0.001 | |
Lsd density | 0.026 | 0.033 | 0.033 | 0.036 | 0.032 | 0.039 | 3.7 | 3.6 | 4.5 | 1.1 | |
F prob distribution | NS | NS | NS | NS | NS | NS | <0.05 | NS | NS | <0.001 | |
Lsd distribution | 2.3 | 0.7 | |||||||||
Figure 2. Effect of plant density and spacing on the number of lateral branches and the height on the main stem from which these branches grew.
Yield, yield components and seed quality
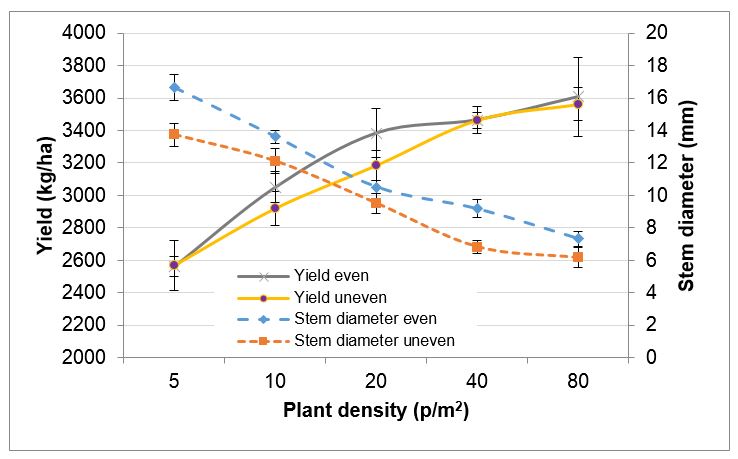
Site mean yield of lupin was 3175kg/ha. There was a strong effect of plant density which followed the previously reported asymptotic trend, yield increasing steeply to 40 p/m2, then plateauing. At the optimum spatial arrangement of 20 p/m2 yield was higher in the even plant confirmation compared to uneven by 219 kg/ha or 7% but this was not statistically significant (Figure 3).
Yield component analysis indicated single plant weight, stem diameter and seed yield were greater from lower density and even spaced treatments (Figure 3) (Table 5). Plant density affected the branching level at which seed was produced. At higher plant density a greater proportion of seed was produced on main stems, conversely at low plant density a greater proportion of seed was produced on secondary and tertiary laterals (Table 5). It is interesting to note that the even 5 p/m2 treatment carried the greatest proportion of yield on lateral branches, 92.6%. This may be due to the very low level of intraspecific competition and may explain the lack of response to even plant configuration at this density.
Plant density or configuration did not affect seed weight on the main stem or primary lateral branches although seed from each branching level was progressively lighter. Seed on secondary and tertiary laterals was heavier at lower plant density. Seed on tertiary laterals was heavier from even spacing (P = 0.065), data not presented.
These results are consistent with 100 seed weights taken from harvested samples; higher density treatments producing a greater proportion of seed on main stem and having greater seed weight (Table 5).
Economics
At the plant densities with the greatest yield difference between even and uneven configuration, (15-25 p/m2) an extra 10 p/m2 were required in the uneven configuration to produce the equivalent yield to even plant spacing. This is equivalent to around 25kg/ha more seed or $7.50/ha assuming seed costs of $300/tonne. Hence the economic benefit is smaller than for hybrid canola.
Table 5. Single plant dry weight (g), seed yield (g), % seed produced from MS (mains stem) PL (primary lateral), SL (secondary lateral), TL (tertiary lateral) and 100 seed weight (g).
Plant distribution | Plant density (p/m2) | Tot plant weight | Seed yield | % seed MS | % seed PL | % seed SL | % seed TL | 100 seed wt. |
|---|---|---|---|---|---|---|---|---|
Even | 5 | 181 | 82.4 | 7.4 | 35.5 | 37.6 | 19.5 | 14.6 |
Uneven | 5 | 121 | 55.4 | 13.6 | 36.0 | 37.7 | 12.7 | 14.6 |
Even | 10 | 117 | 54.4 | 12.6 | 31.8 | 35.7 | 20.0 | 15.0 |
Uneven | 10 | 90 | 40.3 | 14.6 | 31.0 | 37.0 | 17.4 | 15.2 |
Even | 20 | 57 | 25.9 | 23.5 | 32.6 | 34.1 | 9.8 | 15.0 |
Uneven | 20 | 46 | 20.9 | 25.6 | 35.6 | 31.8 | 7.1 | 14.9 |
Even | 40 | 32 | 14.1 | 25.9 | 39.9 | 30.9 | 3.3 | 15.4 |
Uneven | 40 | 26 | 11.7 | 23.8 | 36.3 | 37.1 | 2.8 | 15.3 |
Even | 80 | 19 | 8.5 | 27.4 | 36.8 | 35.9 | 0.0 | 15.8 |
Uneven | 80 | 13 | 4.4 | 42.3 | 48.9 | 8.9 | 0.0 | 16.0 |
F prob density | <0.001 | <0.001 | <0.001 | <0.05 | <0.05 | <0.001 | <0.001 | |
Lsd density | 28.8 | 13.76 | 8.5 | 7.5 | 8.1 | 3.9 | 0.39 | |
F prob distribution | <0.05 | <0.05 | NS | NS | NS | <0.05 | NS | |
Lsd distribution | 18.2 | 8.7 | 2.5 | |||||
Figure 3. Effect of plant density and spacing on yield (kg/ha) and stem diameter of lupin.
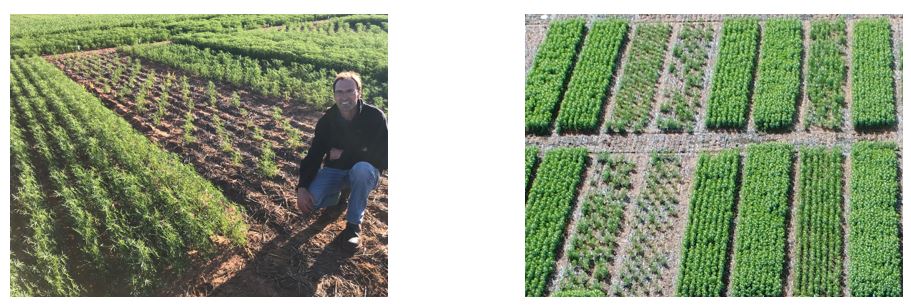
Figure 4. Lupin plantshanded thinned to even spacing (left) and lupin plots from above (right) at Geraldton
Conclusions
For both species the greatest yield difference between the even and uneven treatment occurred at 20 p/m2, where plants in the even configuration were equidistant from each other; 17% for canola and 7 % for lupin.
Plant growth measured as height, green area, main stem diameter and branching habit were all influenced by plant density and in some cases evenness of plant spacing.
The difference in species responses to plant configuration at very low plant density (5 p/m2) may be associated with differences in plant structure. The lack of response in lupin may have been a function of the higher proportion of yield being set from later branching levels and lower plasticity of yield architecture than canola.
Farmers can improve yield of canola and lupin if plants are established at more uniform spacing than is currently being achieved. Additionally there may be benefits associated with even plant spacing such as improved weed competition and fertiliser use efficiency which were not addressed in these trials.
Yield improvements can be substantial, so moving towards improved plant spacing without achieving perfect spacing is likely to improve yield.
References
Harries M, French B, Seymour M (2018). Plant geometry and density for management of canola crops in the Northern Agricultural Region of Western Australia. In proceedings of the Australian Research Assembly of Brassica conference Perth WA.
French RJ , McCarthy K Smart WL (1994). Optimum plant population densities for lupin (Lupinus angustifolius L.) in the wheatbelt of Western Australia. Australian Journal of Experimental Agriculture 34, 491-497.
French, R, Seymour, M & Malik, R (2016). 'Plant density response and optimum crop densities for canola (Brassica napus L.) in Western Australia', Crop and Pasture Science, vol. 67, no. 4, pp. 397-408.
Yang C & Gan Y & Harker N.K & Kutcher R & Gulden R & Irvine B & May W.E (2014) Up to 32% yield increase with optimized spatial patterns of canola plant establishment in western Canada. Agron. Sustain. Dev. (2014) 34:793–801
Zhang Heping, Berger Jens D., Seymour Mark, Brill Rohan, Herrmann Chris, Quinlan Richard, Knell Garren (2016) Relative yield and profit of Australian hybrid compared with open-pollinated canola is largely determined by growing-season rainfall. Crop and Pasture Science 67, 323-331.
Acknowledgments
Thanks to Belinda White and the Geraldton DPIRD Research Support Unit for trial management and measurements and the GRDC for project funding.
GRDC Project Number: DAW00227 Paper reviewed by: Andrew Blake
GRDC Project Code: DAW00227,
Was this page helpful?
YOUR FEEDBACK


