High rainfall zone agronomy to help close the yield gap
Author: Jon Midwood (Southern Farming Systems) | Date: 26 Feb 2019
Take home messages
- It is estimated that wheat yields in the high rainfall zone (HRZ) of the Southern Region are generally only producing 41% to 47% of water-limited yield potential (Yield Gap Australia).
- There is a need to bridge the gap between actual and potential grain yields in the HRZ.
- The biggest single driver of yield gap is nitrogen fertiliser rate.
- Under-fertilising appears to be a major cause of yield gaps in cropping systems in the high rainfall zone (HRZ). (McCaskill).
- Efforts to reduce the yield gap need to take into account seasonal risk and relative crop and fertiliser prices (McCaskill).
- The size of the yield gap varies according to the region and environmental constraints, but generally appears greater in high rainfall zones.
- Key agronomy decisions can be made during the season that have significant impact in reducing the yield gap.
What is the yield gap?
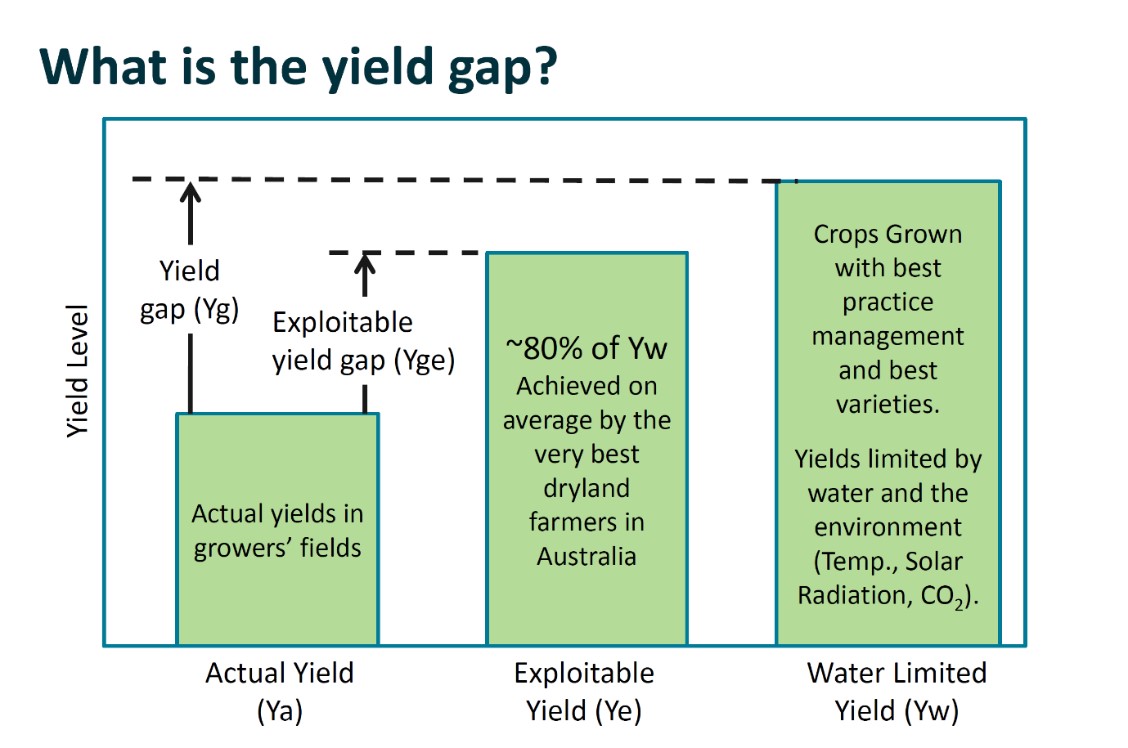
The yield gap is difference in yield between actual and potential grain yield. Yield potential is defined as the yield of an adapted crop variety when grown under favourable conditions without growth limitations from water, nutrients, pests or diseases. For any given site and growing season, yield potential is determined by three factors:
- Solar radiation
- Temperature
- Water availability
The term yield potential is used for irrigated systems because it is assumed that an irrigated crop can be provided with adequate water supply throughout growth. In contrast, maximum possible yields under rain-fed conditions are referred to as ’water-limited yield potential’ because most rain-fed crops suffer at least short term water deficits at some point during the growing season.

Figure 1. Diagrammatic representation of the ‘yield gap’ concept (Source: Lobell et al. 2009).
Yield gap analysis
Various projects have been carried out over the past few years to look further at key insights into the yield gap, ground truthing data from models such as the Agricultural Production Systems sIMulator (APSIM) and validating the yield gap in various agroecological zones.
A. The integration of technical data and profit drivers for more informed decisions – a GRDC investment
National analysis of yield gap has identified that the top 20% producers commonly achieve 10% greater yield ($/hectare or water use efficiency (WUE)).
This gross margin optimisation (management) is primarily driven by:
- yield;
- agronomy;
- timeliness;
- variable cost control;
- crop rotation;
- price received; and
- management of frost.
(Source: Rural Directions).
B. Differences between farms with smaller versus larger yield gaps
Farms with smaller yield gaps tend to:
- Achieve higher yields (1t/ha more in past five years).
- Have smaller holdings.
- Have more favourable soil types.
- Dedicate less area to wheat as a proportion of cropping rotations.
- Apply considerably more N fertiliser to wheat crops.
- Cultivate a greater variety of crops in 2016.
- Soil test a greater proportion of their fields (24% vs. 15%).
- Use a fee-for-service agronomist (71% vs. 52%).
(Zhang et al. 2019).
C. The key drivers of WUE in wheat in Western Victoria run by Agriculture Victoria
The following studies were conducted, aiming to understand the relative importance of different genetic, environmental and management factors based on Water Use Efficiency (WUE) of wheat (2013-2106).
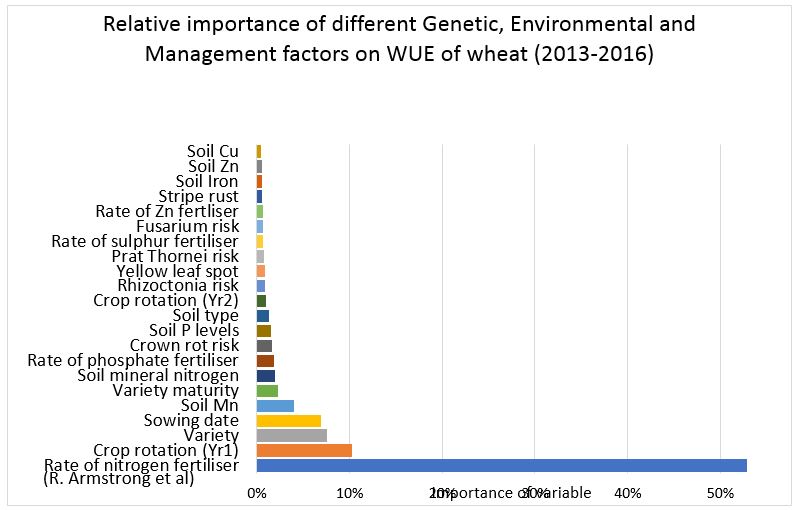
WUE studies included a survey of one hundred and thirty-six (136) paddocks, mainly across the Wimmera but also including the Mallee and the HRZ to determine the relative importance of different genetic, environmental and management factors effects on WUE of wheat (Figure 2)

Figure 2. Relative importance of different genetic, environmental and management factors on WUE of wheat (2016-2018) (Source: Armstrong et al. 2019).
Top ten most influential variables:
- Rate of nitrogen fertiliser Management
- Crop rotation (Yr1) Management
- Variety Genetic
- Sowing date Management
- Soil Mn Environment
- Variety maturity Genetic
- Soil mineral nitrogen Environment
- Rate of phosphate fertiliser Management
- Crown rot risk Environment
Soil P levels Environment
When considering the factors identified as major contributors to the yield gap, grower management represented the two most influential variables. The field survey indicated that nitrogen fertiliser rate contributed more to the yield gap than any other single variable, including crop rotation, sowing date and variety on the actual yield. However, there is a need to get a range of these factors right due to their cumulative contribution.
(Roger Armstrong et al. 2019).
To understand which management factors can be leveraged to close the gap between actual and potential yield, it is necessary to understand how the yield potential for a cereal crop is set up and what the implications are for management and agronomy to influence these levers.
Cereal yield – depends on:
- Available resources – light, temperature and water. Generally, these cannot be controlled (irrigation aside), as such, yield is managed through influencing their capture.
- Light capture is predominantly dependent on green canopy longevity.
- Water capture depends a range of factors including rooting depth.
- The ability of plants to capture the above resources.
- Conversion of resources into grain.
Yield potential
- Current status in south west (SW) Victoria - It is estimated that wheat yields in the HRZ of the Southern Region are generally only producing 41% to 47% of water-limited yield potential (Yield Gap Australia).
- What is possible? - In 2013 and 2016, yields in excess of 10t/ha have been achieved in Southern Farming Systems (SFS) dryland trials from the Western District.
- Current status in Tasmania – The average yield of red grain wheat is 5t/ha. While this has increased relatively more than the other states in the past 20 years (Australian Bureau of Agricultural Resources and Economics (ABARES), it is still well below the potential.
- What is possible? - In 2016, the GRDC Hyper Yielding Cereals (HYC) project produced irrigated wheat yields in excess of 15t/ha and barley in excess of 10t/ha. In 2017, the project produced yields of wheat of 13t/ha and barley just under 11t/ha.
Wheat growing season
Development – governed by temperature, day length and water.
- Influence of agronomy options:
- Variety influence HIGH
- Sowing date HIGH
- Temperature and day length LOW
Growth – managed using agronomic input throughout the season.
- Influence of agronomy options:
- Variety influence MEDIUM
- Nutrition HIGH
- Disease control HIGH
- Plant growth regulators (PGRs) HIGH
Implications for management
Varieties vary in their response to day length and temperature, two of the most significant influences on crop phenology or their relative speed of development. This influences when varieties will reach key growth stages such as GS31 (first node) or GS65 (mid flowering). These can be manipulated to some degree by changes in time of sowing.
Important management factors for increasing yield potential:
- Prolong crop development phase by sowing slow-developing varieties early.
- Management after sowing influences growth, not development.
- For the highest yields, feed and protect leaves that emerge during stem extension in preference to earlier, lower leaves.
- For diseases such as septoria tritici in wheat or scald in barley, fungicide treatments should be timed to protect final leaf 3 (flag -2). Spraying early will be ineffective, as the leaf will still be in the leaf sheath.
Emergence and establishment
- Influence of agronomy options:
- Variety influence LOW
- Seed quality, germination and vigour HIGH
- Soil moisture MEDIUM
- Weather LOW
- Sowing depth HIGH
- High sowing rate ( decreases % establishment) HIGH
- Seed treatment HIGH
- Pests and disease MEDIUM
Target plant populations
- The most appropriate target plant population depends on the tillering ability of varieties, weed pressure and sowing date – the target should be based around the head numbers/m2 that is aimed for at harvest.
- Sowing rate: Delayed sowing, which may be necessary for weed control or due to soil conditions, reduces the tillering period.
- Poor establishment or low plant populations only reduce yield if
- Significant areas of the paddock have very few or no plants.
- Conditions are unsuitable for compensatory tillering and root growth.
- Weed pressure is high.
- High sowing rates combined with very high rates of establishment can increase the risk of lodging.
Facts
- 15-16t/ha plots were produced from head numbers of 450-550 heads/m2 (HYC 2016).
- Yields of 10t/ha from rain fed crops in SFS trials were produced from head numbers of 500 heads/m2.
Leaf emergence and tillering
- Influence of agronomy options:
- Variety influence LOW
- Sowing date HIGH
- Sowing rate/plant numbers HIGH
- Rate of leaf emergence is controlled mainly by temperature LOW
- Many tillers die between GS31 and flowering MEDIUM
- High N supplies encourage tiller survival MEDIUM
Implications for management
Leaf emergence, together with disease risk, determines key spray timings, especially in susceptible varieties:
- Target initial fungicides at the third from last leaf, which normally coincides with GS32 (depending on sowing date and variety).
Tillering is the most important process governing canopy formation:
- Manage the crop to achieve at least 400 ears/m2 for maximum potential yield.
Root growth
Good rooting, especially deep rooting, will enhance crop growth when water or N is limiting. However, root growth can also be reduced when soils are waterlogged or compacted.
- Influence of agronomy options:
- Variety influence LOW
- Sowing date HIGH Early sowing increases potential root size
- Soil structure and drainage HIGH
- Root disease MEDIUM
Implications for management
The main ways root systems can be managed is indirectly, through improved soil structure, minimising waterlogging and drainage (raised beds, subsurface drains).
Encouraging deep rooting will improve water and nutrient supplies for crop growth.
- Sow early to increase overall root system size by flowering.
- Soil structure has a major impact on root growth and distribution.
- With minimal tillage, enhanced earthworm activity creates long continuous pores in the subsoil to aid root penetration.
- Consider the use of raised beds, controlled traffic or field drainage in the management of the soil to ensure adequate pore spaces for aeration and root penetration into the subsoil.
Nitrogen uptake
Nitrogen supply is influenced by:
- Previous cropping.
- Soil type.
- Previous fertiliser applications.
- Crop residues.
- Soil organic matter.
- Cultivations.
Nitrogen uptake can occur throughout the life of the crop, although most is taken up around September. Soils in Southern Region HRZ cropping rotations are likely to supply sufficient N for wheat, after a break crop, to produce roughly 2t–3t/ha. The other part of the final yield can be supplied with applied N.
- Influence of agronomy options:
- Variety influence LOW
- N uptake on plant growth HIGH
- Before GS30 promotes tillering.
- During stem extension promotes shoot survival and some increase in leaf size.
- After stem extension, it prolongs the survival of the key yield producing leaves.
Implications for management
Where soil N residues are unknown, a deep N test is better than estimating what the soil can contribute as nitrate and ammonium N. Late winter N is important for some crops as it will encourage tillering after poor establishment or to overcome root restrictions or where there is soil compaction.
Nitrogen applied after tillering is needed by most crops as it encourages rapid canopy expansion, mainly through better tiller survival.
If aiming for a milling grade wheat, growers need to ensure enough N is applied for the target yield, and allow sufficient additional N to avoid protein dilution
Fact
- SFS trial work has shown that if previous N applications have been suboptimal and there is still sufficient subsoil moisture, a yield improvement from N applied around GS39 can still be achieved.
Contact details
Jon Midwood
Southern Farming Systems
jmidwood@sfs.org.au
Was this page helpful?
YOUR FEEDBACK
