Improving the Effectiveness of Soil Amelioration by Optimising Soil Machine Interaction
Author: Mustafa Ucgul, Chris Saunders, Jack Desbiolles, Stephen Davies, Wayne Parker | Date: 24 Feb 2019
Key messages
- Increasing ploughing speed from 5-15km/h significantly decreases the depth of topsoil burial
- Increasing ploughing depth beyond 200mm removed more topsoil from the surface but does not have a significant effect on the depth of topsoil burial
- The correct use of skimmers on mouldboard ploughs can increase the amount of topsoil burial below 100mm depth
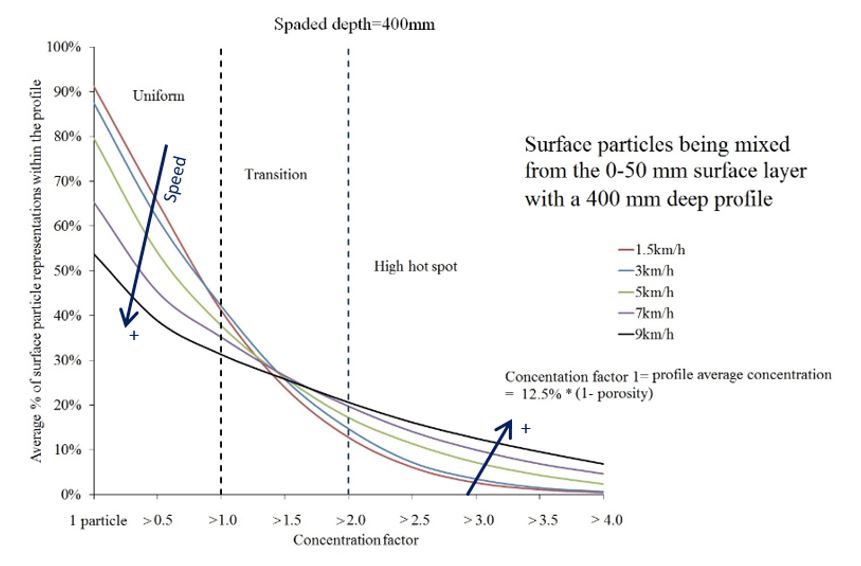
- Faster forward speeds lead to less uniform mixing with ‘hot-spots’ of concentration within a spaded profile.
- Field research is required to identify which soil amendment incorporations (e.g. lime, clay, organic matter, fertiliser, etc.) can benefit from uniform spading in terms of crop response, and when less uniform (= lower cost) spading is adequate for sandy soils.
- Increasing ripping depth, whilst keeping the inclusion plate depth constant, does not increase the inclusion of topsoil but increases the draft force
- More effective topsoil incorporation is achieved at slower ripping speeds
- There is potential for improved inclusion plate design to reduce draft and improve top soil inclusion.
Aims
Compaction, water repellence, subsoil acidity and organic matter deficiency are critical soil constraints that limit crop productivity by (a) reducing crop establishment, (b) restricting root development into the subsoil and (c) limiting the capacity of crops to uptake water and nutrients (DPIRD, 2018). In order to deal with these constraints different soil tillage implements are used, mouldboard or disc ploughs for burying water repellent topsoil, rotary spaders for soil layer and/or surface amendment mixing and inclusion plate attachment for topsoil slotting during deep ripping. The performance of these tillage implements is generally evaluated using field experiments. However, only a small number of implement settings and operating conditions are generally tested due to the resource intensive and costly procedures involved, leaving gaps in knowledge of the best configurations to use.
Current computer technology with discrete element method (DEM) simulation software allows for comparison and optimisation of different tillage implements and their configurations without limiting the amount of operating and soil conditions that can be investigated (Ucgul et al. 2017). Modelling of the soil-tool interaction is a highly complex process due to the variability of the soil structure and its behaviour. In DEM modelling, the soil bulk is simulated from distinct small particles, whose interactions are modelled and specifically calibrated to generate the same bulk behaviour as the soil of interest (Sadek et al. 2017).
The aim of this paper is to review the knowledge derived from DEM simulation results of four different tillage implements used in soil amelioration. The tools used in the study were a mouldboard plough and disc plough for burying water repellent top soil, a rotary spader for mixing surface applied amendments and a deep ripper with inclusion plates for soil loosening and topsoil slotting. The DEM simulations in this study were undertaken using EDEMTM software.
Method
Due to computational limitations, the particle sizes used in the DEM simulations are larger than actual soil particle sizes. Therefore, the DEM parameters used in the simulations need to be calibrated to generate similar soil bulk behaviour to that encountered in the field. The calibration process was based on matching simulation results of an ‘Angle of Repose’ test to measured results using soil samples taken from the field (Fig 1). The calibration procedure was repeated for the each soil type and condition (moisture) used in the simulations.
Fig 1. Angle of repose test for calibration (a) Laboratory test, (b) DEM simulations.
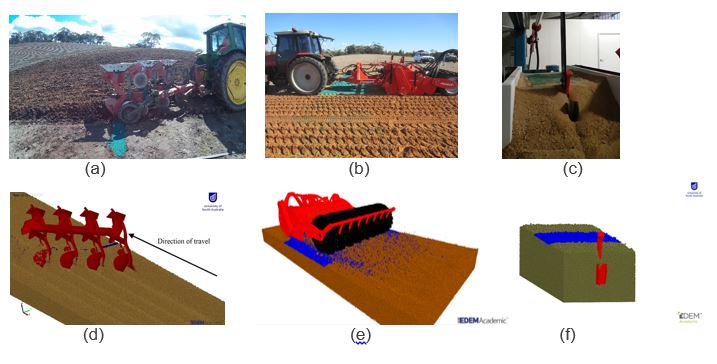
The movement of the topsoil by ploughing, mixing and topsoil inclusion was measured by tracking the soil movement during the tillage operation. To achieve this, a shallow recess was dug across the path of the tool and filled with blue coloured sand (Figs. 2a, 2b, 2c). After the tillage operation, face pits were excavated across the direction of travel and a digital photo of each vertical slice was taken (Scanlan and Davies, 2019), and digitally analysed to evaluate the extent of blue sand pixels within the images. The same process was simulated via DEM (Fig 2d, e, f) under similar bulk soil conditions. Comparing field experiments and DEM simulations, the coordinates of blue pixels and particles were able to be compared. Mouldboard plough and rotary spader experiments were performed in the field while inclusion plate tests were performed in the laboratory using a 1/5 scale 3D printed model operating at a pro-rata depth (120mm, Fig. 2f). Once validated, these DEM soil-tool models were able to be used under a variety of soil conditions and machine settings, and generate specific knowledge, now reported in this article.
Fig 2. Top: Example physical experiments, (a) mouldboard ploughing, (b) rotary spading and (c) 1/5 scale ripper with inclusion plates, Bottom: DEM simulations of the respective full size implements, (d) ploughing (e) spading and (f) ripping with inclusion plate.
Results
Modelling of soil-mouldboard and one-way disc plough interactions
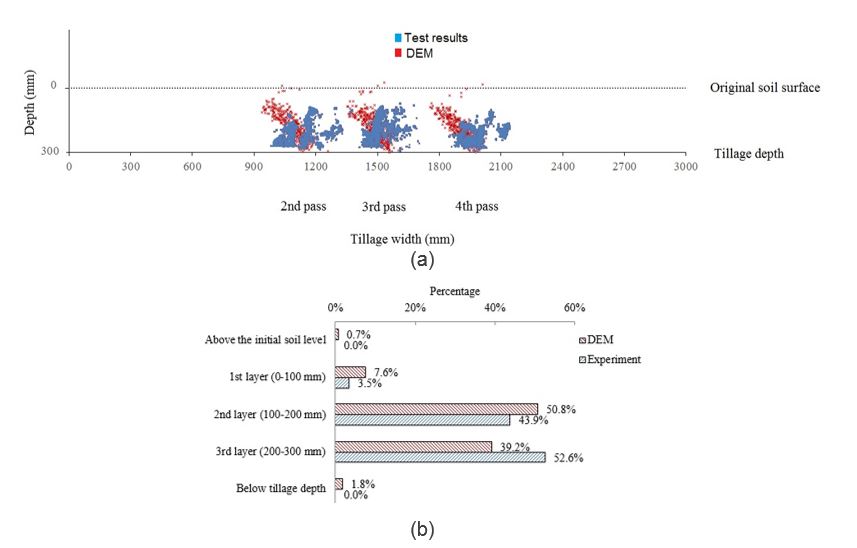
The combined cross-sectional locations of the buried blue sand measured (blue) in the field and (red) DEM simulations are shown in Fig 3a. Both the field experiment and DEM both showed each plough body gave a distinct cross sectional grouping of buried topsoil (Fig. 3a). To quantify the proportion of particles buried at different depths, the tillage depth was divided into three horizontal layers (100 mm each) and the percentage of particles (DEM) and pixels (field test) in each layer were calculated for the DEM and field test, respectively. A comparison of topsoil burial proportions by depth layer, (Fig. 3b), demonstrates good agreement with DEM predictions. Both the field results and the DEM simulations showed the mouldboard plough to be effective at burying the top 40mm of soil at depths between 100 to 300mm.
Fig 3. (a) Measured and simulated topsoil burial example results, (b) quantified data: percentage of 40mm topsoil by depth layer
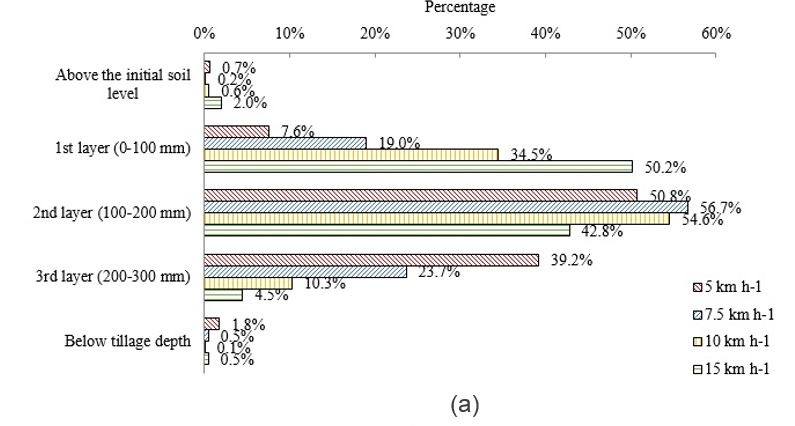
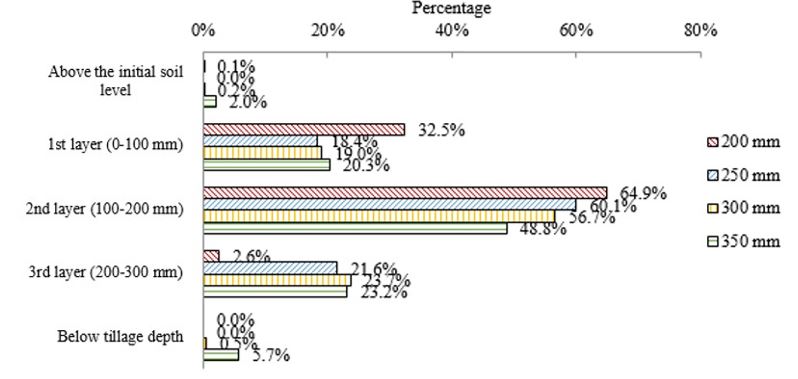
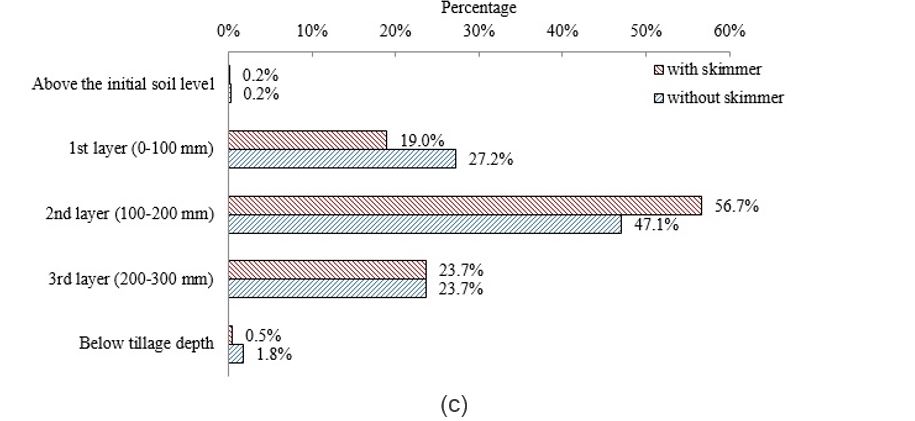
DEM predictions clearly show that, as the mouldboard plough speed increases, the depth of top soil burial reduces. Hence, to improve the extent of topsoil burial at deeper depth, a slower speed is desirable (Figs 4a). As speed increases, the soil is essentially displaced further away from the plough body and higher up the slope of inverted soil slices. Ploughing at a depth of only 200mm is too shallow to effectively bury the topsoil compared with ploughing at depths within the range of 250-350mm (Fig 4b). Simulations show that as the depth increases the topsoil is moved further away from the plough and entrained further forward. The role of the skimmer is to assist with surface material burial, and its impact was assessed in DEM simulations with and without skimmers. Results show the skimmer indeed helps move topsoil particles into the 100 to 200mm depth layer within the ploughed profile, but does not influence deeper burial into the 200-300mm depth layer (Fig 4c).
Fig 4. Proportions top soil layer buried in each 50 mm thick depth layer as impacted by (a) speed, (b) depth and (c) the use of skimmers
With a calibrated field soil, DEM modelling of soil-disc plough interaction was also carried out. As the disc freely rotates from the interactions with soil, its modelling requires a more complex modelling approach. Initial simulation results confirm the industry knowledge that using a mouldboard plough provides better topsoil burying than a disc plough (Fig 5). The mouldboard plough operating at 5 km/h achieved 40% topsoil burial into (5th and 6th layers or 200-300mm depth) compared to the disc plough achieving 22%) In comparison when working at 10 km/h the mouldboard plough buried more of the surface layer but only buried similar amounts (9-12%) into the deeper layers (200-300mm).
Fig 5. Comparison of percentage proportions top soil layer buried in each 50 mm thick depth layer for disc and mouldboard ploughs operating at 300mm depth and contrasting (a) slow (5km/h) and (b) fast (10km/h) forward speeds
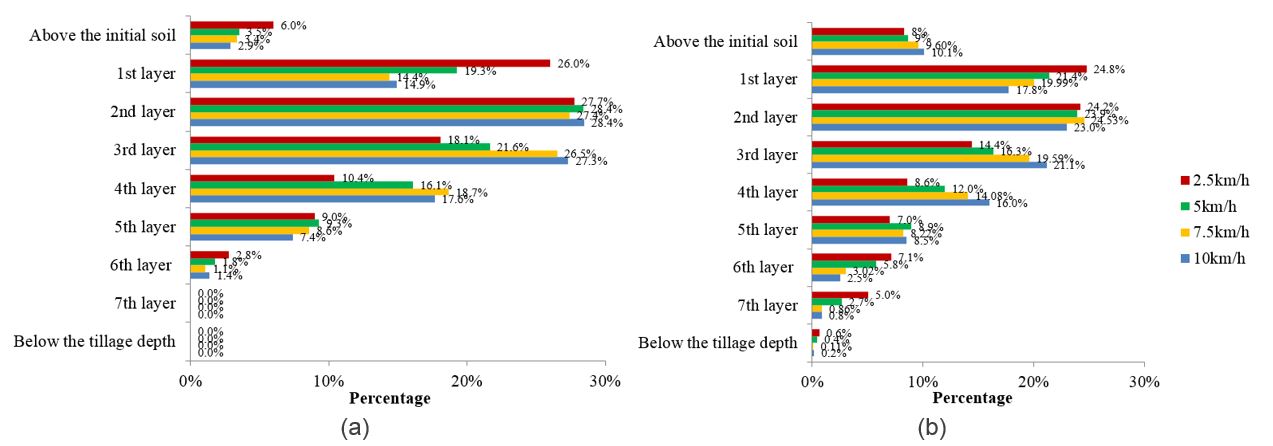
It was also found from the disc plough simulation results that faster forward speed increases the topsoil burial up to about 200mm. After this depth increasing the speed decreases the amount of topsoil buried into deeper tillage depths (Fig 6). Further work is currently being undertaken to analyse the effects of scallop, disc curvature, disc size, and approach angle.
Fig 6. Comparison of percentage of topsoil burial in each depth 50 mm layer for disc plough for 2.5, 5, 7.5 and 10km/h forward speeds at (a) 250mm and (b) 350 mm tillage depths
Simulation of soil-rotary spader interaction
Both field tests and DEM simulations showed that spader blades gave a distinct groupings of buried top layer particles (Fig 7). This effect occurs because of the cyclical operation dictated by the ‘bite length’ setting (bite length = distance at the soil surface separating two consecutive blade points of entry), which varies with forward speed, blade rotational speed and number of blades fitted along one row perimeter.
Fig 7. Soil profiles after spading: (a) field test, (b) DEM simulation
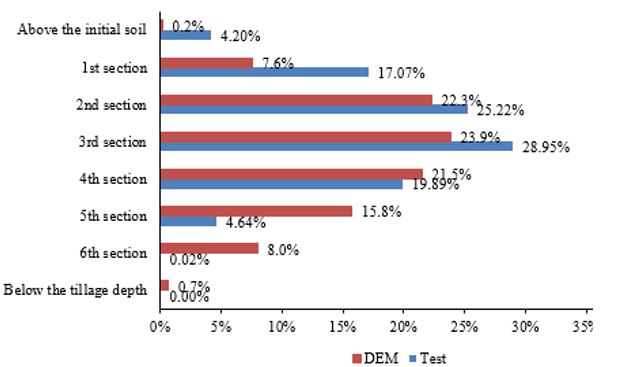
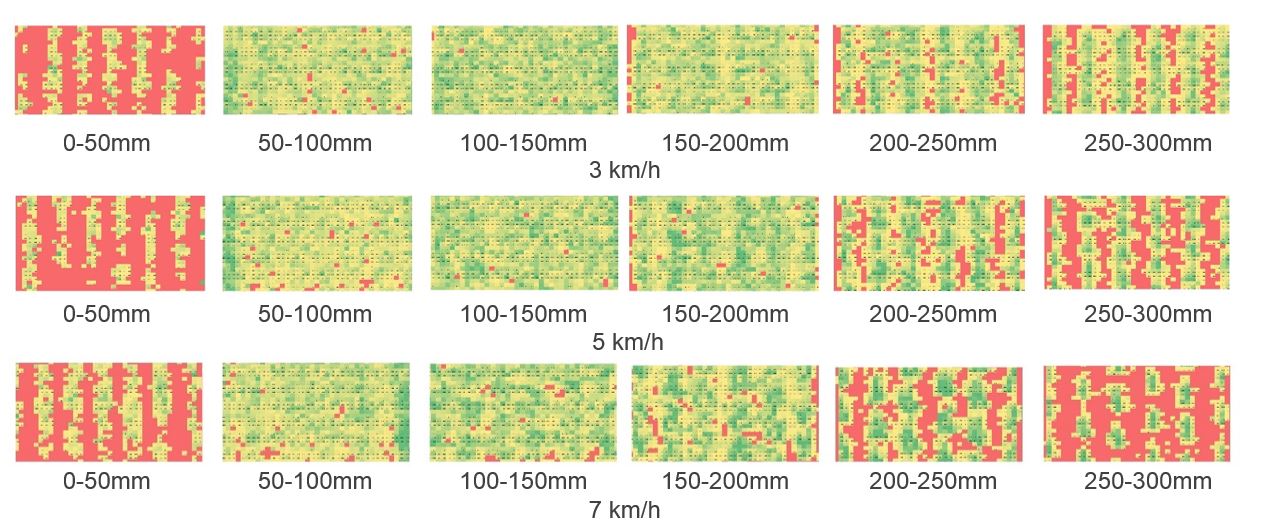
A comparison of the proportion of topsoil burial by layer obtained in the field and in simulations is shown in Fig 8. Results show that the proportion trends were very similar showing a peak presence in the 100-150 mm (3rd) layer, and with a tendency to under-predict in the 0-50mm surface layer and over-predict below 200 mm depth. Overall, the matching of trend suggest that DEM simulations can be used to predict the performance of a rotary spader. A 3 dimensional assessment of the mixing quality was also possible with the DEM technique by dividing the soil bin volume into 50x50x50mm cells from which the proportion by volume of top layer particles in each cell was computed to develop colour coded spatial distribution maps of top layer particle concentrations. Six 50mm thick layer maps can thus be produced to quantify a 300 mm deep spaded profile. A number of forward speeds were simulated, including 3, 5 and 7 km/h, and the visual results are displayed in the form of pixelated maps (1 pixel = 50 x 50 mm) shown in Figs 9. These single layer maps clearly show that more uniform topsoil mixing can be achieved at a slower forward speed, also minimising hot spot concentrations near the full working depth. The uniformity of topsoil incorporation by the spader when operating at 300 mm depth significantly reduces below 200 mm depth, suggesting a given spader blade design and positioning may have an optimal operating depth range to maximise uniformity of mixing. Increased speed (causing greater bite length) results in more heterogeneous topsoil mixing deeper in the profile (creating hot spots of concentration), while the mixing uniformity was typically found to be best in the middle third of the profile (100-200mm layer). All settings showed a small proportion of material remaining in the surface layer (smallest at the lowest speed), which is also observed in practice from spaded surfaces.
Fig 8. Percentage of top soil in each 50mm thick layer comparing field experimental data with DEM simulation using full size spader (set at 300m operation depth and 5km/h forward speed)
Fig. 9. Spading at 300mm depth: Visual concentration patterns of topsoil particles in 50mm thick layers at 3 forward speeds (Note: the spader travelled from bottom to top of each top-view pixel map, direction Green to yellow shades indicate high to low concentrations, with red representing zones of zero topsoil particles)
Higher uniformity of mixing in sandy soils is likely to be an advantage for incorporating products like clay and lime, which purportedly need a thorough blending to best achieve their aims. It may be that a best response can be secured by low speed and reverse direction multi-pass spading to maximise the uniformity aspects. However, it is also possible that ‘distributed hot spots’ - rather than uniform blending at depth of surface manures and organic matter amendments could be beneficial for crops. Therefore further field research is required to identify which soil amendment incorporations can benefit from more uniform spading in terms of crop response, and when less uniform (= lower cost) spading is adequate for sandy soils.
Uniformity of mixing a surface layer amendment encompasses two aspects, namely i) uniformity of representation in each basic cell and ii) the frequency of hot-spots of various concentrations. Fig 10 highlights the relationships between these two parameters and their interaction with forward speed in the range of 1.5-9 km/h, based on simulation data at 400 mm spading depth. The modelling data show, as expected, a decay relationship between amendment distribution uniformity and hot spot of increasing concentration. As the speed increases, a rapid loss in amendment distribution uniformity can be seen, with a paralleling increase in the extent of amendment concentration within hot-spot areas. These data indicate the potential to identify optimum zones of operation for specific crop-amendment needs in constrained sandy soils.
Fig. 10. Impact of forward speed on the relationship between ‘amendment distribution uniformity’ and ‘hot spot of increasing concentration’ in a spaded soil profile
Modelling of soil-inclusion plate interaction
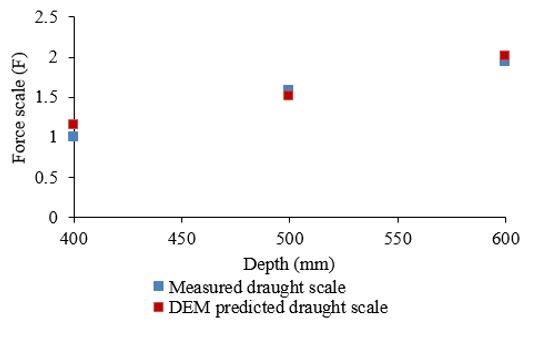
The simulation results of the effect of the ripping depth on top soil incorporation are also shown in Fig 11. In both test and simulations the inclusion plate was placed at the 150mm below the surface. To quantify the proportion of particles incorporated at different depths, the tillage depth was divided into six 100mm horizontal layers and the percentage of particles (DEM) and pixels (test image) in each layer were calculated. The draft force results were also predicted and compared to the test results (Fig 12). Results showed that topsoil burial depth decreases, while draft force increases (by 94%) with the increase of the tillage depth from 400mm to 600mm.
Fig 11. Comparison of percentage of topsoil incorporation in each 100mm depth layer at 2.8km/h speed for the ripping depths of (a) 400mm and (b) 600mm *
Fig 12. Test vs DEM draft force results for various tillage depths at 2.8km/h speed and 150mm inclusion plate depth *
DEM simulations of different inclusion plate depths (0,150 and 250mm) on topsoil inclusion and draft forces are shown in Fig 13. The effects of different forward speeds (1.4, 2.8 and 4 km/h) are also shown in Figs 14. Results showed that placing the inclusion plate deeper did not increased the topsoil inclusion to depth but had a significant draft penalty (of 34%).
Fig 13. (a) Comparison of the percentage of topsoil incorporation, in each 100mm depth layer for different inclusion plate depths at 600mm ripping depth and 2.8km/h forward speed *
Results also showed that reducing the forward speed from 4km/h to 1.4km/h gave better topsoil inclusion. In addition, reducing the forward speed to abovementioned rates can reduce the draft force by 43% (Fig. 14).
Fig 14.(a) Comparison of the percentage of topsoil incorporation, in each 100mm depth layer for different tool forward speeds at 600mm ripping depth and 150mm inclusion plate depth *
* Ripper and inclusion plate results based on soil bin testing and DEM simulations carried out at 1/5 scale and displayed at full scale equivalent
Conclusion
Computer simulation methods such as Discrete Element Method (DEM) can be used to understand the operation of many tillage implements that are currently being used to overcome soil constraints in Australian farming practices. Future work will focus on investigating more implements under different operating conditions, in different soil types and evaluating some crop yield responses from the various implement settings. This work has highlighted the potential for improved machine set-up and operating parameters over what is currently practiced by farmers to improve soil amelioration practices. Additionally it has highlighted the potential for improved inclusion plate design to reduce draft and improve top soil inclusion.
Acknowledgments
This research was generated from three projects DAW00244, CSP00203 and DAW00243 funded by Australia’s Grains Research and Development Corporation (GRDC). Machinery supply, field and workshop support from Groocock Soil Improvements Pty Ltd, Farmax MetaalTechniek b.v., Moodie Agronomy and Mr Dean Thiele are gratefully acknowledged.
GRDC Project Number: DAW00244, CSP00203, DAW00243
References
Sadek, M. A., Tekeste, M. & Naderi, M. (2017). Calibration of soil compaction behaviour using discrete element method (DEM). In: 2017 ASABE Annual International Meeting. Spokane, WA, USA
Scanlan, C.A., Davies, S.L. (2019) Soil mixing and redistribution by strategic deep tillage in a sandy soil. Soil and Tillage Research 185, 139-145.
The Department of Primary Industries and Regional Development (Agriculture and Food) (DPIRD) (2018), Improving crop productivity by overcoming soil constraints. Retrieved from: Improving crop productivity by overcoming soil constraints
Ucgul, M., Saunders, C., & Fielke, J. M. (2017). Discrete element modelling of tillage forces and soil movement of a one-third scale mouldboard plough. Biosystems Engineering, 155, 44-54.
Was this page helpful?
YOUR FEEDBACK


