Relative importance of various factors on the water use efficiency of wheat
Author: Roger Armstrong, Roger Perris, Mel Munn, Pete Hekmeijer, Katherine Dunsford (Agriculture Victoria), Kerry Bell (Department of Agriculture & Fisheries (Queensland)) and Franz Waldner3 and Zvi Hochman (CSIRO) | Date: 26 Feb 2019
Take home messages
- The water use efficiency (WUE) of wheat in most paddocks in western Victoria was well below physiological potential from 2013-2016, however some leading growers were close to this potential.
- Crop management is critical to reducing the gap between actual and potential yields.
- Nitrogen (N) management is the most important predictor of WUE, followed by crop rotation, variety and sowing date, while weeds and diseases appear to be reasonably well managed.
- Significant variation in other factors affecting WUE remains unexplained.
Background
The large gap between actual and physiological (water-limited) yield potential in the Victorian grains industry has long been recognised, for example, Hamblin & Kyneur (1992). A recent assessment (van Rees et al. 2014) suggests that some growers have effectively bridged this yield gap. Many growers, however, have not bridged the yield gap with wheat achieving an average of only 53% of the ‘exploitable yield gap’ (Hochman et al. 2012). Anecdotal observations of differences in grain yields and quality in adjacent paddocks, where rainfall is presumed to be comparable, have been attributed to a range of factors including different soils (environment), disease, poor nutrition, late sowing, weed competition (management), better varieties (genetics) or simply ‘good luck’. On-going increases in the productivity of the Victorian grains industry will be difficult to achieve until the specific underlying causes and their relative effect on this unrealised potential are determined so that appropriate financially viable management solutions can be implemented by growers.
Information collected through technologies, such as yield mapping and remote sensing, has highlighted that variability of grain yield (and the yield gap) extends to within paddocks as well as between farms, regions and across seasons. Studies involving pre-determined multi-factorial designed ‘white peg’ experiments have been used to assess the size and cause of yield gaps (Anderson et al. 2010). An alternative approach involves observational studies where the conditions of interest are not controlled. While this latter approach has limitations, especially in the form of requiring a large number of observations to make reliable predictions, they also provide some distinct advantages over multi-factorial designs. These include being more logistically efficient in that they use commercial scale rather than small-scale experimental machinery, better reflecting commercial practices, using inherent spatial variability as an asset and allowing a wide range of soil types, environments and grower management practices to be assessed.
This paper reports on a study which monitored 138 paddocks sown to wheat from 2013 to 2016. Most paddocks (> 80%) were in the Wimmera, but paddocks from the Victorian High Rainfall Zone (HRZ) (Western Districts) and Victorian Mallee were also included. The effects of a range of factors including different crop varieties (Genetics), soil physicochemical properties, disease risk, weed infestation and rainfall and temperature (Environment), and grower management including sowing date, fertiliser applications (Management) on key crop parameters including dry matter production, grain yield and protein were measured. This large data set was then analysed using a range of ‘traditional’ statistical procedures, as well as recently developed multivariate and machine learning procedures to identify the relative importance of G x E x M factors on the WUE of wheat in growers’ paddocks.
Method
A data set comprising 408 datum points from 138 paddocks was compiled from 2013 to 2016, inclusive. Paddocks were selected based on grower interest in the study, which may have introduced a bias in the data. Previous studies, for example, Nuttall et al. (2003), have showed that soils are extremely spatially variable within paddocks in western Victoria. To maximise the assessment of soil properties in the analysis, data was collected from three different datum points in each paddock. The same paddock management was assumed for all data points in each paddock. Sampling points were selected based on either obvious differences in soil type or where the soil seemed uniform. There was a minimum of 50m distance between sampling points. Rainfall and temperature in each paddock were logged using automated tipping bucket rain gauges and air temperature probes. However, due to regular problems such as missing data points, rainfall data used to assess WUE was based on that used from the SILO Patch Point System.
WUE, rather than grain yield, was used as the key response variate to account for the known, overriding effect of growing season rainfall on grain yield. In contrast to other approaches based purely on rainfall, account was made of water stored in the profile prior to sowing (e.g. following a long fallow) or unused at maturity (due to soil constraints on root growth). This was calculated as:
WUE (kg grain/mm water) = Grain Yield (kg/ha)/WU (mm water) …Eq. 1.
Where:
WU (mm water) = (Wv (mm) at sowing – Wv (mm) at Maturity) + GSR (mm) …Eq. 2 and
Wvis volumetric water calculated on a soil profile basis (0-120cm) and adjusted for estimated bulk density and GSR is growing season rainfall (April-November).
Data collection protocols were effectively the same as used for the GRDC National Paddock Survey project (which were based on those originally used in an Agriculture Victoria Research (AVR) project), except that no account was made of grower yield maps.
Statistical analysis
A variety of statistical methods was used to account inclusion of both categorical and continuous variables in this multivariate dataset when explaining variation in WUE. Procedures used included univariate statistical comparisons (analysis of variance (ANOVA)), multiple linear regression, Regression Trees (Breiman et al. 1984) and Random Forests (Breiman 2001) between a variable and WUE.
Results
Data summary
Rainfall during the four year study period ranged from Decile 1 to Decile 10 for annual and growing season rainfall.
Grain yields of wheat averaged 3.37t/ha (range: 0.01 to 8.83t/ha), WUE averaged 10.6kg/mm/ha (0.06-29.6kg/mm/ha), grain protein averaged 12.1% (7.3%-20.6%) and GSR 285mm (121-672). The frequency distribution of grain yields was skewed towards < 3t/ha, while for WUE this average was more normally distributed, but with a small number of points at the high (>24kg/mm/ha) end.
Canola was the most common crop preceding wheat in the rotation (43%), followed by the pulses faba beans, lentils, chickpeas and field peas. Few wheat crops followed either fallow or pastures (reflecting the dominance of Wimmera paddocks in the dataset). Twelve percent of the wheat crops surveyed were preceded by a wheat crop. More than 60% of the wheat paddocks survey had been planted to either wheat or barley within the previous two seasons.
The most common wheat varieties grown were Scout (19.2%) followed by Wallup (12.5%), Yitpi (10.3%), Correll (8.8%) and Derrimut (7.4%). The most common soil types were Vertosols (49%), followed by Chromosols (16%), Calcarosols (14%), Sodosols (9%) and Dermosols (9%) (data not presented).
There were wide ranges in both the rate of phosphorus (P) fertiliser applied and plant available P concentrations (Colwell P) on all the major soil types (Table 1). For example, Colwell P ranged from 2 to 98 with a mean of 32mg/kg on the Vertosols (cracking clays). Across all soil types, mean Colwell P concentrations were greater than those likely to produce a yield response to P application. Although weakly correlated, the rate of P fertiliser applied was positively related to soil Colwell P concentration (Figure 1). Much more strongly correlated was the rate of N fertiliser applied which increased exponentially with the amount of nitrate-N measured in the profile (0-120cm) prior to sowing (Figure 2). These data suggest that little account was made of these soil tests when deciding fertiliser rates.
Table 1. Relationship between soil type, rate of P fertiliser applied (kg P/ha) and soil Colwell P (mg/kg).
Rate of P (kg/ha) | Colwell P (mg/kg) | |||||||||||
|---|---|---|---|---|---|---|---|---|---|---|---|---|
Soil classification | No. | frequency | mean | Min. | Max. | mean | Min. | max | ||||
Calcarosol | 56 | 0.14 | 10.6 | 3 | 18 | 32 | 2 | 98 | ||||
Chromosol | 66 | 0.16 | 16.3 | 7 | 24 | 41 | 9 | 143 | ||||
Dermosol | 38 | 0.09 | 15.4 | 7 | 33 | 56 | 31 | 105 | ||||
Kandosol | 1 | 0.00 | 21.0 | 21 | 21 | 56 | 56 | 56 | ||||
Sodosol | 36 | 0.09 | 13.1 | 7 | 20 | 46 | 22 | 115 | ||||
Tenosol | 5 | 0.01 | 6.5 | 6 | 8 | 35 | 22 | 63 | ||||
Vertosol | 197 | 0.49 | 12.1 | 0 | 33 | 34 | 7 | 218 | ||||

Figure 1. Relationship between the rate of P fertiliser applied and Colwell soil test value.
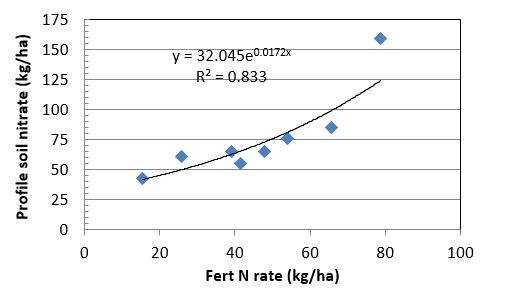
Figure 2. Relationship between the rate of N fertiliser and pre-sowing soil-nitrate (kg/ha) in the profile.

Figure 3. Relationship between water use (mm) and grain yield (t/ha) of wheat across all survey points. The WUE = 25kg/mm/ha line represents the theoretical frontier (Sadras & Lawson 2013) of 25kg grain /mm/ha, whereas the French & Schultz WUE frontier line represents French & Schultz (1984) benchmark (21kg/mm/ha).
Water use efficiency
The average WUE of wheat in the study was 11.5kg grain/mm/ha (Figure 3), well below the theoretical potential of 25kg/mm/ha recently suggested by Sadras & Lawson (2013). As expected, there was marked variation between paddocks in WUE but notably, a sizable proportion of paddocks recorded WUE above the French & Schultz (1984) frontier of 21kg grain/mm/ha.
WUE was significantly affected by soil type, with the average for Calcarosols (8.5 kg/mm/ha, n=56) significantly lower than that for Vertosols (10.5 kg/mm/ha, n=196), Chromosols (10.7 kg/mm/ha, n=66), Dermosols (11.4 kg/mm/ha, n=38) and Sodosols (12.0 kg/mm/ha, n = 36), which were not significantly different from each other (data not presented).
The WUE of wheat was significantly lower where PREDICTA®B indicated the risk of Rhizoctonia solani was medium (6.8 kg/mm/ha, n=30) or high (5.3 kg/mm/ha, n=9) than below the detectable limit (11.1kg/mm/ha, n=341).
Conditional Inference Forest Analysis (Figure 4) indicated that the rate of N fertiliser applied was the most important factor influencing WUE, followed by crop rotation (Year 1), variety, sowing date, and soil Diethylene Triamene Penta Acetic Acid manganese (DTPA Mn). The importance of N rate on WUE can be judged by the partial dependence plots. For example, WUE increased rapidly from less than 9kg /mm/ha at low rates of N before asymptoting to 12kg /mm/ha at rates of 50kg N/ha or greater (Figure 5).
The proceeding rotation had the greatest influence on WUE after N rate. Results based on ANOVA analysis (Table 2) indicated WUE (which took account of profile soil water prior to sowing and post-harvest) varied by nearly 70% depending on the previous rotation. The highest WUE values (kg/mm/ha) were recorded when wheat followed either vetch (13.9), fallow (12.3) or a pulse (12.1), which were significantly greater (P<0.05) compared to wheat following a cereal (10.4). The lowest WUE values occurred when wheat was preceded by either canola (8.9) or pasture (8.2).
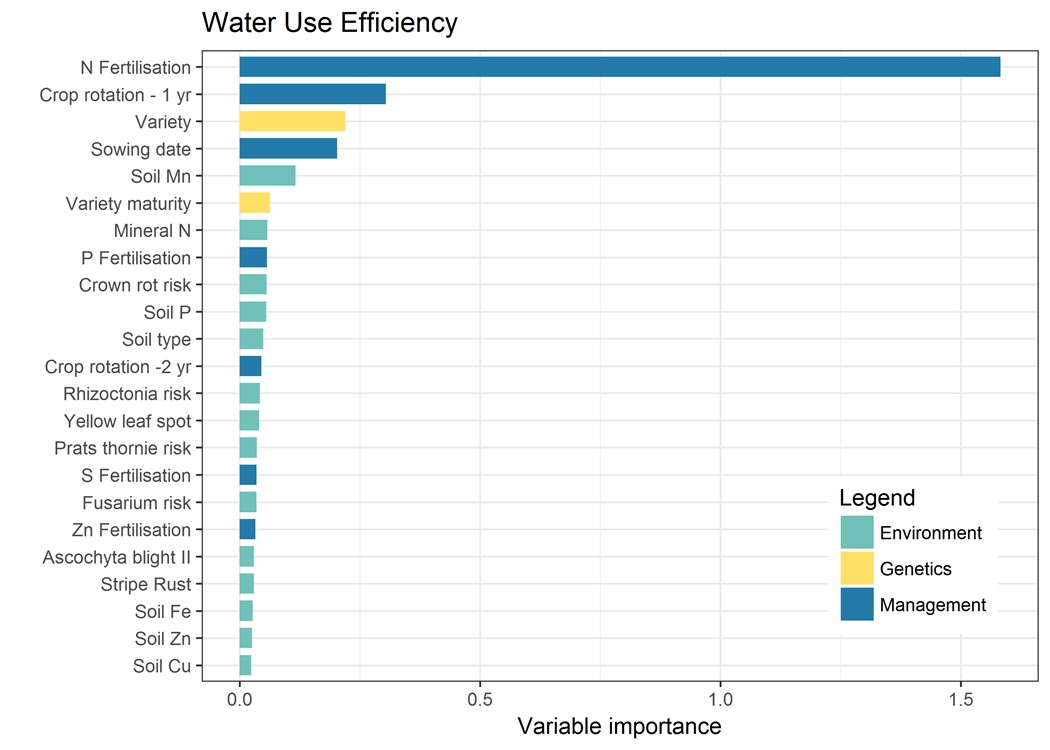
Figure 4. Relative importance of different environmental, genetic and management factors on the WUE of wheat in growers’ paddocks (2013-2016) based on Conditional Forest Analysis.

Figure 5. Partial dependence of WUE on rate of N applied (kg/ha) in growers’ paddocks (2013-2016).
Table 2. Effect of previous crop in rotation on WUE (kg grain/mm/ha) of wheat. Means followed by the same letter are not significantly different (P= 0.05).
| Previous crop | Mean WUE (kg/mm/ha) | n |
|---|---|---|
| Vetch | 13.9a | 24 |
| Fallow | 12.3abc | 7 |
| Pulse | 12.1ab | 134 |
| Cereal (incl. oats) | 10.4bc | 33 |
| Canola | 8.9c | 162 |
| Pasture | 8.2c | 9 |
Discussion
This study aimed to generate an evidence-based ‘hierarchy’ of factors (biophysical, genetic and management) that influence WUE of wheat in growers’ paddocks. In contrast to other studies with similar aims, in which factorial designed ‘white peg’ experimentation was used, for example, Anderson et al. (2010), the results in this study were based on current grower management practice where both logistical and cost pressures strongly influence decisions.
There has been considerable debate in the scientific literature about the relative importance of ‘G’ versus ‘E’ versus ‘M’ on long term gains in grains productivity. This study clearly showed that factors under grower control (‘Management’) were pivotal in determining WUE of wheat. The rate of N fertiliser applied was the most influential factor affecting WUE of wheat, followed by ‘rotation’ with ‘sowing date’ the fourth most influential factor. The rate of N applied to a wheat crop ranged from as little as 4kg N/ha (as monoammonium phosphate (MAP) applied at sowing) to 140kg/ha (split as multiple in-season applications). Increasing the N rate from 20 to 50kg/ha resulted in WUE increasing from 9.5 to 12.0kg/mm/ha (Figure 5), an increase of more than 25%. A range of factors influence grower N management decisions including assessments of yield potentials, which are strongly related to seasonal conditions, and individual attitudes to financial risk. It was hypothesised that soil mineral N supply prior to sowing would be negatively related to the amount of N subsequently applied. Surprisingly, a strong positive relationship was found between the two. Profile soil nitrate ranged from 14 to 361kg/ha, a value that would be more than adequate to produce the highest yields recorded (9t/ha) with a grain protein concentration of 12% and assuming an uptake efficiency of approx. 50% and little or no in-crop N mineralisation. The fact that N rates were not negatively correlated with soil N at sowing could reflect low rates of soil testing by growers in western Victoria, especially for ‘deep N’, and/or a lack of confidence by growers and advisers in soil test results.
Previous crop rotation was the second most influential predictor of WUE. Nearly half of the wheat crops were preceded by canola (44%) with ‘cereal’ (wheat, barley or oats) comprising most of the crops used in the two years prior to the wheat crop studied. Very few wheat crops were preceded by either a fallow or pasture, confirming the long-term trend since the 1990s towards continuous cropping, not just in the Wimmera but also the Victorian Mallee and to a lesser extent the HRZ.
Fallowing and pastures traditionally provided an important role in controlling both disease, weeds and, indirectly, increasingly short-term supply of mineral N to wheat. Despite the high frequency of cereals in the two years preceding the wheat, both weed infestation and disease risk were generally low or non-detectable (using PREDICTA® B testing), respectively. There were, however, some paddocks where there was significant in-crop weed infestation, and which was found by regression analysis to significantly (P<0.05) affect WUE (data not presented). It is difficult to determine to what extent weed populations in these paddocks were influenced by the effectiveness of in-crop weed control or may have reflected significant build-up of weed seed banks in previous rotations — this may in part explain the strong effect of the previous rotation, and to a lesser extent the rotation prior to that, on WUE. Similarly, whereas our measurements focused on potential disease risk as indicated by PREDICTA® B assays, the final impact of disease on WUE would have been also strongly influenced by variety selection (selection of ‘tolerant’ varieties), as well as seed and in-crop fungicide treatment for foliar diseases.
Despite the dominance of canola in rotations immediately preceding wheat, these crops also had the equally lowest WUE (with grass pasture) of 8.9kg/mm/ha. In contrast including vetch, fallow or a pulse in the prior rotation produced a WUE of more than 12kg/mm/ha, or more than a third greater. It would be expected that the three most efficient rotation options in terms of WUE (i.e. pulses) would produce benefits in both N supply e.g. Armstrong et al. (2019), as well as disease and weed breaks. This finding may also indicate a strong strategic and tactical reliance on the use of N fertilisers by growers to supply N requirements for wheat rather than through N2 fixation associated with growth of a pulse or vetch. However, given that continuous cropping systems are strongly linked to both declining soil N and organic carbon (C) levels in similar environments (Armstrong et al. 2019), the dependence of WUE on rate of N fertiliser application may become even greater in coming years.
Interestingly, fallow produced the equal highest WUE, although this finding was based only on data from seven points. This finding would not reflect the greater quantity of soil water storage as this was accounted for in the soil water measurement used to calculate WUE. As well as soil water, fallowing also produces benefits to following crops in the form of both increased soil mineral N supply and weed/disease control (O’Leary and Connor 1997). There has been a reassessment of the value of fallowing in recent years from both a productivity and financial perspective (Hunt 2016), especially in light of the high potential of water stored deep in the profile to contribute to grain yield (Kirkegaard et al. 2007). Results from this study would support this reappraisal.
The current study focuses on WUE where account was made of soil water contained in the profile prior to sowing and that remaining at harvest i.e. it is an indicator of the physiological ability of the crop itself to utilise soil water. This WUE approach, popularised by French & Schultz (1984), is widely used by growers and advisers as a benchmark for grain production as water is undoubtedly the key determinant of grain yield. In semi-arid cropping systems, however, a key factor determining productivity is the efficiency in which all rainfall, including that occurring during the preceding fallow, is stored in the soil. As such, it is expected that management factors such as tillage/stubble retention (O’Leary and Connor 1997), which can strongly interact with soil type, as well as fallow weed control (Hunt et al. 2013) which were not measured in this study, would also strongly influence eventual grain yields rather than just WUE.
This study combined a range of ‘traditional’ statistical approaches such as ANOVA, single/multiple regression, as well as non-parametric approaches such as Random Forests. It is important to recognise that all these approaches have both strengths and weaknesses and that a strength of this study was that a multi-faceted approach was used. It is also important to recognise that statistical analysis is there to assist interpretation of the data rather than being ‘unquestionable’. For example, we are still at a loss to explain the relatively high ranking of soil Mn in the Conditional Forest Analysis. It is important, therefore, that appropriate technical expertise is used to interpret the results and that follow up experimentation may be justified in some cases to help elucidate some findings.
While most of the paddocks monitored were in the Wimmera region of north western Victoria (390 to 430mm annual rainfall), paddocks from the Mallee (325 to 360mm) and the Western Districts of the High Rainfall Zone (> 650mm) were also assessed. The study period (2013 to 2016) covered a large range of annual rainfall and growing season conditions ranging from Decile 1 to greater than Decile 9, allowing for a robust assessment of potential interactions between different environmental and management factors and seasonal conditions. Subsequent re-analysis, where data from both the low and HRZs were removed, produced little change in the key factors influencing WUE, suggesting that these results are potentially applicable across wide sections of western Victoria. Surprisingly, the most challenging part of this project was obtaining reliable grower records. Whereas this in part reflects how busy growers are, in others it was obvious that accurate records were not kept, which limited not only our ability to utilise the full (biophysical) data set available, but raises questions about how some growers can benchmark their performance and use records to improve future decisions.
Conclusions
The WUE of wheat in most paddocks in western Victoria appears to be well below physiological potential.This and other studies suggest that some growers are achieving the physiological potential. Hence, there is significant scope for many growers to reduce the gap between actual and potential yields through their crop management decisions. The key determinant of water use efficiency appears to be N management. Several other factors including crop rotation, variety and sowing date are also critical. Although most wheat crops were preceded by canola, despite highest water use efficiencies occurring after legumes phase. Significant variation in explaining WUE remains unaccounted for, and it is important that these ‘unknowns’, such as possibly frost and heat stress, are identified. This study has provided evidence-based research to underpin future extension and research priorities to improve the productivity of the grains industry in western Victoria. Knowing what factors are important, however, does not mean that ‘solutions’ are readily available.
References
Anderson WK (2010). Closing the gap between actual and potential yield of rainfed wheat. The impacts of environment, management and cultivar. Field Crops Research 116, 14-22.
Armstrong RD, Perris R, Munn M, Dunsford K, Robertson F, Hollaway GJ, O’Leary GJ (2019). Effect of long-term rotation and tillage practice on grain yield and protein of wheat and soil fertility on a Vertosol soil in a medium rainfall temperate environment. Crop & Pasture Science In Press.
Breiman L, Friedman, JH, Olsen, RA, Stone CJ (1984). Classification and Regression Trees. (Wadsworth, Monterey).
French RJ and J. E. Schultz (1984).Water use efficiency of wheat in a Mediterranean-type environment. II. Some limitations to efficiency. Australian Journal of Agricultural Research 35, 765-775.
Hamblin A and Kyneur G (1993). Trends in wheat yields and soil fertility in Australia. (Australian Government Publishing Service, Canberra, Australia).
Hochman Z, Gobbett D, Holzworth D, McClelland T, van Rees H, Marinoni O, Navarro Garcia J, Horan H. (2012). Quantifying yield gaps in rainfed cropping systems: A case study of wheat in Australia. Field Crops Research 136, 85-96.
Hunt JR, Browne C, McBeath TM, Verburg K, Craig S, Whitbread AM (2013). Summer fallow weed control and residue management impacts on winter crop yield through soil water and N accumulation in a winter-dominant, low rainfall region of southern Australia. Crop and Pasture Science 64, 922-934.
Hunt J (2016). Developing long fallow farming systems that maximise plant water use and farm profit in the southern region. (Project ULA00010: Report to The Grains Research and Development Corporation, Canberra).
Kirkegaard, JA, Lilley, JM, Howe, GN, Graham, JM (2007b). Impact of subsoil water use on wheat yield. Australian Journal of Agricultural Research 58, 303-315.
Nuttall, JG, Armstrong, RD, Connor DJ, V. J. Matassa(2003). 'Interrelationships between soil factors potentially limiting cereal growth on alkaline soils in NW Victoria' Australian Journal of Soil Research 41, 277-292.
O’Leary GJ, Connor DJ (1997). Stubble retention and tillage in a semi-arid environment: 1. Soil water accumulation. Field Crops Research 52, 209–219.
Sadras VO and Lawson C (2013). Nitrogen and water-use efficiency of Australian wheat varieties released between 1958 and 2007. European Journal of Agronomy 46, 34-41.
van Rees H, McClelland T, Hochman Z, Carberry P, Hunt J, Huth N, Holzworth D (2014). Leading farmers in South East Australia have closed the exploitable wheat yield gap: Prospects for further improvement. Field Crops Research 164, 1-11.
Acknowledgements
The research undertaken as part of this project is made possible by the significant contributions of the Victorian Government and growers through both cooperation and the support of the GRDC — the authors would like to thank them for their continued support. We would also like to acknowledge the support of Grant Hollaway and Josh Fanning for pathology analysis, and Russel Argall, Liana Warren and Mick Brady for technical support.
Contact details
Roger Armstrong
Agriculture Victoria, Grains Innovation Park, PB 260 Horsham VIC 3400
03 434 43336
roger.armstrong@ecodev.vic.gov.au
GRDC Project Code: CSA00055,
Was this page helpful?
YOUR FEEDBACK