Tailored Management of Sclerotinia in Canola with the SclerotiniaCM app
Author: Art Diggle, Steve Marcroft, Kurt Lindbeck, Ravjit Khangura, Audrey Leo, Ciara Beard, Andrea Hills, Angela van de Wouw, Andrew Ware, Susie Sprague and Jean Galloway | Date: 25 Feb 2019
Key Messages
- The app will support users to make the most profitable decisions about fungicide use to manage Sclerotinia stem rot in canola.
- SclerotiniaCM is designed for quick and efficient use with clients in the field.
- SclerotiniaCM produces results that are tailored for individual paddocks and generates email reports right from the field.
Aims
Currently growers apply fungicide to control Sclerotinia in canola crops based on previous disease severity in a paddock and current weather conditions. Advisers want more guidance on fungicide application decision making. The development of SclerotiniaCM aims to deliver an iPad and Android tablet-based app to help with spray decision to manage Sclerotinia stem rot of canola. The app will provide evidence-based information that estimates returns from spraying for individual paddocks.
Method
Design
SclerotiniaCM has combined experimental data and expert knowledge to determine the probability of economic benefit of fungicide application to any canola crop in Australia. The app can be used in-season at the decision-making time, it requires the agronomist to input individual paddock data, recent weather and expected weather and then produces a probability of return from fungicide application.
The app uses Monté Carlo simulation (a technique used to understand the impact of risk in forecasting models) to generate the expected result from distributions of expected yield in the absence of disease, grain price, loss of yield in the absence of fungicide and efficacy of fungicide. Correlations between these factors are included in the calculation.
The app predictions and level of uncertainty were initially set based on expert opinion from leading Australian pathologists, and have subsequently been recalibrated based on available field data. It is intended that SclerotiniaCM will continually be updated to reflect new experimental results as they become available. This semi-quantitative approach to calibration of the app recognises the fact that management decisions for Sclerotinia are, and must be, made each year with information that is available to each manager. Bringing the best available information to bear in an easily understood format will assist in this process.
Testing
Pre-release versions of SclerotiniaCM were used by several testers with their clients in the field in the 2018 growing season. These testers, acknowledged below, provided valuable feedback that has helped with refinements to the final design.
Results
An example
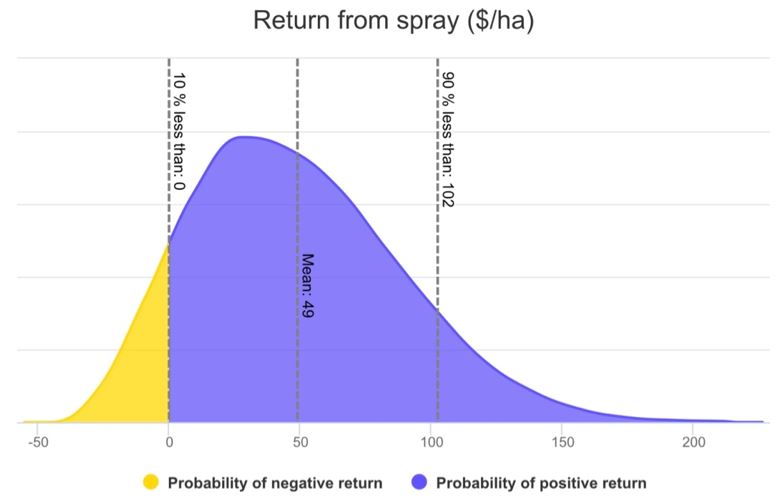
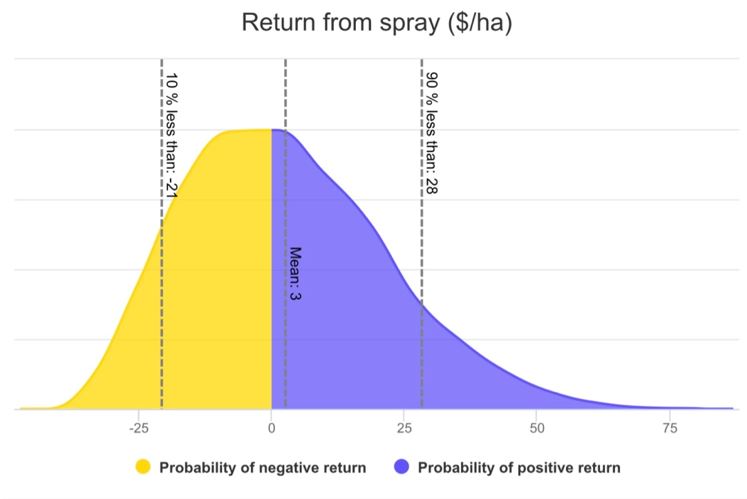
Table 1 lists input values for SclerotiniaCM for two example situations, which differ only in the target crop yield (2.5 or 1.2t/ha). In both cases, the difference in net return resulting from a first application of foliar fungicide at 30% flowering is estimated. For situation 1 with a target crop yield in the absence of disease of 2.5t/ha, a foliar application of fungicide would result in the mean net return of $49/ha. In 90% of years the net return would be expected to be less than $102/ha, and in 10% of years a net loss would be expected (Fig.1). For situation 2, with a target crop yield in the absence of disease of 1.2t/ha, the mean net return is $3/ha. In 90% of years the net return would be expected to be less than $28/ha, with a loss of more than $21/ha in 10% of years (Fig.2).
Table 1. Settings for SclerotiniaCM for situations 1 and 2.
App setting | Value | App setting | Value |
|---|---|---|---|
Situation 1 target yield (t/ha) | 2.5 | History of broadleaf crops | 3 years in 10 |
Situation 1 yield range (t/ha) | 1.5 – 3 | History of sclerotinia yield loss | 8 years in 10 |
Situation 2 target yield (t/ha) | 1.2 | Bloom stage | 30% |
Situation 2 yield range (t/ha) | 0.7 – 1.4 | Wet days in the last 3 weeks | 10 |
Grain price ($/ha) | 550 | Expected wet canopy days next week | 3 |
Grain price range ($/ha) | 525 - 580 | Expected wet canopy days in week after next | 3 |
Production cost ($/ha) | 350 | Mitigation by spray | 50% |
Surface soil texture | Sandy | Spray cost ($/ha) | 40 |
Fig.1. Probability density from SclerotiniaCM for net return from a first foliar fungicide spray at 30% bloom for situation 1 where target yield is 2.5t/ha and all other settings are as shown in Table 1.
Fig.2. Probability density from SclerotiniaCM for net return from a first foliar fungicide spray at 30% bloom for situation 2 where target yield is 1.2t/ha and all other settings are as shown in Table 1.
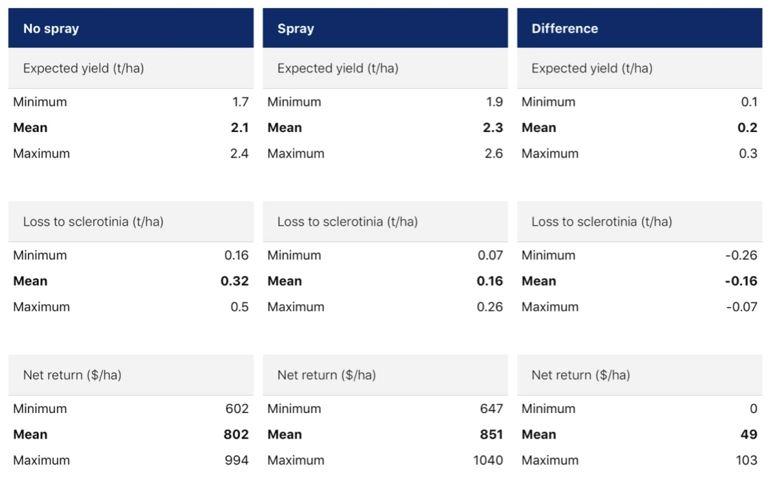
Fig.3. The summary view from SclerotiniaCM for a first foliar fungicide spray at 30% bloom for situation 1 where target yield is 2.5t/ha and all other settings are as shown in Table 1.
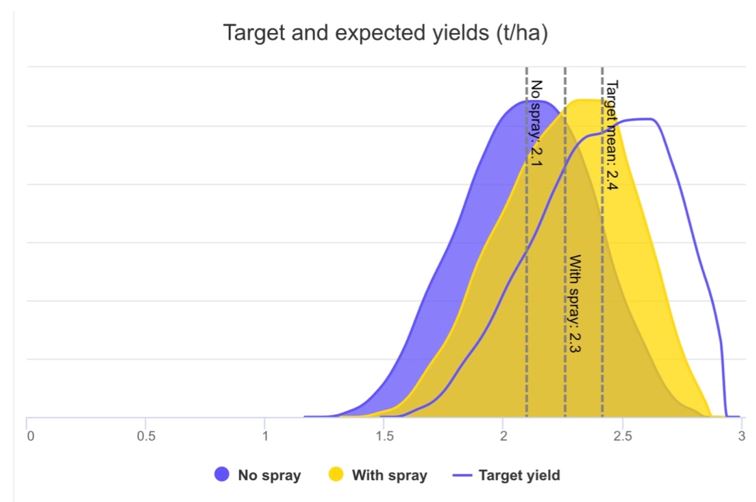
Fig.4. Probability density from SclerotiniaCM for target yield and predicted yield with and without foliar fungicide spray for a first foliar spray at 30% bloom for situation 1 where target yield is 2.5t/ha and all other settings are as shown in Table 1.
SclerotiniaCM has several alternative views of the predicted results. Figure 3 shows the summary view for SclerotiniaCM for situation 1 where the target yield was 2.5t/ha. SclerotiniaCM indicates a substantial positive net return both with and without application of fungicide and shows the same minimum, mean and maximum estimates of the dollar return from spraying that are shown in Figure 2. Figure 4 shows the distribution of yield that would be expected if there was no disease, and the distributions that are actually expected in the presence of disease where fungicide is or is not applied.
Feedback
Testers indicated that SclerotiniaCM was a useful aid in discussions with growers about spray decisions, and in general testers agreed with the output of the app. Most testers indicated a preference for the summary view, as shown in Figure 3, but some preferred the net return view shown in Figures 1 and 2.
A notable feature of the 2018 growing season was that actual yields for many paddocks were greater than the expected yields at early flowering. This factor will have tended to reduce the app’s estimate of loss to Sclerotinia, however estimated range of effects was reasonable. As a result of feedback from testers the release version of the app has a reporting function that allows results from the app to be sent to clients or stored for future reference. The release version of the app also has a comprehensive tips function to ensure that users understand all of the settings and features of the app.
Conclusion
The SclerotiniaCM app has been designed to provide site and season-specific information to grain growers to inform their management decisions. The app provides information in terms of the mean, minimum and maximum change in net return that can be expected from application of foliar fungicide. The app allows canola growers to apply their own risk preferences in making decisions, rather than recommending particular management options.
The app is delivered on tablets and has a straight-forward user interface that asks for inputs that can be readily estimated by agronomic specialists. We envisage that the main use case for SclerotiniaCM will be as an aid to conversations about disease management between growers and their advisers, and that these conversations will typically occur in the field.
Sclerotinia CM is available for download for iPads or Android tablets from the iTunes store or from Google Play.
Acknowledgments
The research undertaken as part of this project is made possible by the significant contributions of growers through both trial cooperation and GRDC investment, the authors would like to thank them for their continued support. Development and support has been provided by a collaboration of: Department of Primary Industries and Regional Development, Western Australia; University of Melbourne; Marcroft Grains Pathology; New South Wales Department of Primary Industries; South Australian Research and Development Institute; and Commonwealth Scientific and Industrial Research Organisation. We acknowledge Fumie Horiuchi, who produced the apps including architecture, programming and publication; Steve Collins who provided interface design; Rebecca O’Leary who has conducted calibration of the app; Jenny Davidson and Alexander Idnurm who provided valuable feedback on app design; and Peter Bostock, Alice Butler, David Cameron, Bonnie Jupp, Chris Pinkney, Rob Sands, David Stead, Bec Swift, and Chris Wilkins and their clients who tested pre-release versions of SclerotiniaCM and provided valuable feedback.
GRDC Project Number: 9176863
Paper reviewed by: Steve Marcroft, Marcroft Grains Pathology
GRDC Project Code: 9176863,
Was this page helpful?
YOUR FEEDBACK


